. 2020 Sep:59:102912.
doi: 10.1016/j.ebiom.2020.102912. Epub 2020 Jul 29.

Obesity-related hypoxia via miR-128 decreases insulin-receptor expression in human and mouse adipose tissue promoting systemic insulin resistance

Affiliations

Obesity-related hypoxia via miR-128 decreases insulin-receptor expression in human and mouse adipose tissue promoting systemic insulin resistance

Biagio Arcidiacono et al. EBioMedicine. 2020 Sep.

Abstract

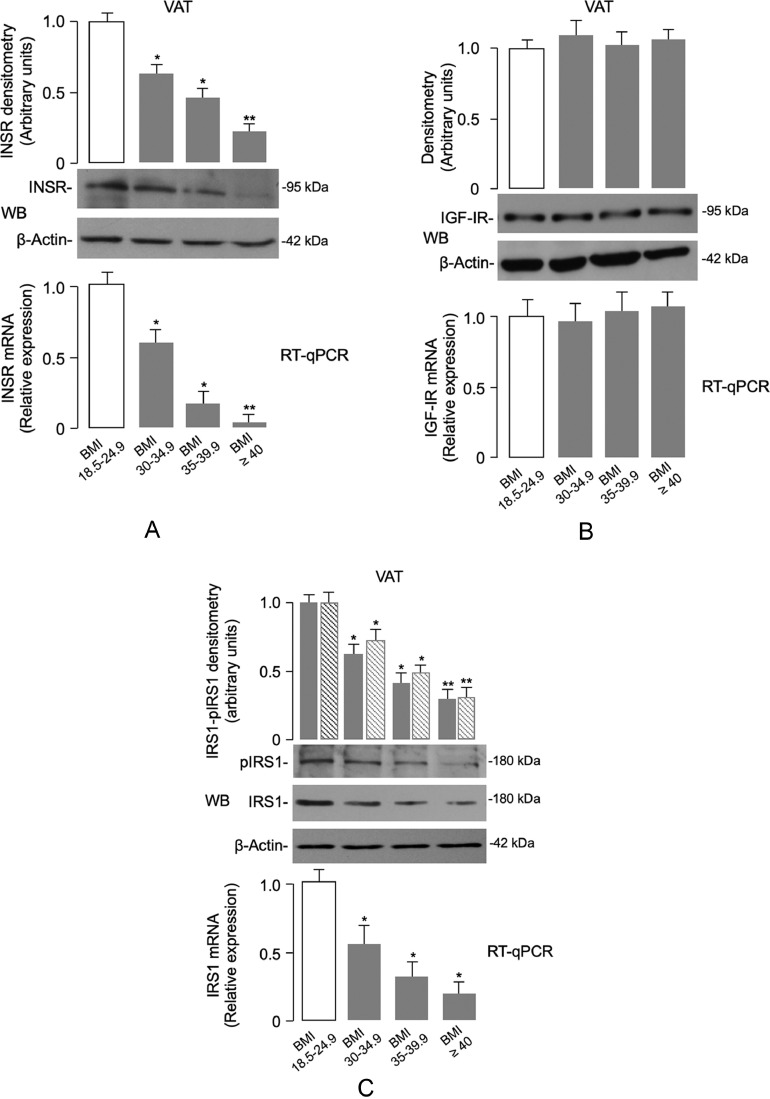
Background: Insulin resistance in visceral adipose tissue (VAT), skeletal muscle and liver is a prominent feature of most patients with obesity. How this association arises remains poorly understood. The objective of this study was to demonstrate that the decrease in insulin receptor (INSR) expression and insulin signaling in VAT from obese individuals is an early molecular manifestation that might play a crucial role in the cascade of events leading to systemic insulin resistance.

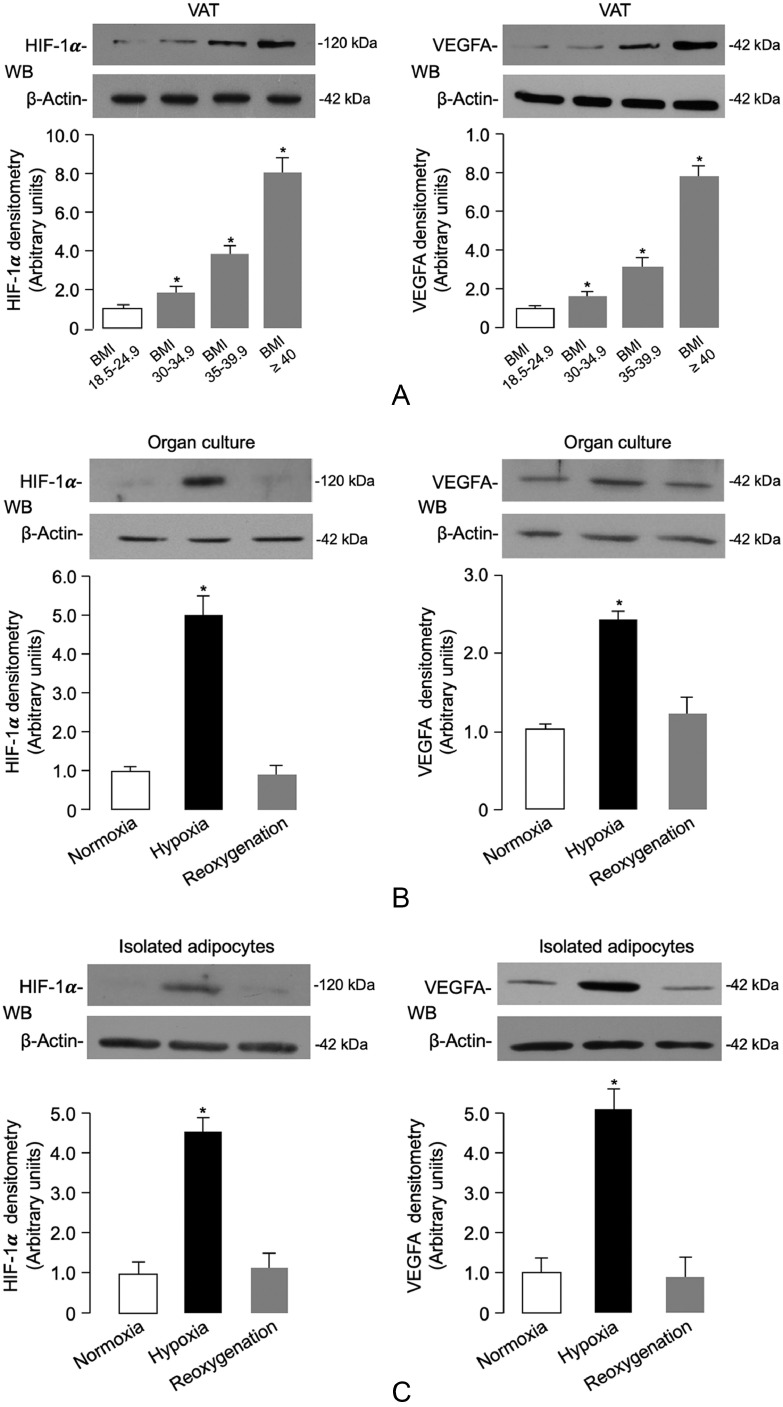
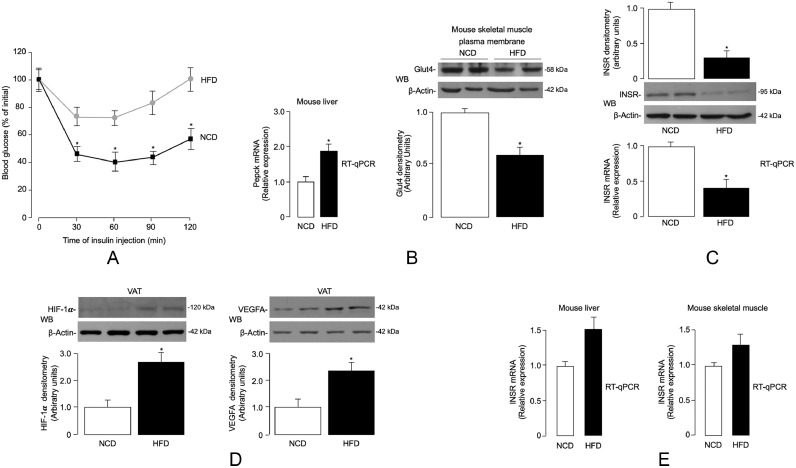
Methods: To clarify the role of INSR and insulin signaling in adipose tissue dysfunction in obesity, we first measured INSR expression in VAT samples from normal-weight subjects and patients with different degrees of obesity. We complemented these studies with experiments on high-fat diet (HFD)-induced obese mice, and in human and murine adipocyte cultures, in both normoxic and hypoxic conditions.

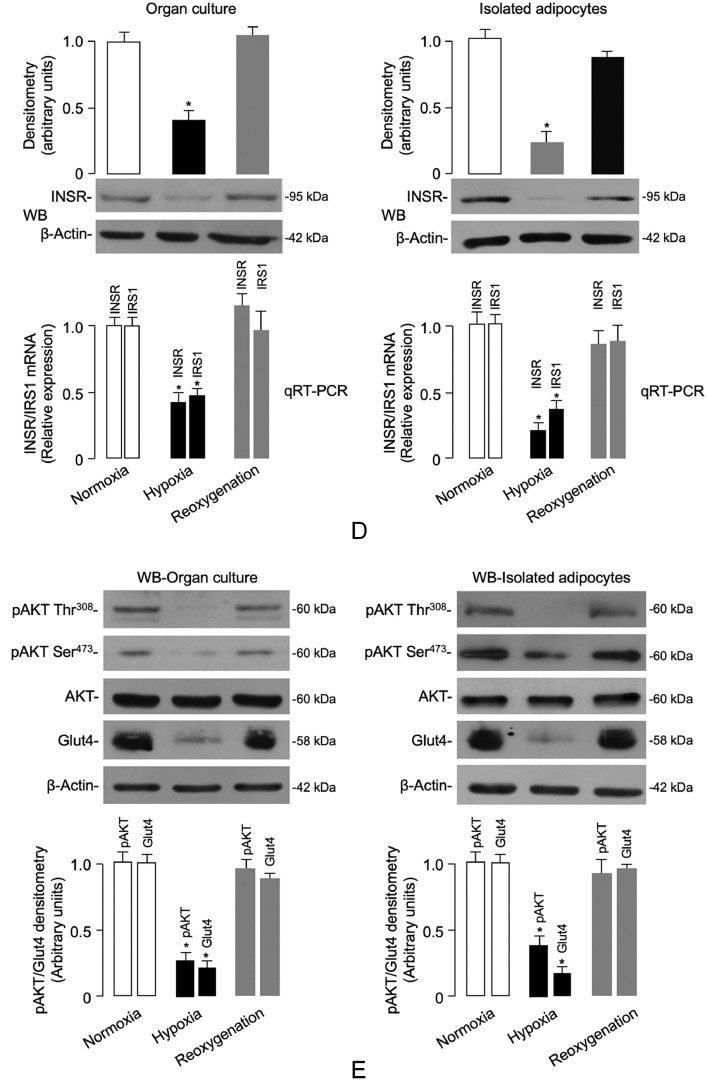
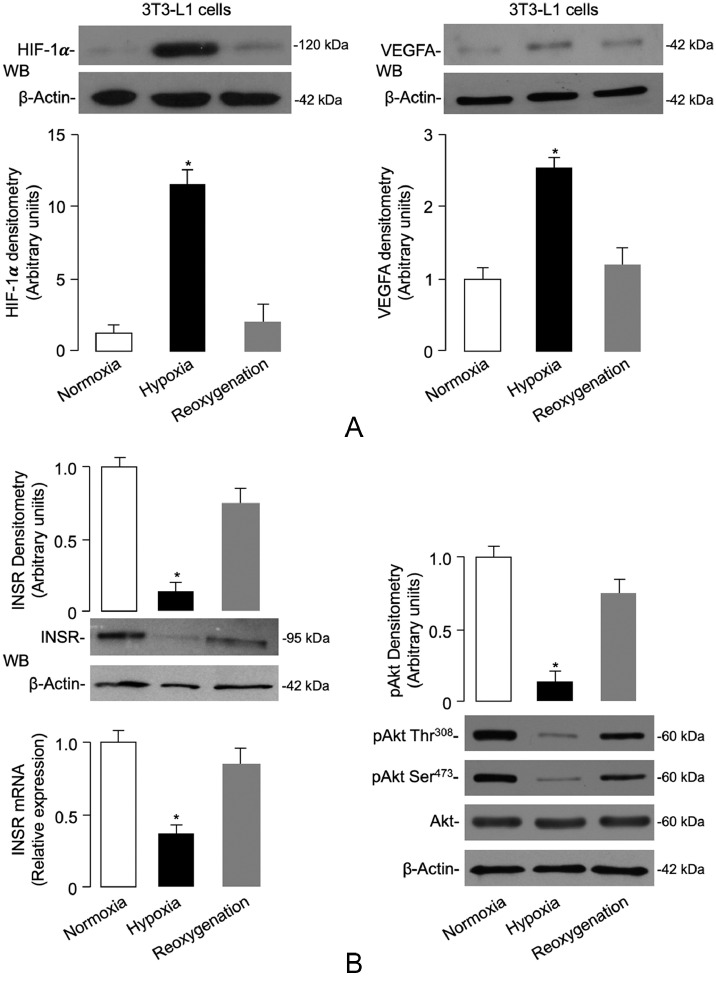
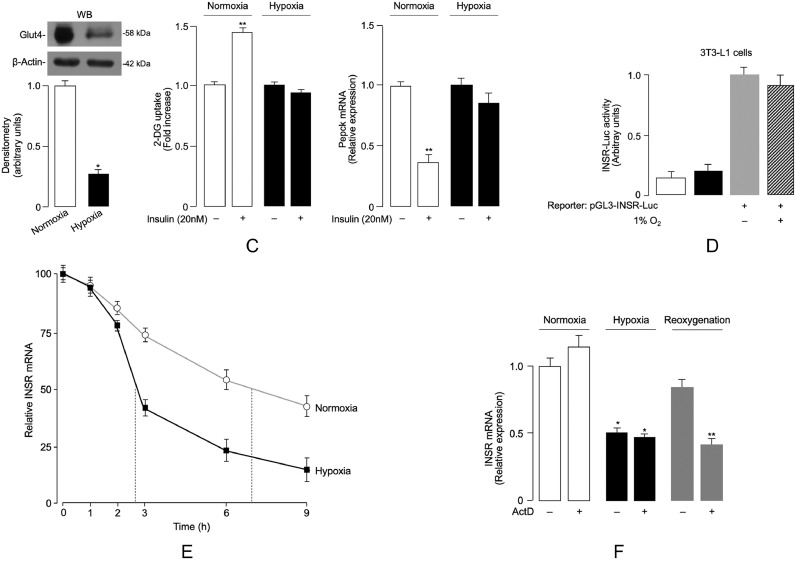
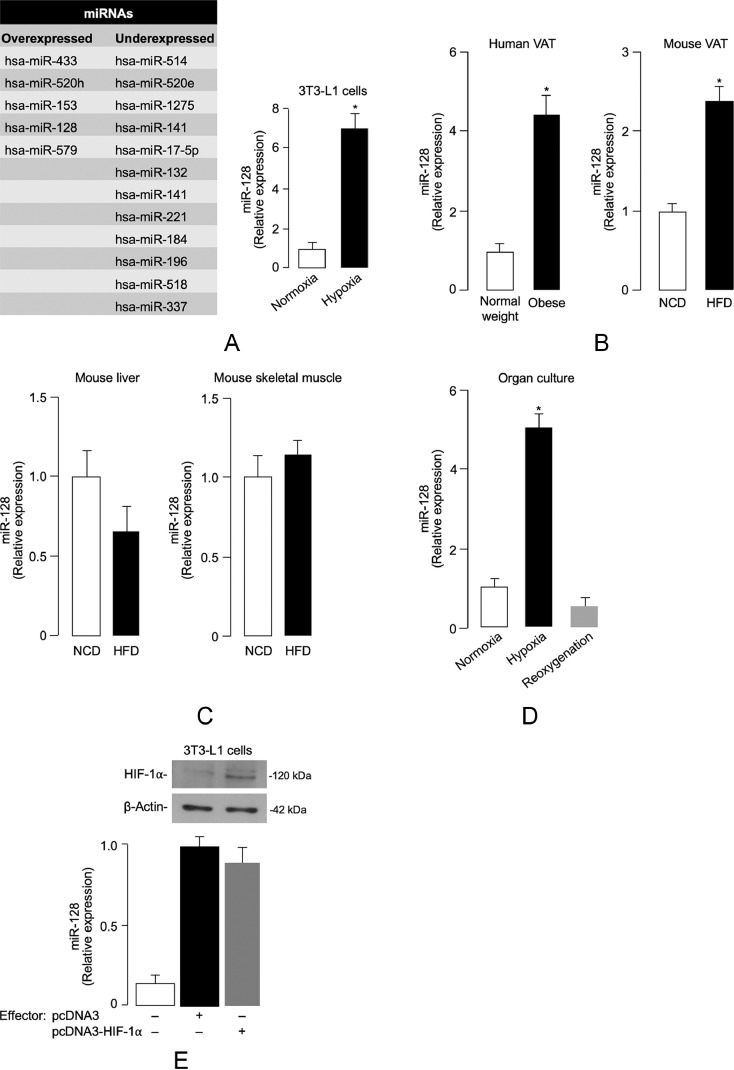
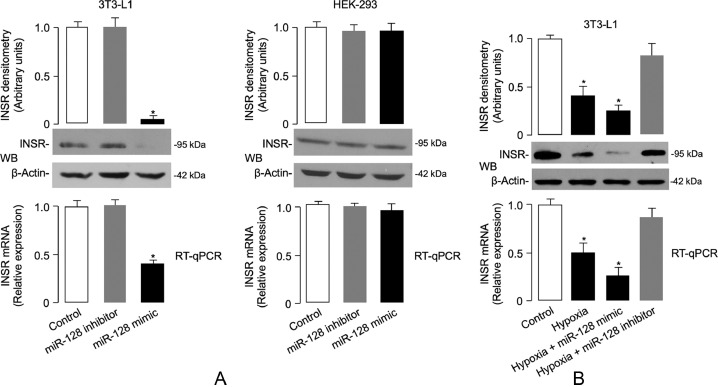
Findings: An inverse correlation was observed between increasing body mass index and decreasing INSR expression in VAT of obese humans. Our results indicate that VAT-specific downregulation of INSR is an early event in obesity-related adipose cell dysfunction, which increases systemic insulin resistance in both obese humans and mice. We also provide evidence that obesity-related hypoxia in VAT plays a determinant role in this scenario by decreasing INSR mRNA stability. This decreased stability is through the activation of a miRNA (miR-128) that downregulates INSR expression in adipocytes.

Interpretation: We present a novel pathogenic mechanism of reduced INSR expression and insulin signaling in adipocytes. Our data provide a new explanation linking obesity with systemic insulin resistance.

Funding: This work was partly supported by a grant from Nutramed (PON 03PE000_78_1) and by the European Commission (FESR FSE 2014-2020 and Regione Calabria).

Keywords: Adipose-tissue dysfunction; Hypoxia; Insulin receptor; Insulin resistance; Obesity; mRNA decay; miRNA.


Conflict of interest statement

Declaration of Competing Interest The authors declare no conflicts of interest.

Figures

Fig 1
Fig. 1
INSR, IGF-IR and IRS1 expression in human VAT. (A) INSR mRNA and protein levels from the normal-weight and obese individuals were measured by real-time quantitative PCR (RT-qPCR) and Western blot (WB), respectively. The pattern of INSR mRNA and protein expression is shown in VAT samples from subjects in each BMI category (BMI 18.5–24.9 = 20 normal-weight subjects; BMI 30–34.9 = 7 obese subjects; BMI 35–39.9 = 8 obese subjects; BMI ≥ 40 = 11 obese subjects). A representative WB is shown. β-actin was employed as a control of protein loading. Densitometric scanning of INSR protein signals are shown in bar graphs. Levels of mRNA were normalized to RPS9 mRNA. Results are shown as mean ± s.e.m. *P < 0.05 vs normal-weight subjects; **P < 0.05 vs normal-weight subjects and vs individuals with BMI 30–34.9 [Student's t-test]. (B) IGF-IR mRNA and protein levels were measured as in (A), in VAT from normal-weight subjects and obese individuals. Bars represent the means of RT-qPCR and densitometric analysis of WB results from individuals in each BMI category. (C) Quantification of IRS1 mRNA and protein in VAT samples from subjects in each BMI category was as in (A). Densitometric scanning of total IRS1 (gray bars) and phosphorylated IRS1 (dashed bars) bands from representative WBs is shown. *P < 0.05 vs normal-weight subjects; **P < 0.05 vs normal-weight subjects and vs individuals with BMI 30–34.9 [Student's t-test].
Fig 2
Fig. 2
Hypoxia-induced HIF-1α/VEGFA expression, INSR levels and signaling in VAT and isolated visceral adipocytes. (A) HIF-1α and VEGFA protein expression was measured by WB in whole VAT fragments from all subjects in each BMI group. BMI of 18.5–24.9 is representative of 20 normal-weight subjects; BMI 30–34.9 is representative of 7 obese subjects; BMI 35–39.9 is representative of 8 obese subjects; and BMI ≥ 40 is representative of 11 obese subjects. BMI bars are the mean ± s.e.m of densitometric analysis of WB results from each group. β-actin was the loading control. *P < 0.05 vs normal-weight subjects [Student's t-test]. (B,C) HIF-1α and VEGFA protein expression was measured by WB in organ cultures and isolated adipocytes obtained from VAT of 12 normal-weight subjects, which were divided into groups of four each, and placed either in normoxia (7% O2) or hypoxia (1% O2) for 48 h. Reoxygenation was reestablished by placing hypoxic tissue/cells in normoxic conditions for 24 h. Representative WBs and mean densitometric analyses of WBs performed in organ cultures/isolated adipocytes under different oxygen tension (n = 4 independent samples per group) are shown. *P < 0.05 vs normoxia [Student's t-test].
Fig 2
Fig. 2
(Continued) (D,E) The expression levels of INSR, IRS1, total Akt and insulin-stimulated pAkt (Ser473/Thr308), and plasma membrane Glut4 content, were measured by RT-qPCR and/or WB in both organ culture tissue and isolated adipocytes from VAT samples of normal-weight subjects (n = 4 independent samples per group), under the same normoxic/hypoxic conditions as in (B,C). Representative WBs and mean densitometric analyses of WBs are shown. *P < 0.05 vs normoxia [Student's t-test].
Fig 3
Fig. 3
ITT, Pepck, Glut4, HIF-1α/VEGFA and INSR expression in DIO mice. (A) ITT. Black squares, NCD mice (n = 10); gray circles, HFD mice (n = 10). Values are expressed as mean ± s.e.m. *P < 0.05 vs NCD mice [Student's t-test]. (B) Liver phosphoenolpyruvate carboxykinase (Pepck) mRNA, and Glut4 protein expression in skeletal muscle plasma membranes, as measured by RT-qPCR and WB analysis, respectively, in NCD (n = 10) and HFD (n = 10) mice. A representative WB is shown, together with densitometric analyses of multiple immunoblots (n = 10 animals for each group). *P < 0.05 vs NCD mice [Student's t-test]. (C) INSR mRNA and protein levels in VAT from NCD and HFD mice, as measured by RT-qPCR and WB, respectively. Data from each analysis are representative of 10 mice for each group. *P < 0.05 vs NCD mice [Student's t-test]. (D) HIF-1α and VEGFA protein expression in VAT from NCD (n = 10) and HFD (n = 10) mice, as measured by WB. β-actin, loading control. Representative WBs and mean densitometric analyses of WBs are shown. *P < 0.05 vs NCD [Student's t-test]. (E) INSR mRNA levels in liver and skeletal muscle from NCD (n = 10) and HFD (n = 10) mice, as measured in (C).
Fig 4
Fig. 4
Hypoxia-induced changes in INSR expression, and insulin signaling and INSR mRNA decay in mouse 3T3-L1 adipocytes. (A) HIF-1α and VEGFA mRNA and protein expression were measured in 3T3-L1 adipocytes that underwent hypoxia and hypoxia/reoxygenation for 48 h. Data for RT-qPCR and WB are representative of at least 3 independent experiments in duplicate for each condition tested. *P < 0.05 vs control cells (normoxia) [Student's t-test]. (B) INSR mRNA levels and protein expression, and total Akt and pAkt (Ser473/Thr308) in normoxic and hypoxic 3T3-L1 adipocytes, as measured by RT-qPCR and WB, under the same experimental conditions as in (A). Mean densitometric analysis of four to six immunoblots for INSR and pAkt is shown. *P < 0.05 vs normoxia [Student's t-test].
Fig 4
Fig. 4
(Continued) (C) Glut4 protein content and the effect of insulin on 2-deoxy-d-glucose (2DG) uptake and Pepck mRNA levels in differentiated 3T3-L1 adipocytes under normoxic and hypoxic conditions. A representative WB of Glut4 in plasma membrane is shown, together with densitometric analysis. Data are means ± s.e.m. of 3 independent experiments, each in replicates of 3. *P < 0.05 vs normoxia; **P < 0.05 vs normoxic insulin-free cells [Student's t-test]. (D) pGL3-INSR Luciferase (Luc) reporter plasmid (300 ng) was transfected into differentiated 3T3-L1 adipocytes, incubated either in normoxia or hypoxia for 48 h, and Luc-activity was measured 48 h later. Data are means ± s.e.m. for 3 separate experiments performed in duplicate. Values in hypoxia (dashed bar) are expressed relative to the Luc activity obtained in transfections with the pGL3-INSR Luc in normoxic condition (gray bar), which is assigned an arbitrary value of 1. White bar, mock (no DNA); black bar, pGL3-vector without an insert. (E) INSR mRNA decay in differentiated 3T3-L1 cells, cultured in normoxic (open circles) and hypoxic (solid squares) conditions. Results are the mean ± s.e.m. of triplicates from 3 separate assays. (F) Hypoxia/reoxygenation-mediated effects on INSR mRNA. After 24 h exposure to hypoxia alone, 3T3-L1 mature adipocytes were treated or not with actinomycin D (ActD, 2 µg/mL) and cells were subjected to hypoxia or reoxygenation for further 8 h. Cells in normoxia, with or without ActD, cultured for the same time period, served as control. RT-qPCR was performed to quantify INSR mRNA levels. Results are the mean ± s.e.m. of triplicates from 3 separate experiments. *P < 0.05 vs normoxia; **P < 0.05 vs cells under reoxygenation, without (–) ActD [Student's t-test].
Fig 5
Fig. 5
Hypoxia-related miRNA expression. (A) Differentially expressed miRNAs in hypoxic 3T3-L1 adipocytes vs normoxic cells. miRNAs whose expression was either upregulated (> 2-fold) or downregulated (< 0.5) after hypoxia treatment (1% O2) of cells are shown in the diagram (left). The expression levels of miR-128 in normoxic and hypoxic 3T3-L1 adipocytes were determined by RT-qPCR (right); results are the means ± s.e.m. from 3 independent experiments, each in triplicate; P < 0.001 vs normoxia [Student's t-test]. (B) miR-128 expression in VAT from normal-weight and obese individuals (n = 10 per each group), and mice under NCD- and HFD-fed conditions (n = 10 per each group) for 15 weeks. In the obese subject category, VAT samples were as follows: 3 (BMI 30–34.9); 3 (BMI 35–39.9); 4 (BMI ≥ 40). Data are the means ± s.e.m. of 2 independent RT-qPCR assays from each individual tissue sample. *P < 0.05 vs control (white bar) [Student's t-test]. (C) miR-128 levels in liver and skeletal muscle from NCD- and HFD-fed mice as measured in (B). (D) miR-128 levels as measured by RT-qPCR in VAT from normal-weight, non-obese individuals (n = 10), placed in organ culture for 48 h, either in normoxic or hypoxic environment, or after reoxygenation. P < 0.001 vs normoxia [Student's t-test]. (E) Normoxic 3T3-L1 adipocytes were transiently transfected with an effector plasmid (1 µg) expressing HIF-1α. After 48 h, miR-128 levels were measured by RT-qPCR. Results are the mean ± s.e.m. of triplicates from 3 independent assays. A representative WB of HIF-1α is shown for each condition. White bar, mock (no DNA); black bar, pcDNA3-vector without an insert; gray bar, pcDNA3-HIF-1α effector vector.
Fig 6
Fig. 6
miR-128 and INSR expression. (A) Determination of endogenous INSR mRNA and protein expression levels in 3T3-L1 adipocytes and HEK-293 cells transfected with either a miR-128 inhibitor or mimic by RT-qPCR and WB, respectively. (B) Endogenous INSR mRNA and protein expression levels were measured as in (A), in 3T3-L1 adipocytes transfected with miR-128 mimic or miR-128 inhibitor and exposed to hypoxia for 48 h before INSR expression was determined. Representative WBs are shown. β-actin, control of protein loading. Densitometric scanning of INSR protein signals are shown in bar graphs. Results in (A,B) are representative of at least 3 independent experiments, each in triplicate: bars are mean ± s.e.m. *P < 0.05 vs normoxic untransfected cells (control, white bar) [Student's t-test].

References

    1. Flegal K.M., Carroll M.D., Kit B.K., Ogden C.L. Prevalence of obesity and trends in the distribution of body mass index among US adults, 1999-2010. J Am Med Assoc. 2012;307:491–497. - PubMed
    1. Kahn S.E., Hull R.L., Utzschneider K.M. Mechanisms linking obesity to insulin resistance and type 2 diabetes. Nature. 2006;444:840–846. - PubMed
    1. Reaven G.M. The insulin resistance syndrome: definition and dietary approaches to treatment. Annu Rev Nutr. 2005;25:391–406. - PubMed
    1. Kershaw E.E., Flier J.S. Adipose tissue as an endocrine organ. J Clin Endocrinol Metab. 2004;89:2548–2556. - PubMed
    1. Greco M., Chiefari E., Montalcini T., Accattato F., Costanzo F.S., Pujia A. Early effects of a hypocaloric, mediterranean diet on laboratory parameters in obese individuals. Mediat Inflamm. 2014;2014 - PMC - PubMed

MeSH terms