Comparative Study
. 2020 Oct;120(10):1662-1671.e10.
doi: 10.1016/j.jand.2020.04.022. Epub 2020 Jul 29.

Types and Amounts of Nonnutritive Sweeteners Purchased by US Households: A Comparison of 2002 and 2018 Nielsen Homescan Purchases

Comparative Study

Types and Amounts of Nonnutritive Sweeteners Purchased by US Households: A Comparison of 2002 and 2018 Nielsen Homescan Purchases

Elizabeth K Dunford et al. J Acad Nutr Diet. 2020 Oct.

Erratum in

  • Corrigendum.
    [No authors listed] [No authors listed] J Acad Nutr Diet. 2021 Dec;121(12):2576. doi: 10.1016/j.jand.2021.09.014. J Acad Nutr Diet. 2021. PMID: 34802688 No abstract available.

Abstract

Background: Purchases of foods containing nonnutritive sweetener (NNS) alone or in combination with caloric sweeteners (CS) has increased in recent years in the United States. At the same time clinical evidence is emerging of different cardiometabolic effects of each NNS type.

Objective: To examine the prevalence and volume purchased of commonly consumed types of NNS in packaged food and beverage products comparing 2002 and 2018 using data from nationally representative samples of US households.

Participants/setting: Nielsen Homescan Consumer Panels (The Nielsen Company); 2002 and 2018.

Main outcome measures: Prevalence and volume of foods and beverages purchased containing CS, NNS, both CS and NNS, or neither CS nor NNS, as well as prevalence and volume of products containing specific NNS types.

Statistical analyses performed: Differences examined using Student t test, P value of <.05 considered significant.

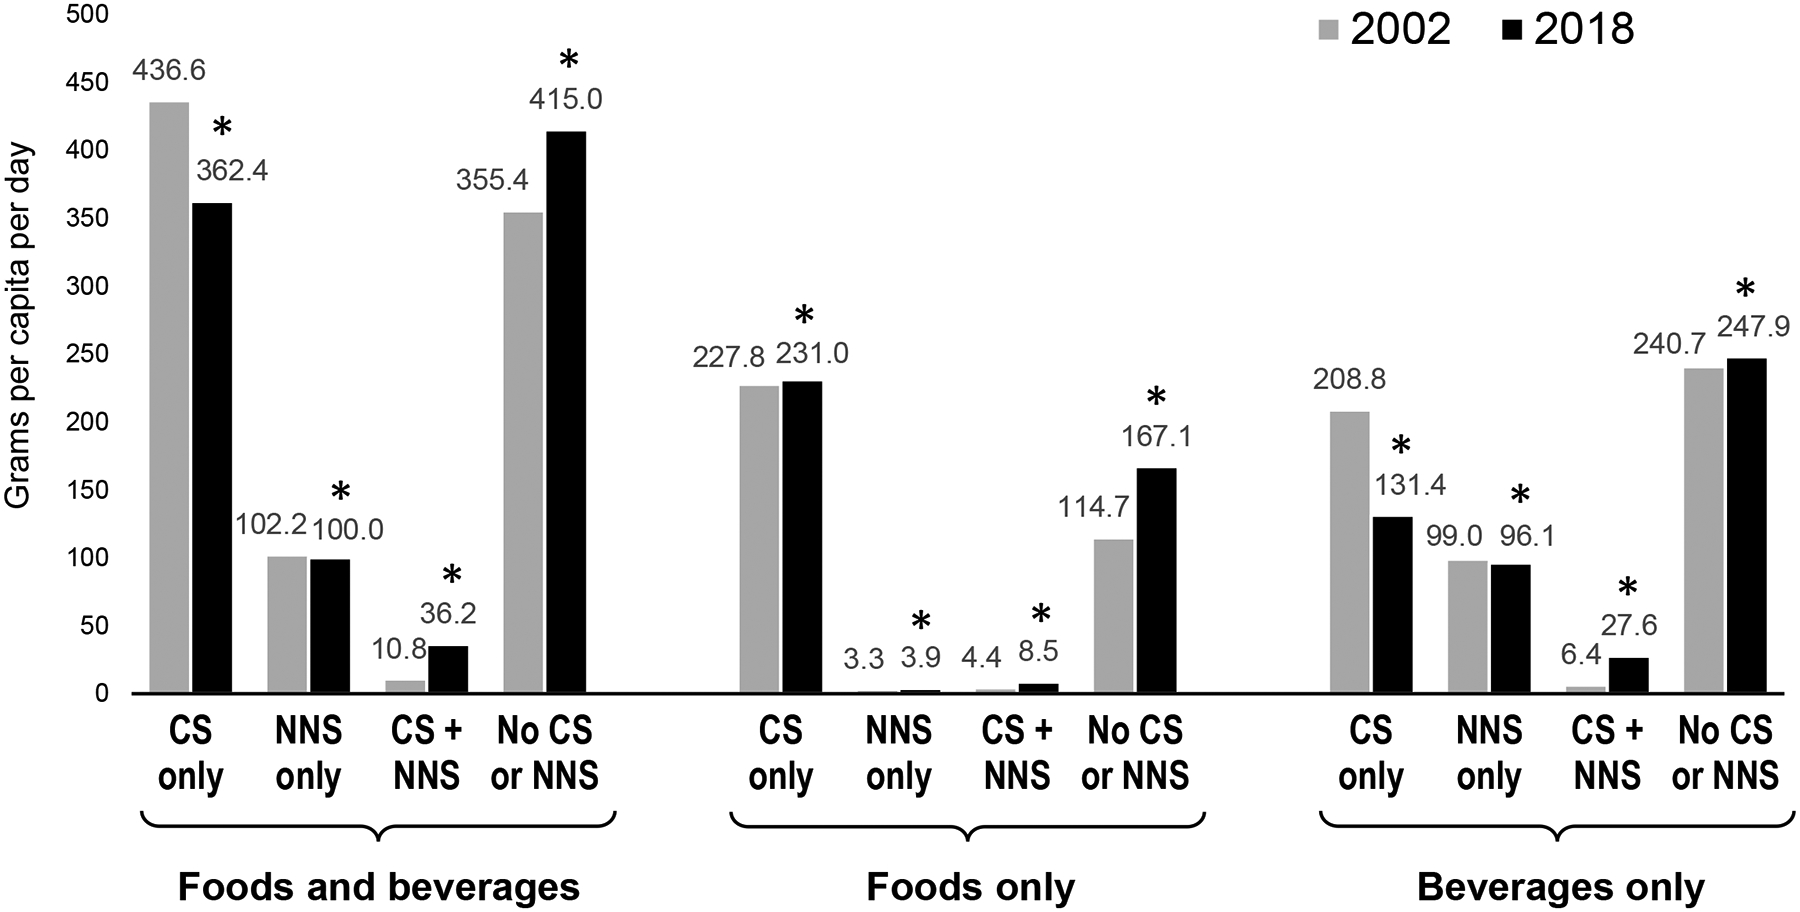
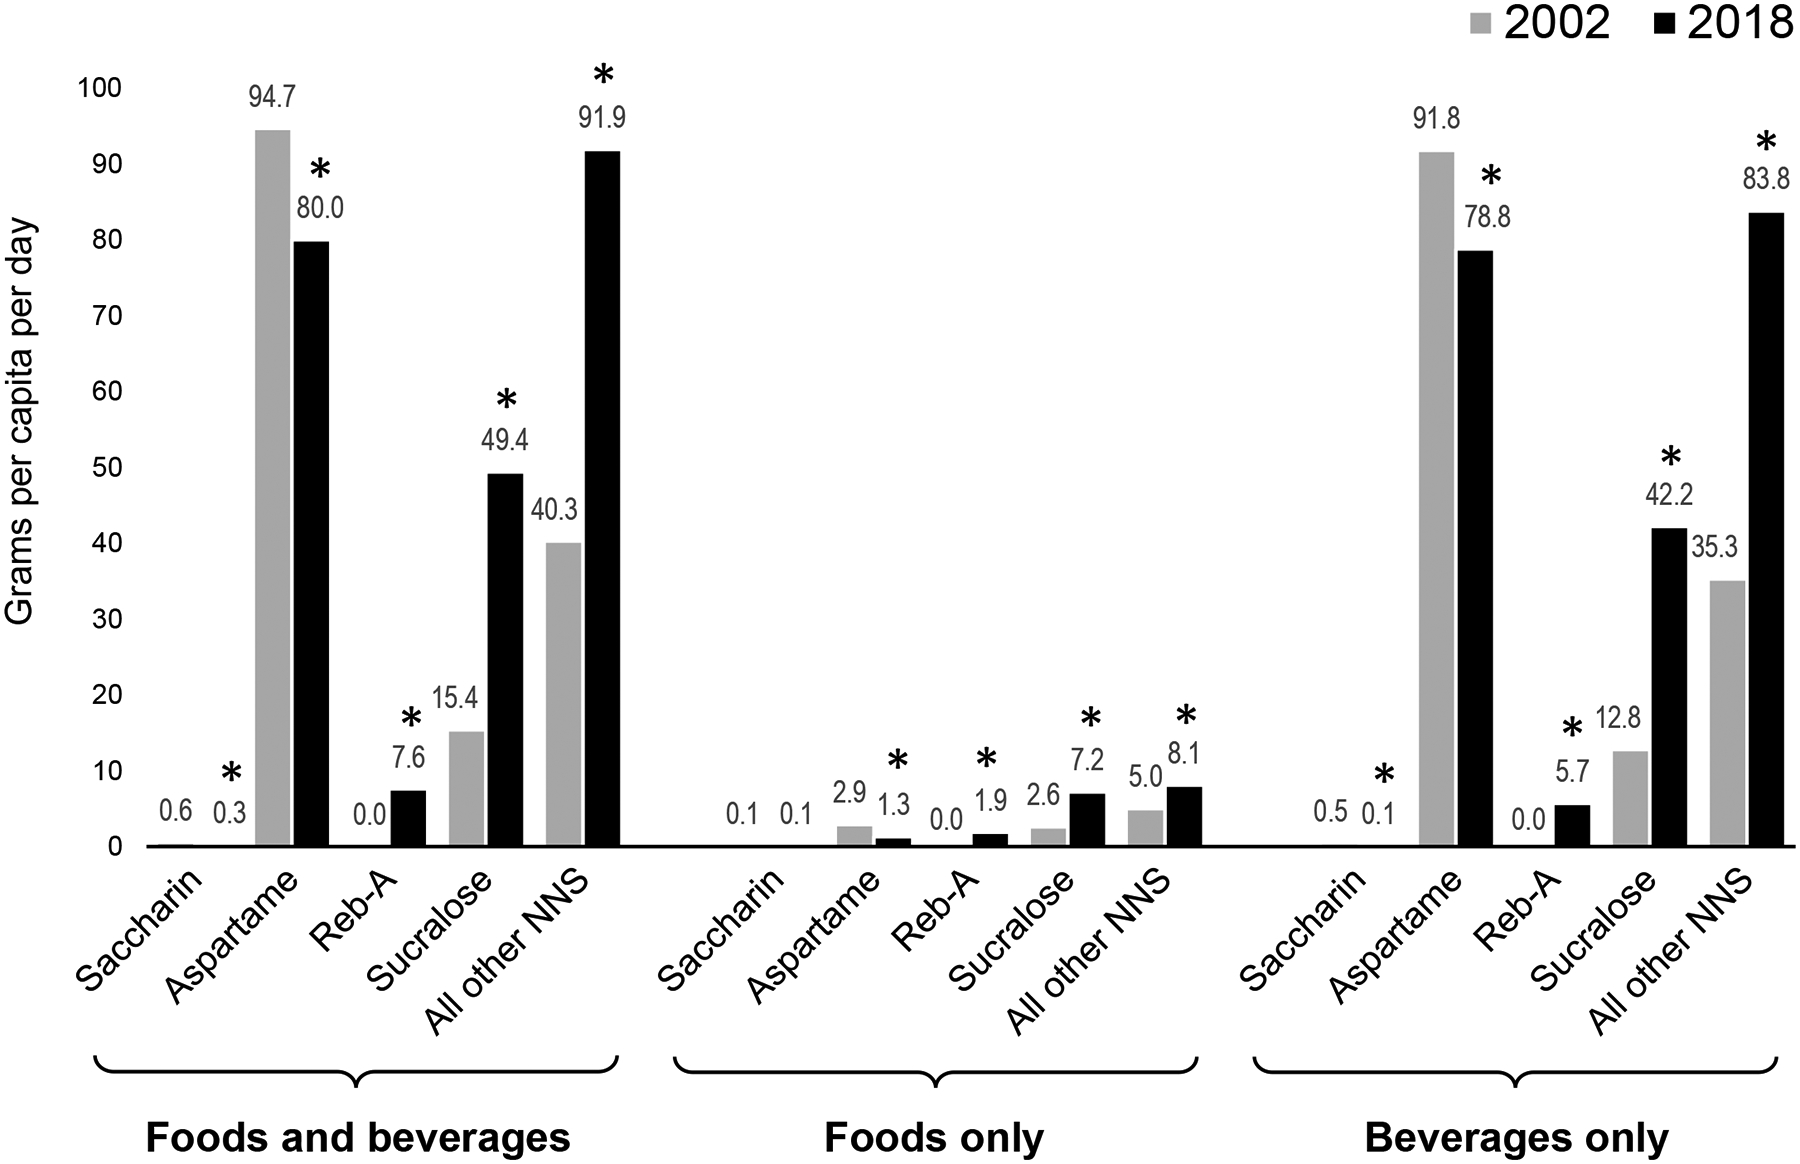
Results: Volume of products purchased containing CS decreased comparing 2002 and 2018 (436.6 ± 1.6 to 362.4 ± 1.3 g/d; P < .05), yet increased for products containing both CS and NNS (10.8-36.2 g/d; P < .05). Regarding specific types of NNS, changes were noted in the prevalence of households purchasing products containing saccharin (1.3%-1.1%; P < .05), aspartame (60.0%-49.4%; P < .05), rebaudioside A (0.1%-25.9%) and sucralose (38.7%-71.0%). Non-Hispanic whites purchased twice the volume of products containing NNS compared to Hispanics and non-Hispanic blacks in both years. Beverages were predominantly responsible for larger volume per capita purchases of products containing only NNS as well as both CS and NNS.

Conclusions: A decline in purchases of products containing CS occurred in tandem with an increase in purchases of products containing both CS and NNS, along with a large shift in the specific types of NNS being purchased by US households. New NNS types enter the market regularly, and it is important to monitor changes in the amount of NNS and products containing NNS that consumers purchase.

Keywords: Caloric sweetener; Food supply; Nonnutritive sweetener; Processed foods.


Figures

Figure 1:
Figure 1:. Estimated proportion of U.S. householdsa that purchased products containing caloric sweeteners (CS) and non-nutritive sweeteners (NNS) in a comparison of 2002 vs. 2018
a Sample sizes of households were 39,300 in 2002 and 61,101 in 2018. Authors’ calculations are based in part on data reported by Nielsen through its Homescan Services for all food categories, including beverages and alcohol for the years 2002 and 2018 from Nielsen Homescan Household Panel across the U.S. market, The Nielsen Company, 2019. The conclusions drawn from the Nielsen data are those of the authors and do not reflect the views of Nielsen. Nielsen is not responsible for and had no role in, and was not involved in, analyzing and preparing the results reported herein. * P<0.05 CS only: Products that contain caloric sweeteners as the only type of sweetener; NNS only: Products that contain non-nutritive sweeteners as the only type of sweetener; CS + NNS: Products that contain both caloric and non-nutritive sweeteners No CS or NNS: Products that neither contain caloric sweeteners or non-nutritive sweeteners.
Figure 2:
Figure 2:. Estimated volume of food and beverage products containing non-nutritive sweeteners (NNS) and caloric sweeteners (CS) purchased by U.S. householdsa in a comparison of 2002 vs. 2018
a Sample sizes of households were 39,300 in 2002 and 61,101 in 2018. Authors’ calculations are based in part on data reported by Nielsen through its Homescan Services for all food categories, including beverages and alcohol for the years 2002 and 2018 from Nielsen Homescan Household Panel across the U.S. market, The Nielsen Company, 2019. The conclusions drawn from the Nielsen data are those of the authors and do not reflect the views of Nielsen. Nielsen is not responsible for and had no role in, and was not involved in, analyzing and preparing the results reported herein. * P<0.05 CS only: Products that contain caloric sweeteners as the only type of sweetener; NNS only: Products that contain non-nutritive sweeteners as the only type of sweetener; CS + NNS: Products that contain both caloric and non-nutritive sweeteners No CS or NNS: Products that neither contain caloric sweeteners or non-nutritive sweeteners.
Figure 3:
Figure 3:. Estimated proportion of U.S. householdsa that purchased specific types of non-nutritive sweeteners (NNS) from packaged foods and beverages in a comparison of 2002 vs. 2018
a Sample sizes of households were 39,300 in 2002 and 61,101 in 2018. Authors’ calculations are based in part on data reported by Nielsen through its Homescan Services for all food categories, including beverages and alcohol for the years 2002 and 2018 from Nielsen Homescan Household Panel across the U.S. market, The Nielsen Company, 2019. The conclusions drawn from the Nielsen data are those of the authors and do not reflect the views of Nielsen. Nielsen is not responsible for and had no role in, and was not involved in, analyzing and preparing the results reported herein. * P<0.05
Figure 4:
Figure 4:. Estimated volume of food and beverage products containing specific types of non-nutritive sweeteners (NNS) purchased by U.S. householdsa in a comparison of 2002 vs. 2018
a Sample sizes of households were 39,300 in 2002 and 61,101 in 2018. Authors’ calculations are based in part on data reported by Nielsen through its Homescan Services for all food categories, including beverages and alcohol for the years 2002 and 2018 from Nielsen Homescan Household Panel across the U.S. market, The Nielsen Company, 2019. The conclusions drawn from the Nielsen data are those of the authors and do not reflect the views of Nielsen. Nielsen is not responsible for and had no role in, and was not involved in, analyzing and preparing the results reported herein. * P<0.05

References

    1. Popkin BM, Hawkes C. Sweetening of the global diet, particularly beverages: patterns, trends, and policy responses. Lancet Diabetes Endocrinol. 2016;4(2):174–186. - PMC - PubMed
    1. Ng SW, Slining MM, Popkin BM. Use of caloric and noncaloric sweeteners in US consumer packaged foods, 2005–2009. J Acad Nutr Diet. 2012;112(11):1828–1834 e1821–1826. - PMC - PubMed
    1. Popkin B, Nielsen S. The sweetening of the world’s diet. Obesity Research. 2003;11(11):1325–1332. - PubMed
    1. Sylvetsky AC, Welsh JA, Brown RJ, Vos MB. Low-calorie sweetener consumption is increasing in the United States. Am J Clin Nutr. 2012;96(3):640–646. - PMC - PubMed
    1. World Health Organization. Guideline: Sugar intake for adults and children In:WHO Department of Nutrition for Health and Development (NHD), ed. Geneva: WHO; 2015:50.

Publication types

Substances