. 2020 Dec:42:101057.
doi: 10.1016/j.molmet.2020.101057. Epub 2020 Jul 30.

Single-cell transcriptomics of human islet ontogeny defines the molecular basis of β-cell dedifferentiation in T2D

Affiliations

Single-cell transcriptomics of human islet ontogeny defines the molecular basis of β-cell dedifferentiation in T2D

Dana Avrahami et al. Mol Metab. 2020 Dec.

Abstract

Objective: Dedifferentiation of pancreatic β-cells may reduce islet function in type 2 diabetes (T2D). However, the prevalence, plasticity and functional consequences of this cellular state remain unknown.

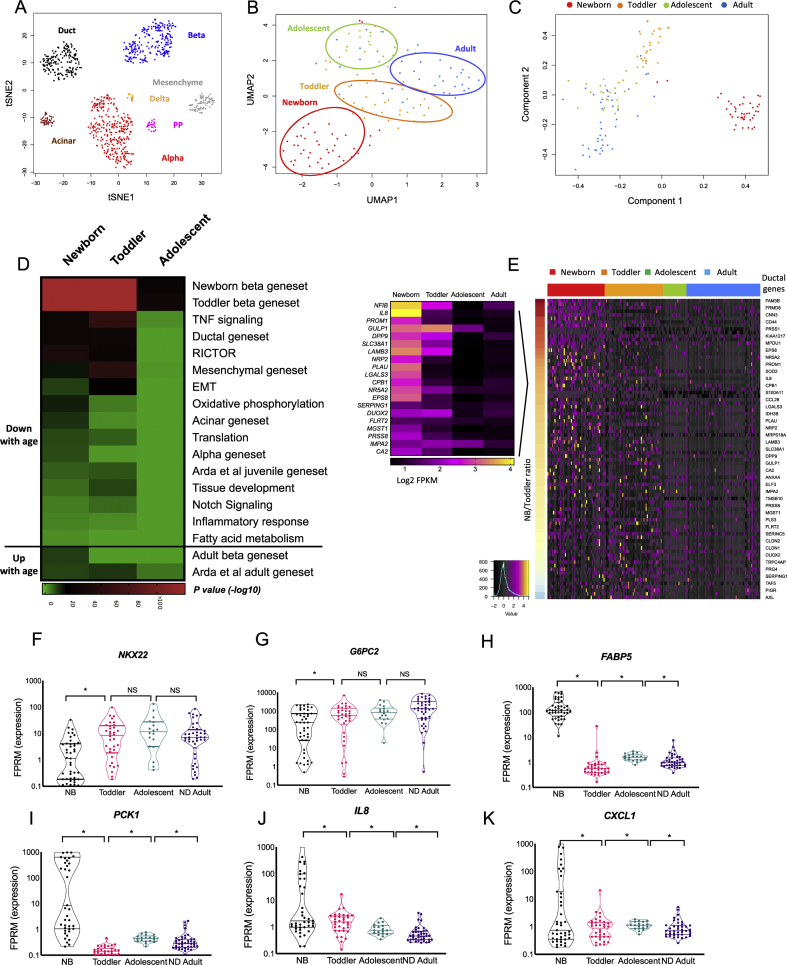
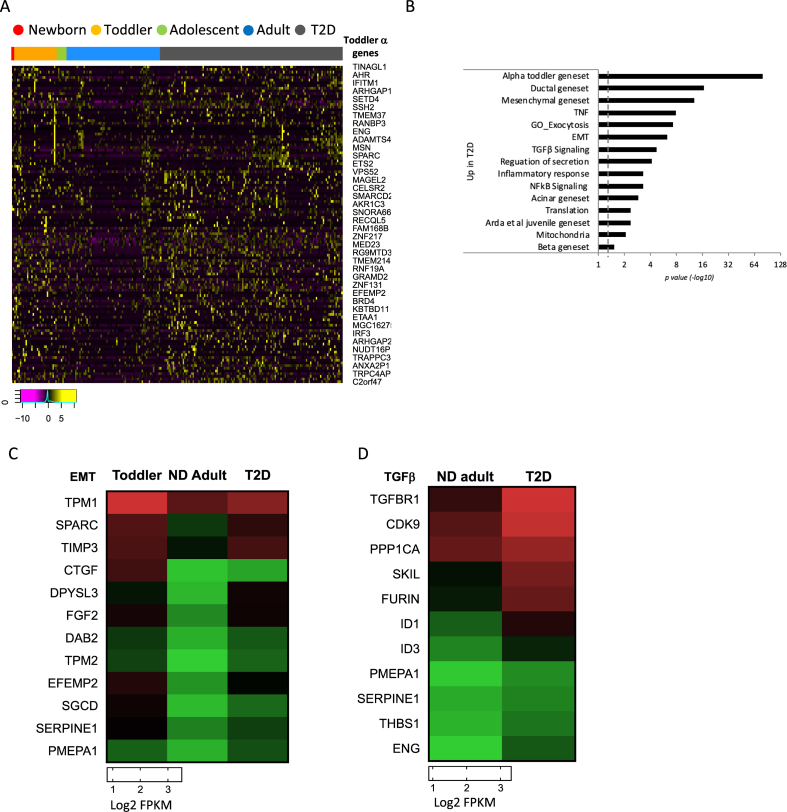
Methods: We employed single-cell RNAseq to detail the maturation program of α- and β-cells during human ontogeny. We also compared islets from non-diabetic and T2D individuals.

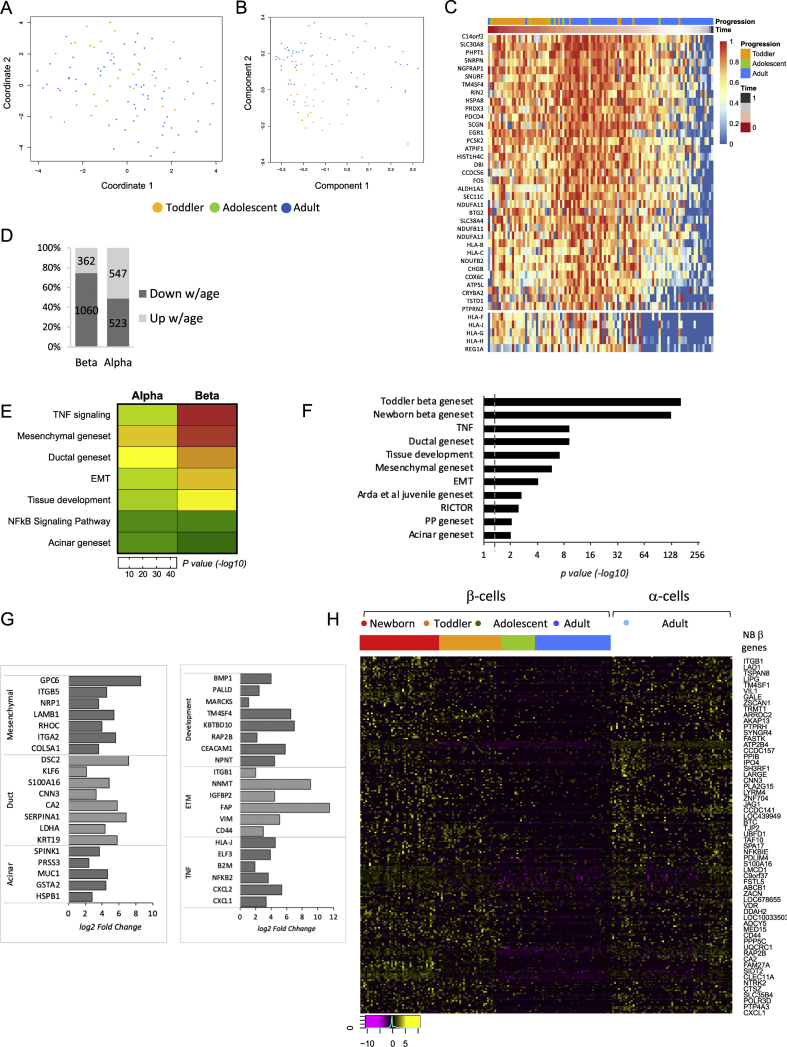
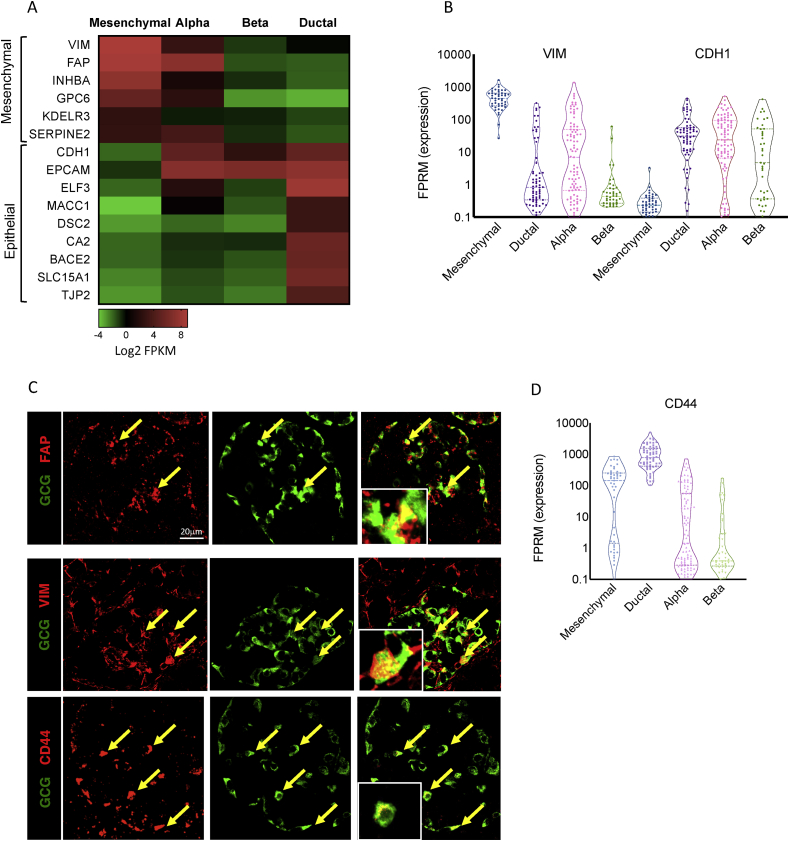
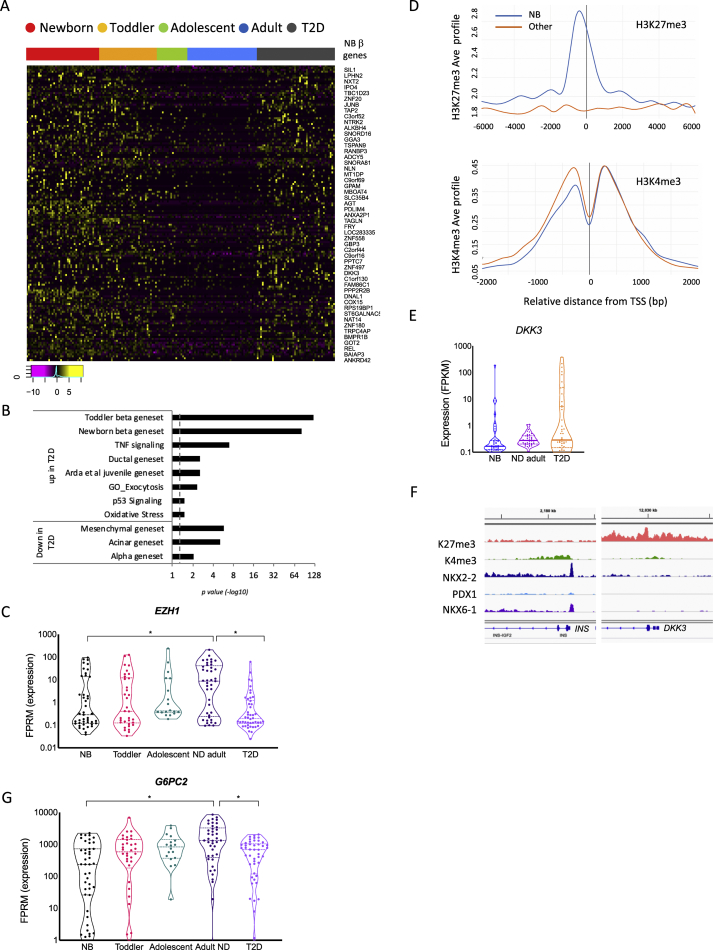
Results: Both α- and β-cells mature in part by repressing non-endocrine genes; however, α-cells retain hallmarks of an immature state, while β-cells attain a full β-cell specific gene expression program. In islets from T2D donors, both α- and β-cells have a less mature expression profile, de-repressing the juvenile genetic program and exocrine genes and increasing expression of exocytosis, inflammation and stress response signalling pathways. These changes are consistent with the increased proportion of β-cells displaying suboptimal function observed in T2D islets.

Conclusions: These findings provide new insights into the molecular program underlying islet cell maturation during human ontogeny and the loss of transcriptomic maturity that occurs in islets of type 2 diabetics.

Keywords: Human islet; Ontogeny; Single cell RNAseq; Type 2 diabetes; α-Cell; β-Cell.


Figures

Figure 1
Figure 1
Human β cells demonstrate age-dependent maturation. (A) Unsupervised clustering and visualisation of all annotated cells (n = 619 cells) using t-Distributed Stochastic Neighbour Embedding (tSNE) based on the expression values (log2 FPKM) of the top 20 genes with the largest range of expression values and including the major markers for each cell type. (B) Unsupervised clustering of β-cells from all non-diabetic donors and visualisation with UMAP using the top 22 principal components. (C) Pseudotime analysis using the SCORPIUS R package of all non-diabetic β-cells shows a temporal trajectory. (D) Heatmap displaying GSEA enrichment scores (p values) associated with β-cell maturation driven by the comparison between ND adults and each of the three younger age groups (newborn, toddler and adolescent), indicating biological pathways and gene sets typical of non-β-cell types which are being gradually silenced, while genes associated with mature β-cell function are being activated with age. p value <0.01 and an FDR <0.05 were considered as a significant enrichment. Green is low, black is intermediate and red is high enrichment. See Supplemental Table S5 for a complete list of genes. (E) Heatmap displaying relative expression levels of genes typical to the ductal gene set that show a gradual downregulation with age in single β-cells (SD of log2 FPKM). Genes (rows) are organised from high to low by the newborn/toddler relative expression ratio (colour bar on the left), cells (columns) are organised by age groups (newborn, toddler, adolescent and adult). Black is low, magenta is intermediate, and yellow is high expression. Only representative gene names are shown due to lack of space. For a complete list of genes, see Table S5. The relative expression levels of depicted genes by aggregation of all β-cells form each age group is displayed in the insert. (F–K) Violin plots of genes of interest with age-regulated gene expression in β-cells. Note the log10 scale. (∗) FDR <0.1 was considered significant for this analysis. NS, not significant. Lines represent median and quartiles.
Figure 2
Figure 2
Human postnatal α-cell maturation follows a different path than that of β-cells. (A) Unsupervised clustering of all α-cells from toddler, adolescent and adult age groups and visualisation by UMAP embedding using 33 principal components reveals that unlike β-cells, α-cells do not separate into clear age-dependent subpopulations. (B) Pseudotime analysis of all non-diabetic α cells using the SCORPIUS R package confirms lack of clear temporal pattern. (C) Heatmap of the genes driving the trajectory seen in (B), organised into modules. (D) Number of genes up- and downregulated with age in α- and β-cells comparing toddler to ND adult cells (FDR < 10%). (E) Heatmap displaying the difference in magnitude of gene silencing with age in α versus β cells based on enrichment scores (p values) of each gene category. Green is low and red is high enrichment. p value <0.05 and an FDR <0.05 were considered as a significant enrichment. (F) Gene set enrichment analysis indicating biological pathways and gene sets typical to exocrine cell types that are enriched in α-cells relative to β-cells of ND adults. p value <0.01 and an FDR <0.05 were considered as a significant enrichment. Dashed line indicates p value = 0.05. See Supplemental Table S7 for a complete list of genes. (G) Representative genes from gene categories in (F) that are significantly upregulated in adult α-cells compared with adult β-cells. FC >1.5 and FDR <0.05 were considered as a significant change. (H) Heatmap displaying relative expression levels of genes highly expressed in newborn β-cells in single β cells (Log2 FPKM) organised by age group (newborn, toddler, adolescent and adult) and single ND adult α-cells. Magenta is low, black is intermediate and yellow is high expression.
Figure 3
Figure 3
Adult α-cells present a mixed epithelial and mesenchymal expression prolife. (A) Heatmap displaying the expression levels (as median Log2 FPKM values) of mesenchymal and epithelial marker genes in aggregated mesenchymal, α-, β- and ductal cells. Green is low, black is intermediate and red is high expression levels. (B) Violin plot displaying the distribution of single cells expressing the mesenchymal marker VIM encoding vimentin and the epithelial marker CDH1 encoding E-cadherin in adult α- and β-single cells. Lines mark median and quartiles. (C) Immunostaining of human pancreatic sections obtained from non-diabetic donors for FAP, VIM, CD44 (red) and glucagon (green). Arrows point to α-cells exhibiting co-staining. Scale bars: 20 μm. (D) Violin plot displaying the expression of CD44 among single α- and β-cells from ND adults. Lines mark median and quintiles.
Figure 4
Figure 4
β-cells from T2D relax their mature transcriptional state through de-repression of immature and non-endocrine expression programs. (A) Heatmap of genes that are highly expressed in newborn β-cells, gradually being silenced toward adulthood, but are re-activated in T2D β-cells. Shown are relative expression levels (log2 FPKM) of single β-cells by age group and disease. Magenta is low, black is intermediate and yellow is high expression. Only representative gene names are shown due to lack of space. For a complete list of genes, see Table S8. (B) Gene set enrichment analysis demonstrating de-repression of juvenile and exocrine expression programs in β-cells of diabetic donors. p value <0.05 and an FDR <0.05 were considered as a significant enrichment. Dashed line indicates p value = 0.05. See Supplemental Table S8 for list of genes. (C) Violin plot demonstrating the downregulation of EZH1 in β cells of diabetics. (∗) FDR <0.1 and FC >1.5 was considered significant for this analysis. NS, not significant. Lines mark median and quartiles (D) Aggregation plots displaying the average ChIP signal of the active H3K4me3 and the repressive H3K27me3 histone modifications [21] at promoter regions of newborn genes that were found to be upregulated in T2D β-cells as compared with promoter regions of the remaining upregulated genes in T2D β-cells. (E) Violin plot demonstrating the activation of DKK3 in β-cells of diabetics. (F) Enrichment for the repressive histone mark H3K27me3 at the DDK3 promoter region in adult β-cells. (G) Violin plot demonstrating the downregulation of G6PC2 in β cells of diabetics. (∗) FDR <0.1 was considered significant for this analysis. NS, not significant.
Figure 5
Figure 5
α-Cells from T2D de-repress their immature expression program and increase their mesenchymal characteristics. (A) Heatmap of genes that are high in toddler α-cells are gradually silenced toward adulthood but are re-expressed in T2D α-cells. Shown are relative expression levels of single α-cells by age group and disease (log2 FPKM). Magenta is low, black is intermediate and yellow is high expression. Only representative gene names are shown due to lack of space. For a complete list of genes, see Table S9. (B) Gene set enrichment analysis demonstrating de-repression of juvenile and exocrine and mesenchymal expression programs in α-cells of diabetic donors. p value <0.05 and an FDR <0.05 were considered as a significant enrichment. Dashed line indicates p value = 0.05. See Supplemental Table S9 for list of genes. (C) Heatmap displaying the expression levels in α-cells (as median log2 FPKM values of aggregated single α-cells by age and disease state) of genes related to the EMT pathway that are downregulated with age and de-repressed in diabetics. (D) Heatmap displaying the activation of TGFβ signalling pathway in diabetic α-cells (median log2 FPKM values). In both maps, green is low, black is intermediate and red is high expression.

References

    1. Butler A.E., Janson J., Bonner-Weir S., Ritzel R., Rizza R.A., Butler P.C. Beta-cell deficit and increased beta-cell apoptosis in humans with type 2 diabetes. Diabetes. 2003;52(1):102–110. doi: 10.2337/diabetes.52.1.102. - DOI - PubMed
    1. Donath M.Y., Ehses J.A., Maedler K., Schumann D.M., Ellingsgaard H., Eppler E. Mechanisms of beta-cell death in type 2 diabetes. Diabetes. 2005;54(Suppl 2):S108–S113. - PubMed
    1. Back S.H., Kaufman R.J. Endoplasmic reticulum stress and type 2 diabetes. Annual Review of Biochemistry. 2012;81:767–793. doi: 10.1146/annurev-biochem-072909-095555. - DOI - PMC - PubMed
    1. Fonseca S.G., Gromada J., Urano F. Endoplasmic reticulum stress and pancreatic beta-cell death. Trends in Endocrinology and Metabolism. 2011;22(7):266–274. doi: 10.1016/j.tem.2011.02.008. - DOI - PMC - PubMed
    1. Kaneto H., Kajimoto Y., Fujitani Y., Matsuoka T., Sakamoto K., Matsuhisa M. Oxidative stress induces p21 expression in pancreatic islet cells: possible implication in beta-cell dysfunction. Diabetologia. 1999;42(9):1093–1097. doi: 10.1007/s001250051276. - DOI - PubMed

Publication types

MeSH terms