. 2020 Sep 4;432(19):5343-5364.
doi: 10.1016/j.jmb.2020.07.018. Epub 2020 Jul 31.

Mechanisms of PI(4,5)P2 Enrichment in HIV-1 Viral Membranes

Affiliations

Mechanisms of PI(4,5)P2 Enrichment in HIV-1 Viral Membranes

Yi Wen et al. J Mol Biol. .

Abstract

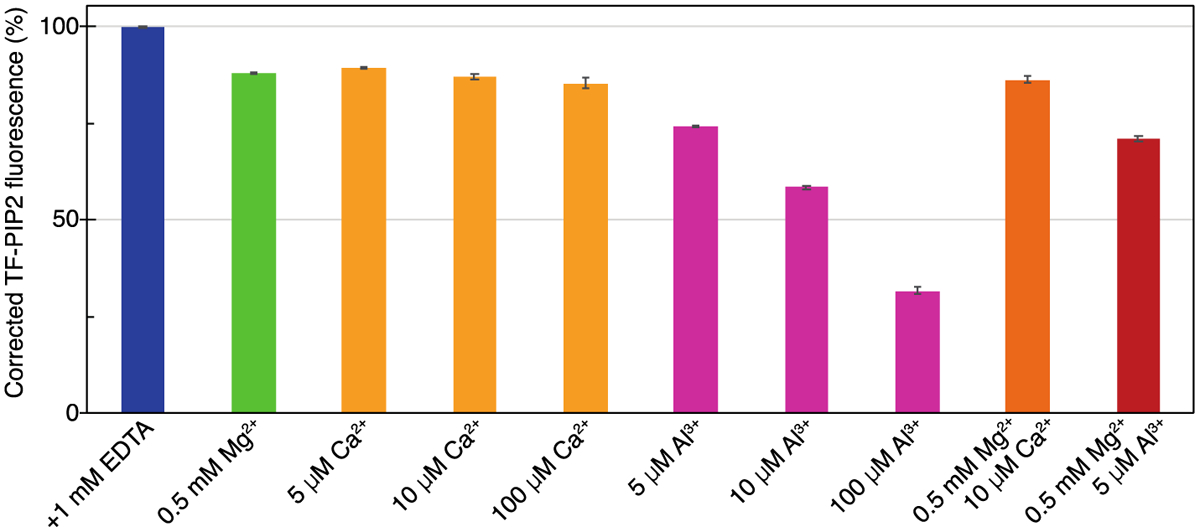
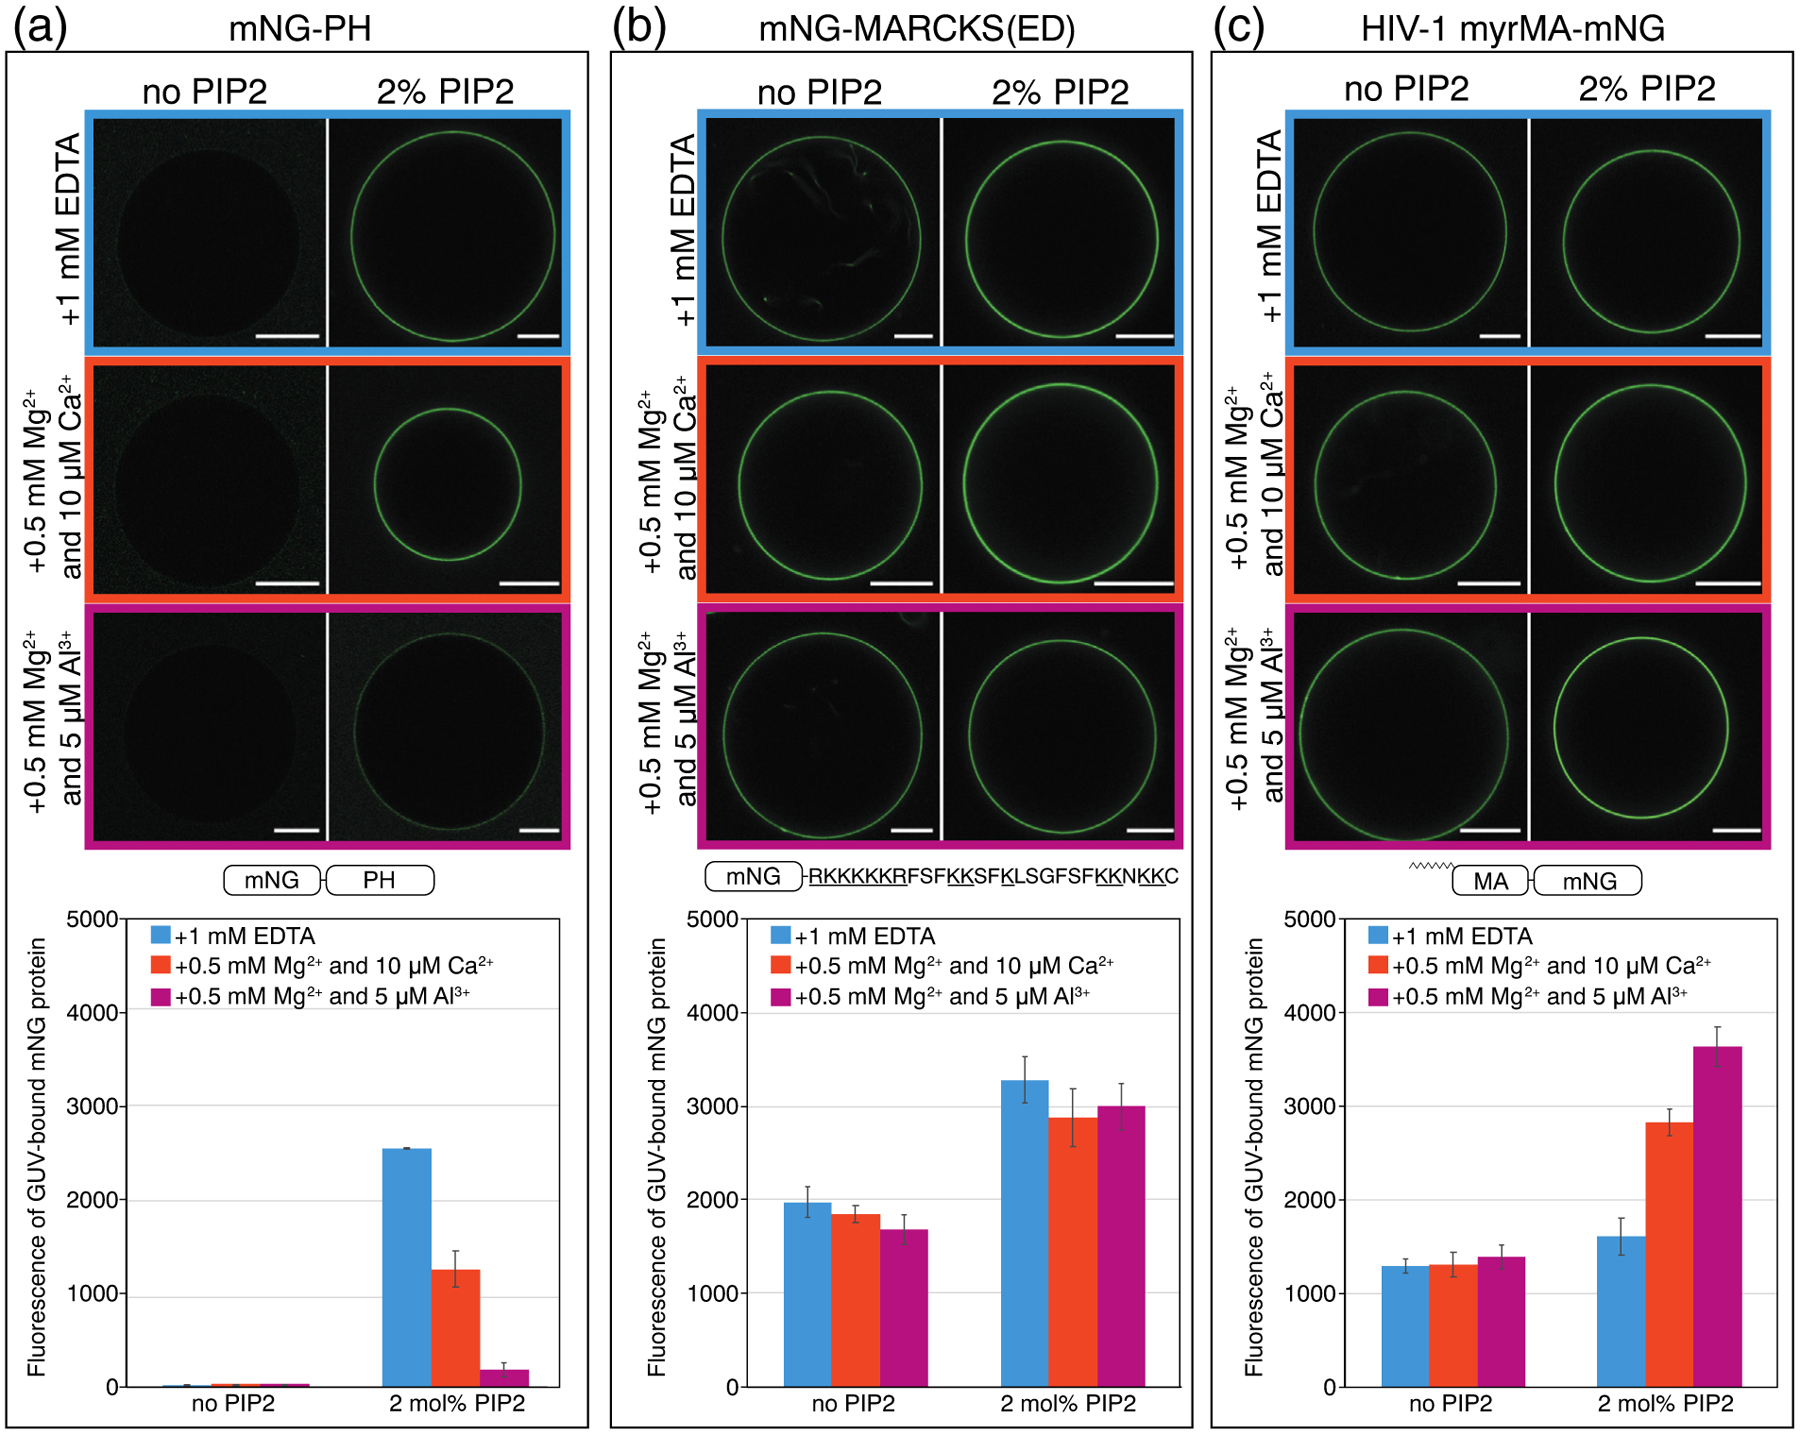
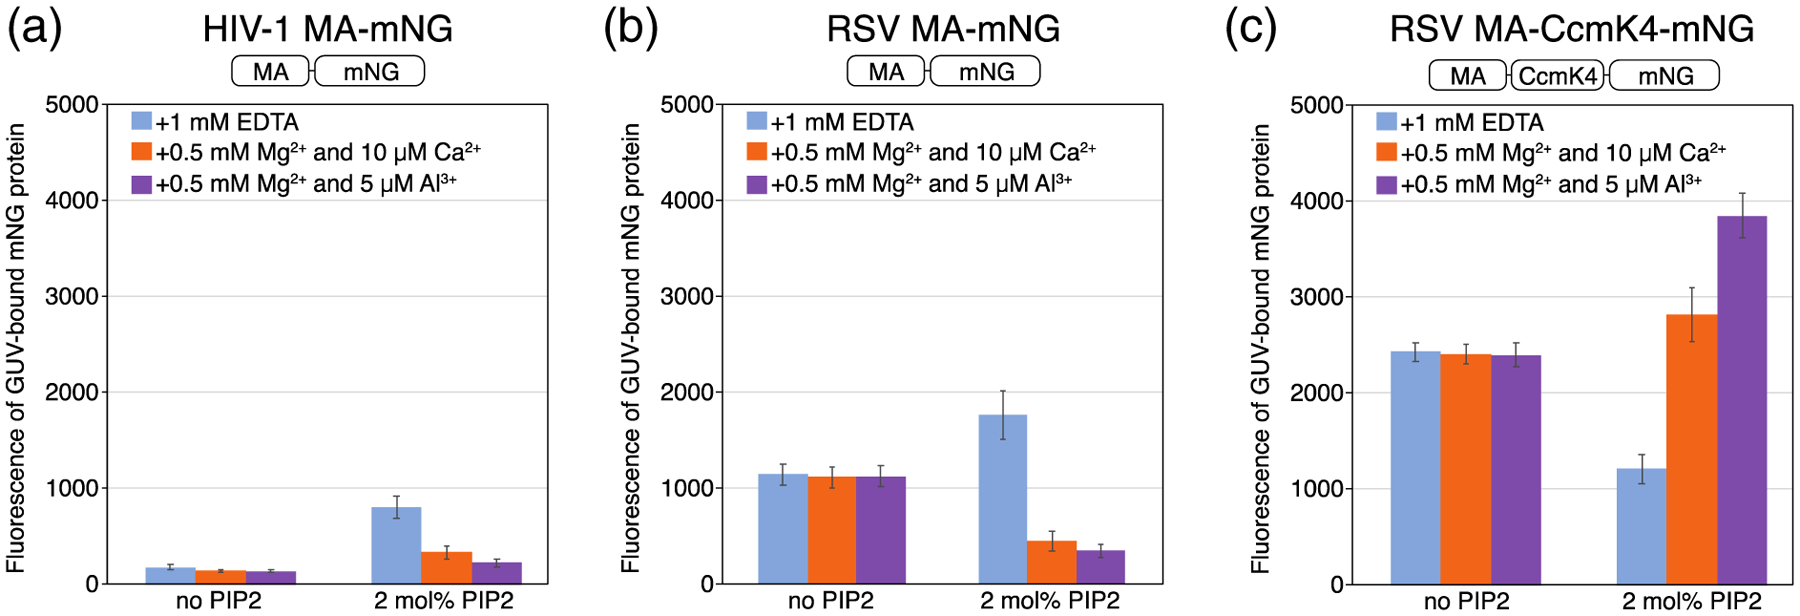
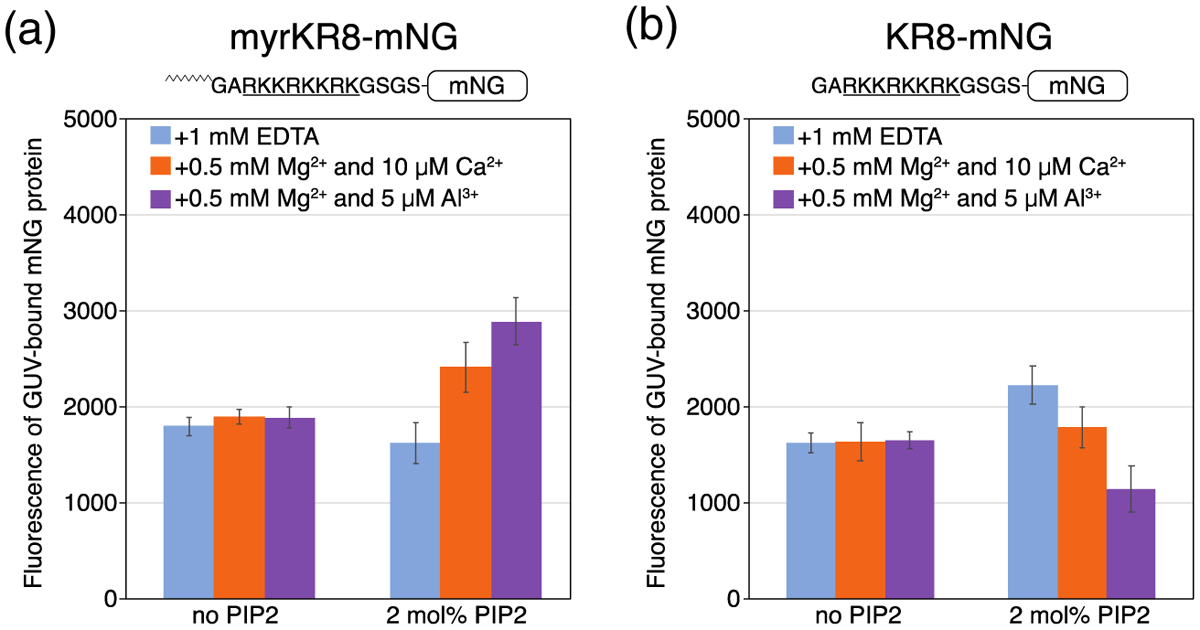
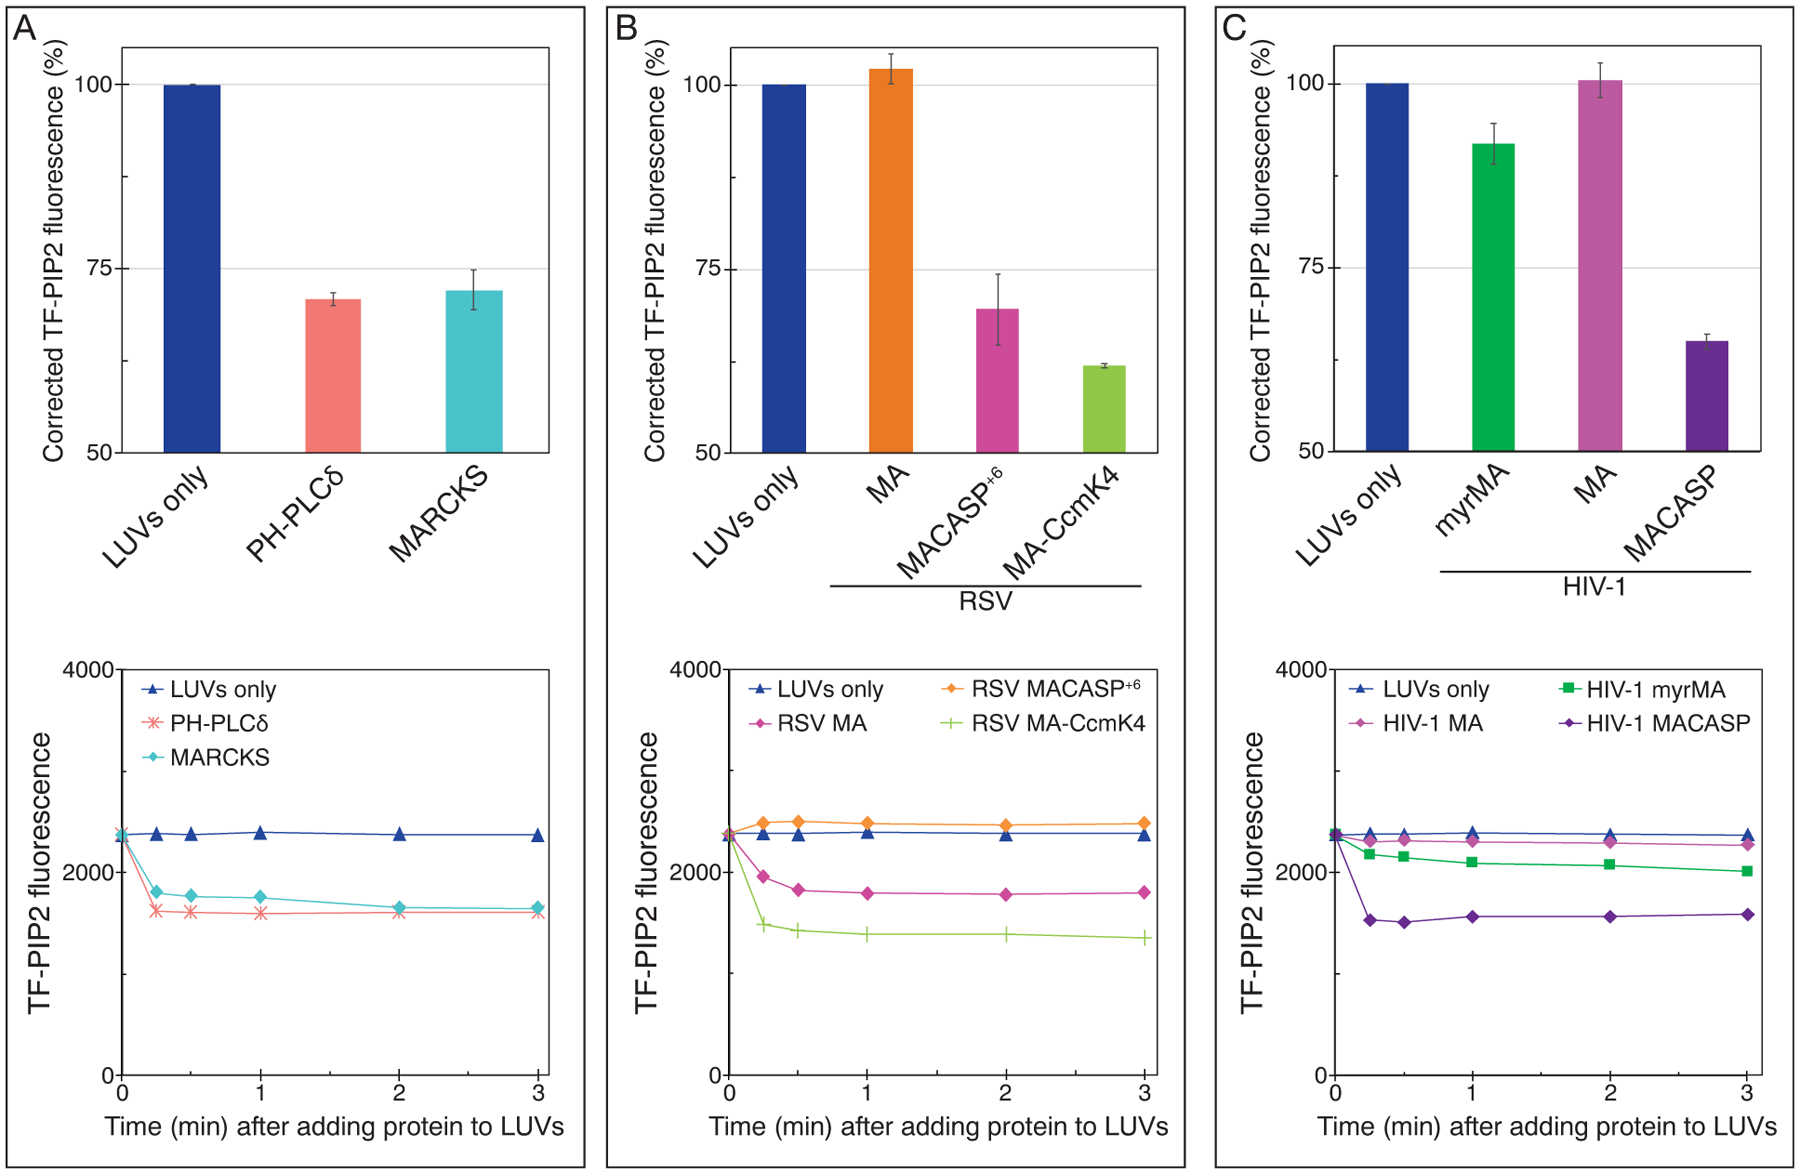
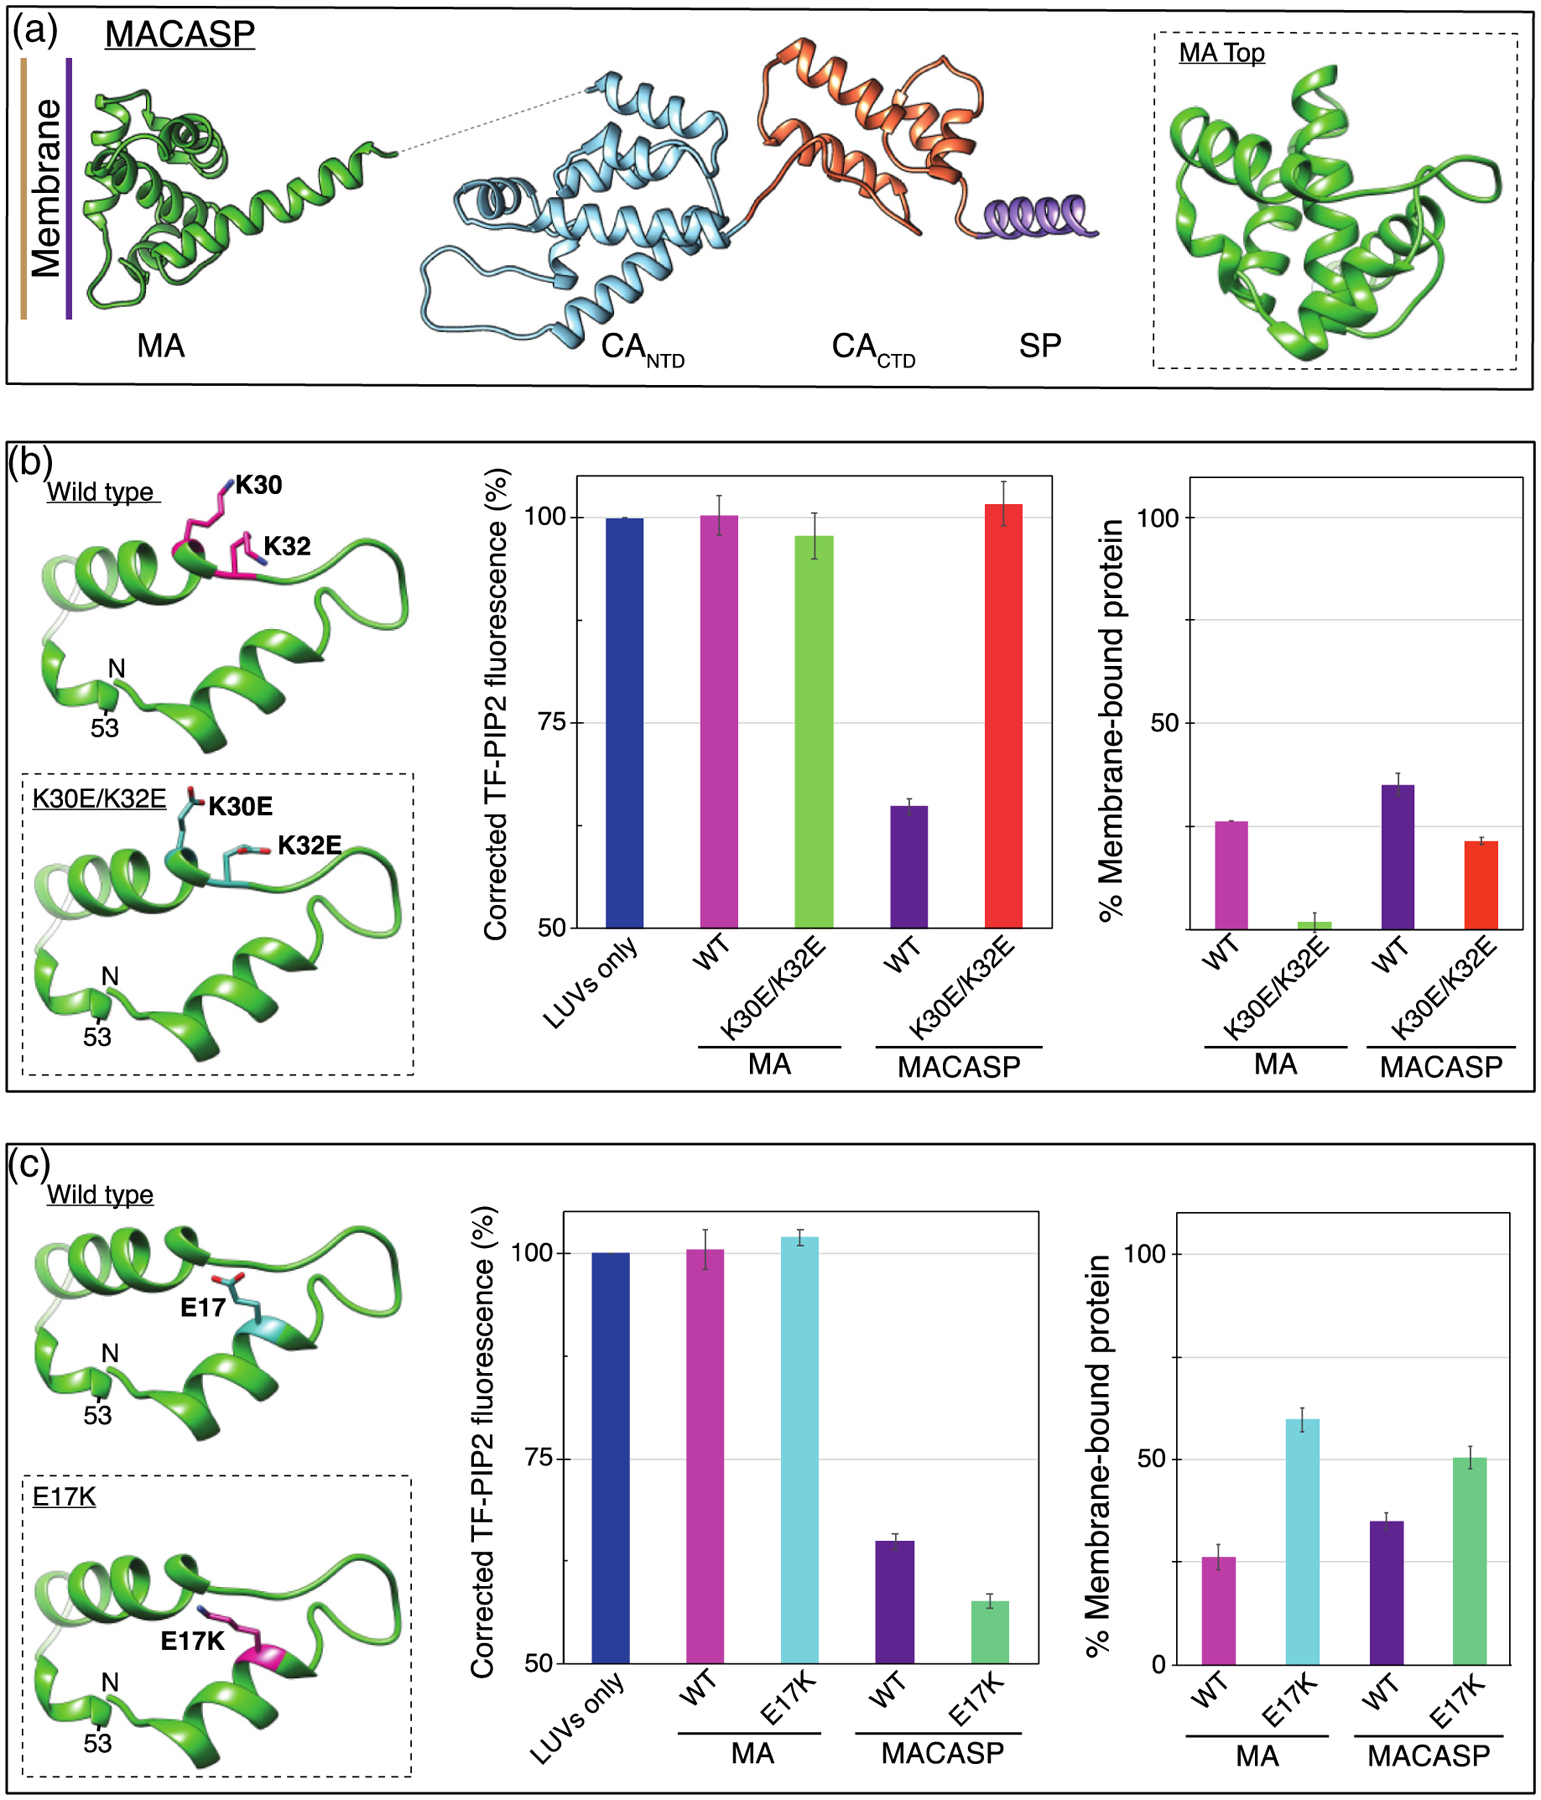
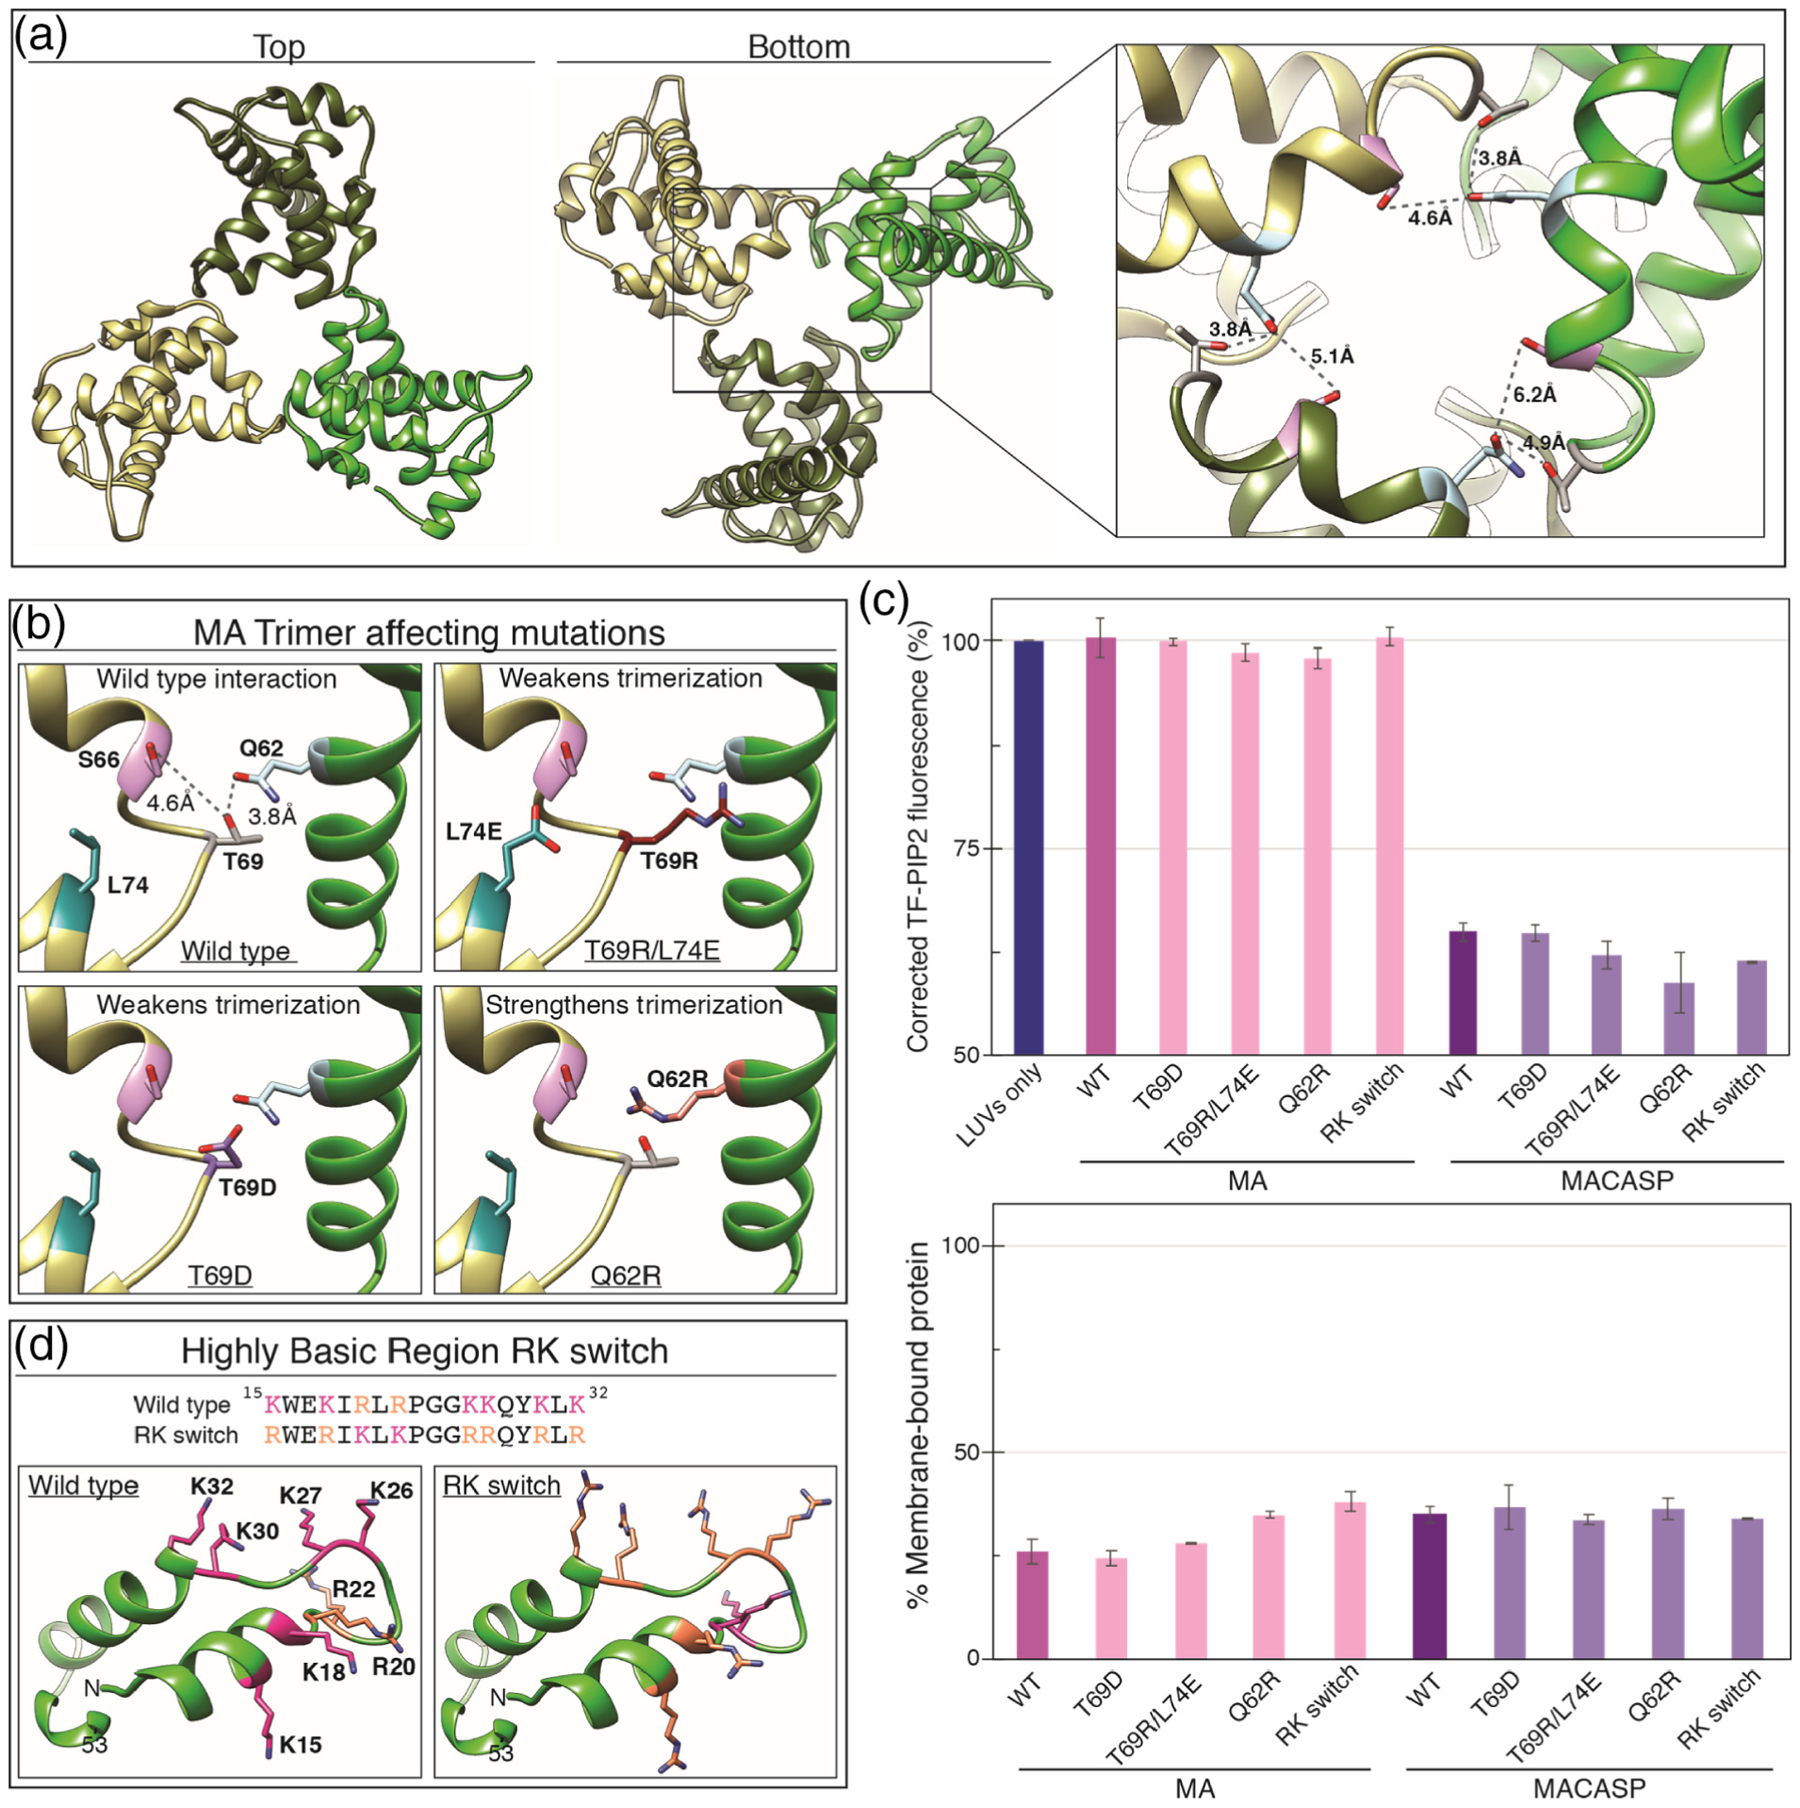
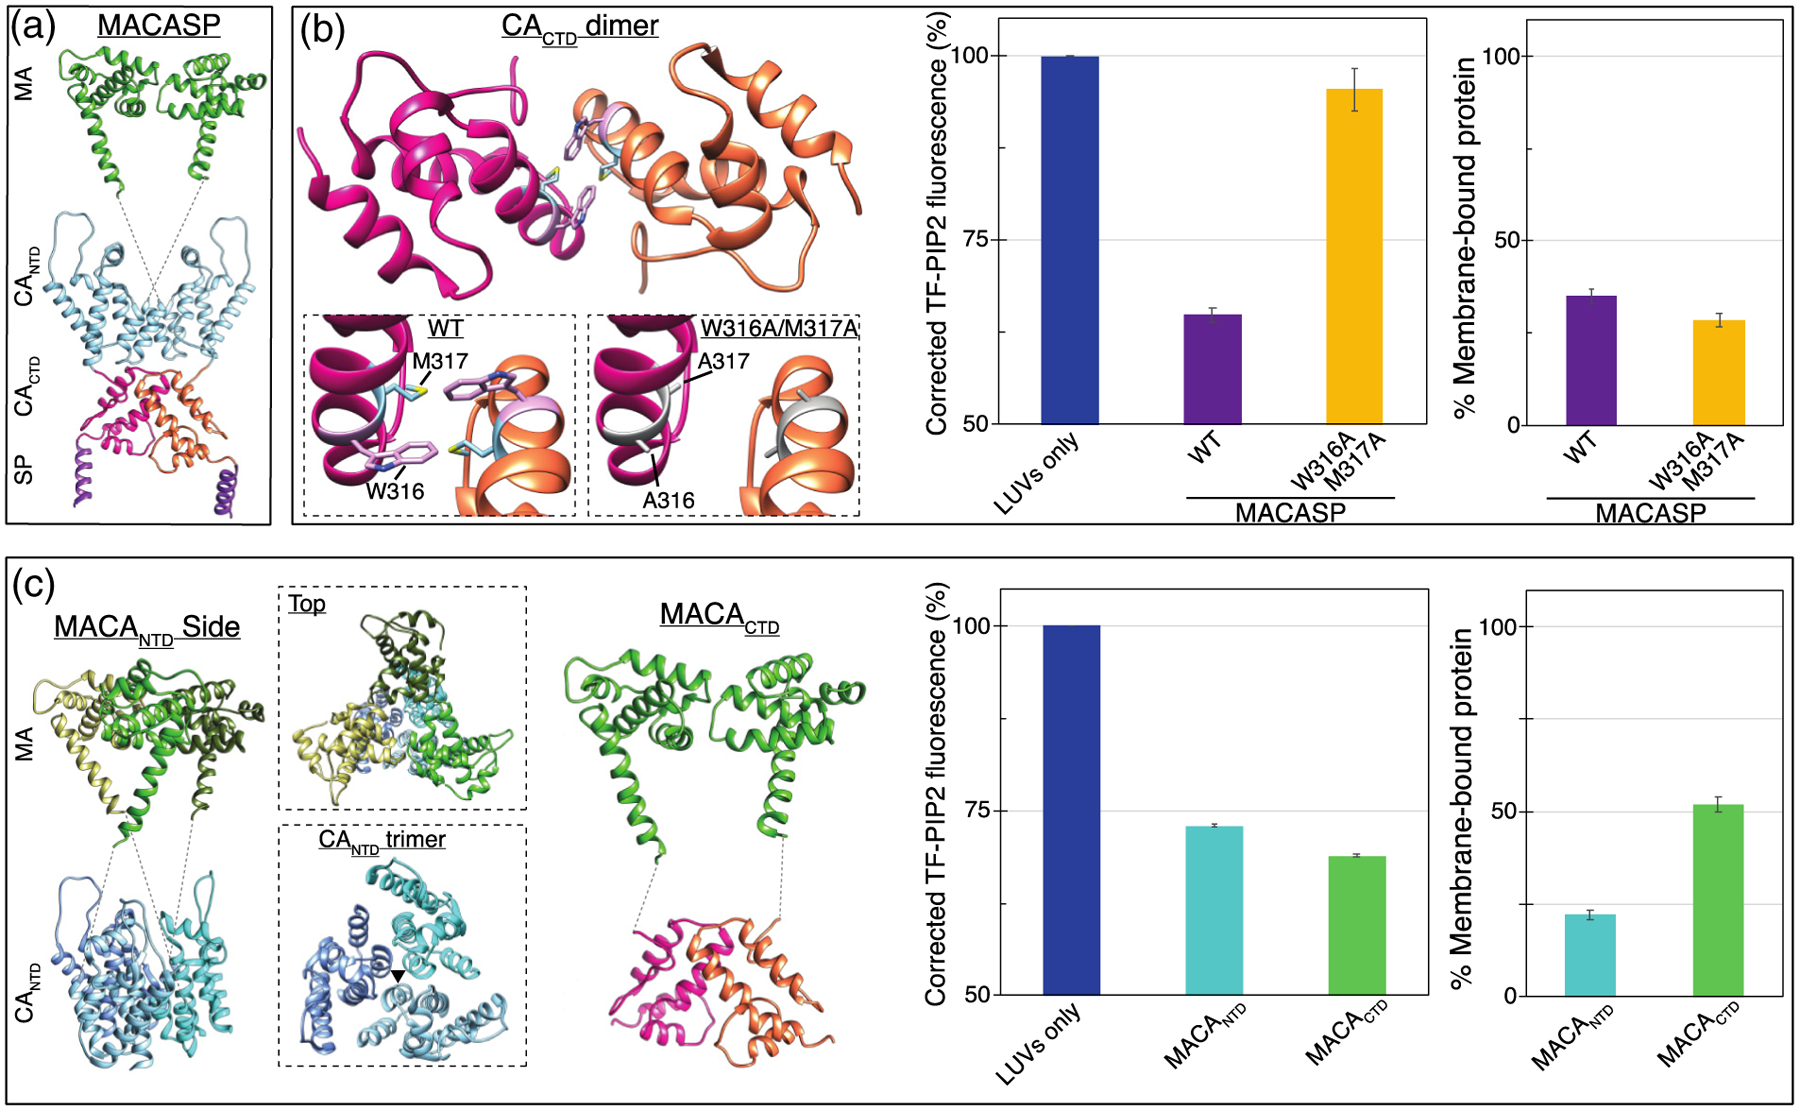
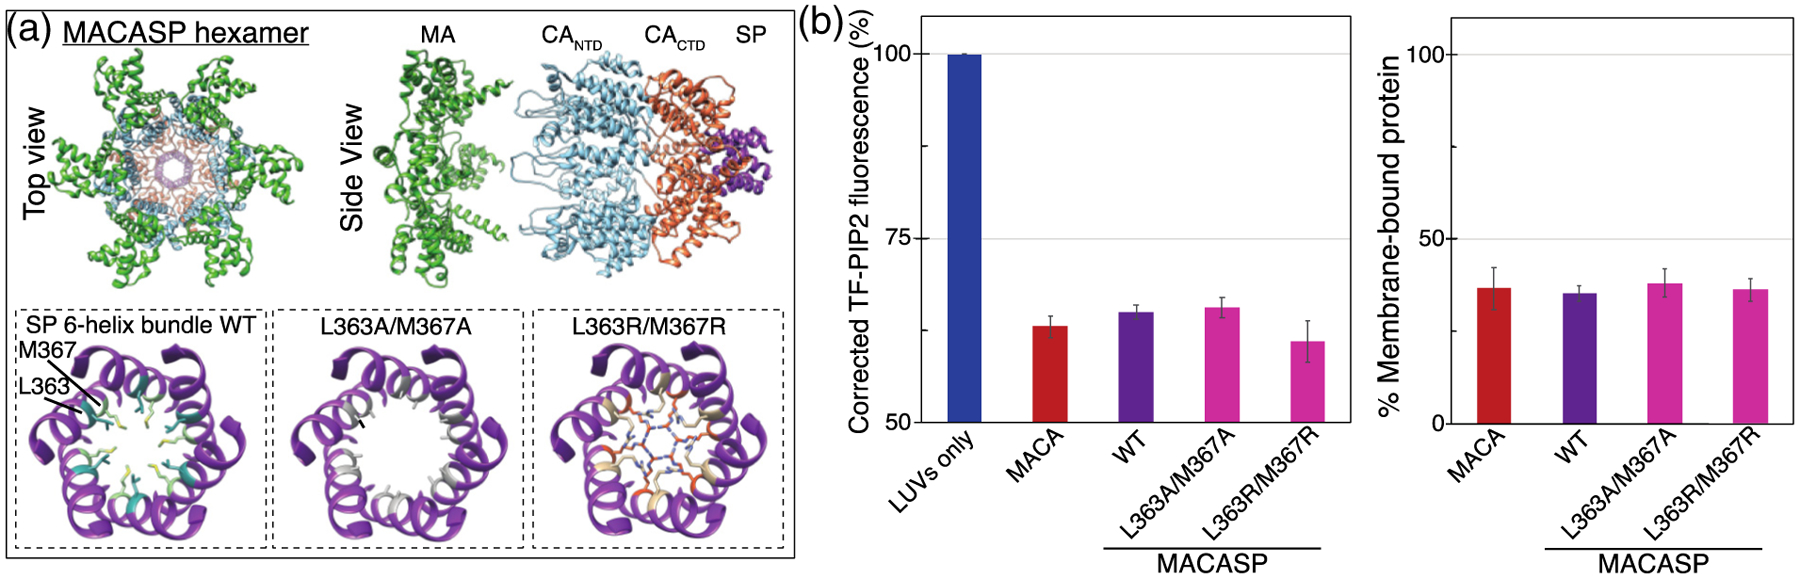
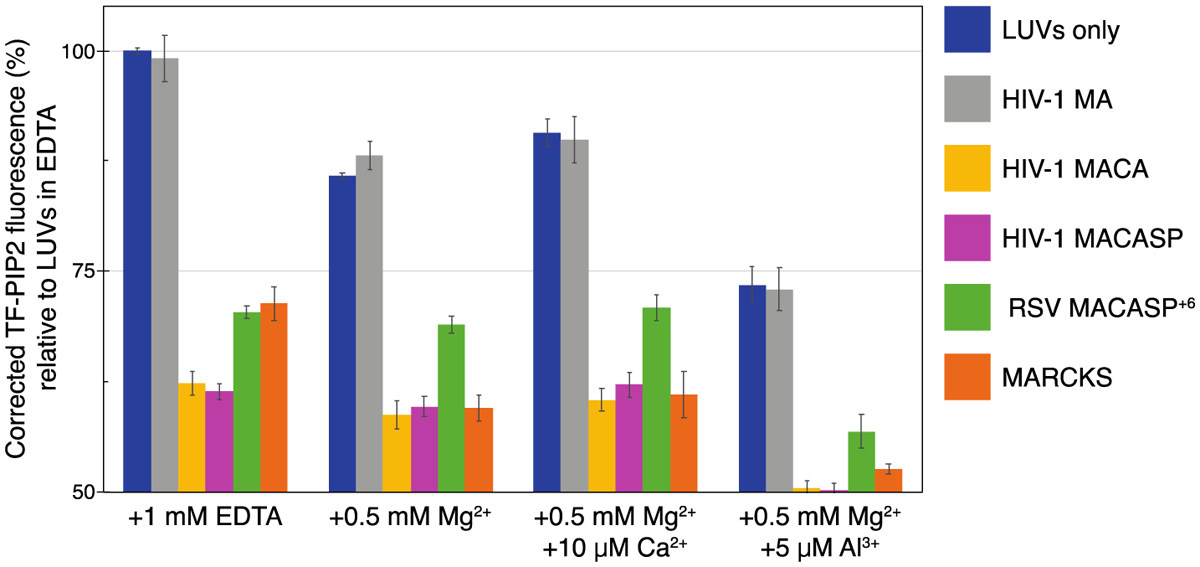
Phosphatidylinositol 4,5-bisphosphate (PIP2) is critical for HIV-1 virus assembly. The viral membrane is enriched in PIP2, suggesting that the virus assembles at PIP2-rich microdomains. We showed previously that in model membranes PIP2 can form nanoscopic clusters bridged by multivalent cations. Here, using purified proteins we quantitated the binding of HIV-1 Gag-related proteins to giant unilamellar vesicles containing either clustered or free PIP2. Myristoylated MA strongly preferred binding to clustered PIP2. By contrast, unmyristoylated HIV-1 MA, RSV MA, and a PH domain all preferred to interact with free PIP2. We also found that HIV-1 Gag multimerization promotes PIP2 clustering. Truncated Gag proteins comprising the MA, CA, and SP domains (MACASP) or the MA and CA domains (MACA) induced self-quenching of acyl chain-labeled fluorescent PIP2 in liposomes, implying clustering. However, HIV-1 MA itself did not induce PIP2 clustering. A CA inter-hexamer dimer interface mutation led to a loss of induced PIP2 clustering in MACA, indicating the importance of protein multimerization. Cryo-electron tomography of liposomes with bound MACA showed an amorphous protein layer on the membrane surface. Thus, it appears that while protein-protein interactions are required for PIP2 clustering, formation of a regular lattice is not. Protein-induced PIP2 clustering and multivalent cation-induced PIP2 clustering are additive. Taken together, these results provide the first evidence that HIV-1 Gag can selectively target pre-existing PIP2-enriched domains of the plasma membrane for viral assembly, and that Gag multimerization can further enrich PIP2 at assembly sites. These effects could explain the observed PIP2 enrichment in HIV-1.

Keywords: giant unilamellar vesicle; human immunodeficiency virus; large unilamellar vesicle; matrix protein; myristoylation.


Figures

Figure 1.
Figure 1.
Physiological levels of PIP2 form clusters bridged by multivalent cations in inner leaflet model membranes. LUVs were composed of POPE/POPS/Chol/PIP2 (32/30/36/2). The 2 mol% total PIP2 was a mixture of Brain-PIP2 and TF-PIP2 at a 7/3 ratio. LUVs were prepared in each buffer independently at a final concentration of 500 μM lipid. All buffers were based on 100 mM KCl, 20 mM HEPES (pH 7.2), with additional EDTA or multivalent cations as shown. All buffers were prepared with high-purity chemicals and stored in Teflon bottles. TF-PIP2 fluorescence of LUVs in EDTA was set to 100%, while TF-PIP2 fluorescence of LUVs in other buffer conditions was converted to a percentage relative to the maximum fluorescence in EDTA. Note that TF-PIP2 fluorescence quenching was from both inner and outer leaflets of LUVs, as both leaflets were exposed to buffers. Assays were performed at room temperature at least three times with error bars of standard deviations from the means. Slits of Ex/Em 485/515 were 2.5/2.5 nm in these and all similar experiments.
Figure 2.
Figure 2.
Myristoylated HIV-1 MA (myrMA) prefers binding to clustered PIP2, whereas the pleckstrin homology domain from phospholipase C (PH) favors binding to free PIP2. The myristoylated alanine-rich C kinase substrate effector domain (MARCKS(ED)) shows no preference. GUVs were prepared with no PIP2 [POPE/POPS/Chol (34/30/36)] or with 2 mol% PIP2 [POPE/POPS/Chol/brain-PIP2 (32/30/36/2)]. All GUVs were labeled with the membrane dye 18:1 DiI at a dye/lipid ratio of 1/2500. Both types of GUVs were harvested into one of three buffer conditions 5 h prior to protein binding. All three buffers were based on 100 mM KCl, 20 mM HEPES (pH 7.2), with either EDTA or multivalent cations. For GUVs incubated with 1 mM EDTA (top row), PIP2 is free; for GUVs incubated with 0.5 mM Mg2+ and 10 μM Ca2+ (middle row), PIP2 is modestly clustered; for GUVs incubated with 0.5 mM Mg2+ and 5 μM Al3+ (bottom row), PIP2 is strongly clustered. All proteins used in GUV assays were fused with mNG, with constructs shown in (a) mNG-PH, (b) mNG-MARCKS(ED), and(c) HIV-1 myrMA-mNG. Each mNG-labeled protein was added to the outside of GUVs at a final concentration of 1 μM. GUVs with protein bound were subject to confocal imaging under the same setting. Each GUV was examined at 488 nm for mNG fluorescence and at 561 nm for DiI fluorescence for locating GUVs. Fluorescence intensity above background (measured outside the GUV) at 488 nm (mNG) was analyzed by line scans in ImageJ across the perimeter of each GUV. The values were averaged and plotted with error bars representing the standard deviation. For each protein, a higher mNG fluorescence intensity indicates a higher membrane binding affinity. For GUVs with no PIP2, at least 15 GUVs were analyzed, and for GUVs with 2 mol% PIP2, at least 30 GUVs were analyzed, under each buffer condition. GUVs for each condition were prepared at least three times independently.
Figure 3.
Figure 3.
Sensitivity of non-myristoylated and multimerized protein to PIP2 clustering. Quantification of mNG-labeled protein bound to GUVs was carried out as described in Figure 3. (a) Non-myristoylated HIV-1 MA-mNG binding in the absence and presence of 2% PIP2 without (EDTA) or with multivalent cations. (b) Naturally non-myristoylated RSV MA-mNG binding as in (a). (c) Synthetically hexamerized RSV MA-CcmK4-mNG protein binding as in (a).
Figure 4.
Figure 4.
Myristoylation confers binding preference to clustered PIP2. Quantification of protein binding to GUVs with the same composition and buffer conditions was carried out as detailed in Figure 3. (a) Myristoylated KR8-mNG protein and (b) non-myristoylated KR8-mNG protein. The myristoylation signal at the N-terminus for the protein (amino acids GAR) is the same as in HIV MA.
Figure 5.
Figure 5.
HIV-1 and RSV Gag-derivative proteins can induce PIP2 clustering, as measured by fluorescence quenching. LUVs with 2% PIP2 were prepared as in Figure 2 using 1 mM EDTA to eliminate all multivalent cation binding. Protein at a final concentration of 20 μM was added after LUV formation, and thus the inner leaflet of the liposomes was not exposed to protein. Top panels: TF-PIP2 fluorescence quenching by (a) control proteins, (b) RSV membrane binding proteins, and (c) HIV-1 membrane binding proteins. TF-PIP2 fluorescence of LUVs mixed with buffer was set to 100%, and the effect of added protein was recorded. Note that for protein-induced PIP2 clustering, the Y-axis is shown only from 50% to 100%, since TF-PIP2 fluorescence quenching occurred only from the outer leaflet where lipids were exposed to the proteins. Each bar in the graph represents the average TF-PIP2 fluorescence % from three time points 1, 2, and 3 min post-mixing. Each quenching assay was performed at least three times with error bars of standard deviations from the means. (a–c, bottom panels) Time course of quenching. For each assay, TF-PIP2 fluorescence was measured at 0.25, 0.5, 1, 2, and 3 min post-mixing.
Figure 6.
Figure 6.
PIP2 clustering is dependent on known HIV MA PIP2-interacting amino acids. (a) Model of HIV-1 MACASP structure from PDB 1HIW (MA) [90] and 5L93 (CASP) [62]. Dotted line represents unstructured amino acids ~121–147. Inset is a top-down view of the membrane binding surface of MA. (b, left) MA membrane binding region, amino acids 7–53. PIP2-interacting amino acid K30 and K32 side-chains are shown in pink. Inset shows mutations K30E and K32E. (b, center) TF-PIP2 fluorescence in the absence and presence of wild-type (WT) or mutant HIV-1 MA or HIV-1 MACASP protein. (b, right) Membrane binding of each protein was determined by the pelleting assay. After incubating mixtures of 160μl LUVs and 40 μl proteins for 10 min, the protein-LUV mixture was ultracentrifuged at 75K for 15min at 4 °C. The supernatant was discarded and the pellet resuspended and subjected to SDS-PAGE and densitometry analyses. Each pelleting assay was performed at least three times with error bars of standard deviations from the means. (c, left) Amino acid E17 is shown in pink. Inset shows the membrane binding enhancement mutant E17K. (c, center) TF-PIP2 fluorescence in the absence and presence of WT or mutant HIV-1 MA or HIV-1 MACASP protein. (c, right) Membrane binding as described above.
Figure 7.
Figure 7.
PIP2 clustering is not affected by mutations that weaken MA trimerization or alter charged residue type. (a) HIV-1 MA trimer (PDB 1HIW [90]) top and bottom views. Inset shows side-chains of known trimer interacting residues Q62 (blue), S66 (pink), T69 (grey) and Q62 (blue). (b) Mutations in MA that weaken or strengthen trimerization. (c) (Top) Effect of MA trimer mutations and RK switch mutant on PIP2 quenching in the context of MA and MACASP proteins. (Bottom) Percent of total protein associated with membranes. (d) Highly basic surface of the HIV-1 membrane binding domain. All basic amino acid side-chains are shown as pink (K) or orange (R). In the RK switch mutant, each K residue has been mutated to R and each R residue has been mutated to K.
Figure 8.
Figure 8.
PIP2 clustering is dependent on ability of MA to multimerize via NTD and/or CTD interactions. (a) Model of MACASP dimer mediated by CACTD-CACTD interaction. (b, left) CACTD dimer interface with amino acids W316 in pink and M317 in blue. Left inset is an enlargement of the dimer interface. Right inset shows W316A and M317A mutations which weaken the interface. (b, center) Effect of W316A/M317A mutations on PIP2 quenching by MACASP (b, right) and on membrane association of the protein. (c, left) Model of possible MACANTD trimer. Top inset shows a top down view of the MA trimer positioned above the CANTD trimer. Bottom inset shows the CANTD trimer, with the black triangle indicating the interface between monomers at helix two. The artificial MACACTD dimer. (c, center) Effect of MACANTD and MACACTD on PIP2 quenching (c, right) and membrane binding.
Figure 9.
Figure 9.
SP is not required for PIP2 cluster formation. (a) Top and side views of a model of the MACASP hexamer. Bottom left shows the structure of the 6HB (amino acids 355–371). Note that the 6HB includes the last nine residues of CACTD (355–363) and the first eight residues of SP (364–371). Side-chains of residues L363 (sea green) and M367 (light green) are shown. When mutated, these residues lead to a significant decrease in correct immature protein lattice assembly [59]. Bottom center shows the L363A/M367A mutation. Bottom right shows the L363R/M367R mutation. (b) Effect of MACA and MACASP without and with SP mutations on PIP2 quenching (left) and membrane binding (right).
Figure 10.
Figure 10.
Proteins further promote PIP2 clustering of pre-existing multivalent cation-bridged PIP2. All LUVs were prepared in four different buffers that are based on 100 mM KCl, 20 mM HEPES, (pH 7.2), with additional EDTA or multivalent cations. PIP2 is free with 1 mM EDTA; PIP2 is modestly clustered with 0.5 mM Mg2+ or with 0.5 mM Mg2+ and 10 μM Ca2+, and PIP2 is strongly clustered with 0.5 mM Mg2+ and 5 μM Al3+. Note that lipids on both leaflets of the LUVs are exposed to the same buffer condition. Prior to protein addition, each protein/peptide was subjected to buffer exchange to match each buffer condition of LUVs. A total of 40 μl protein in each buffer was added to the outside of 160 μl LUVs in each buffer condition. TF-PIP2 fluorescence of LUVs mixed with buffer containing EDTA was maximum, set to 100%, while TF-PIP2 fluorescence of LUVs prepared with multivalent cations and/or mixed with protein or peptide was converted to the corresponding percentage. Note that for protein-induced PIP2 clustering, Y-axis is only shown from 50% to 100%. Each bar in the graph represents the average TF-PIP2 fluorescence % over the 1, 2, and 3 min time points post-mixing. Each quenching assay was performed at least three times; error bars show standard deviations from the means.

Similar articles

Cited by

References

    1. Dick RA, Zadrozny KK, Xu C, Schur FKM, Lyddon TD, Ricana CL, Wagner JM, Perilla JR, et al., (2018). Inositol phosphates are assembly co-factors for HIV-1. Nature, 10.1038/s41586-018-0396-4. - DOI - PMC - PubMed
    1. Dick RA, Mallery DL, Vogt VM, James LC, (2018). IP6 regulation of HIV capsid assembly, stability, and uncoating. Viruses, 10, 640, 10.3390/v10110640. - DOI - PMC - PubMed
    1. Mallery DL, Rifat Faysal KM, Kleinpeter A, Freed EO, Saiardi A, James LC, Wilson MSC, Vaysburd M, et al., (2019). Cellular IP 6 levels limit HIV production while viruses that cannot efficiently package IP 6 are attenuated for infection and replication correspondence article cellular IP 6 levels limit HIV production while viruses that cannot efficiently package IP 6 are attenuated for infection and replication. Cell Rep., 29, 3983–3996, 10.1016/j.celrep.2019.11.050. - DOI - PMC - PubMed
    1. Sundquist WI, Kräusslich HG, (2012). HIV-1 assembly, budding, and maturation. Cold Spring Harb. Perspect. Med, 2, 1–25, 10.1101/cshperspect.a006924. - DOI - PMC - PubMed
    1. Briggs JAG, Riches JD, Glass B, Bartonova V, Zanetti G, Kräusslich HG, (2009). Structure and assembly of immature HIV. Proc. Natl. Acad. Sci, 10.1073/pnas.0903535106. - DOI - PMC - PubMed

Publication types

MeSH terms

Substances