. 2020 Dec;115(12):1989-1997.
doi: 10.14309/ajg.0000000000000748.

Gastric Cancer Among American Indian and Alaska Native Populations in the United States, 2005-2016

Affiliations

Gastric Cancer Among American Indian and Alaska Native Populations in the United States, 2005-2016

Stephanie C Melkonian et al. Am J Gastroenterol. 2020 Dec.

Abstract

Introduction: American Indian and Alaska Native (AI/AN) populations have higher gastric cancer rates than the general US population. This study provides a comprehensive overview of incidence rates among AI/AN persons during 2005-2016 compared with non-Hispanic whites (whites).

Methods: Population-based cancer registry data for 2005-2016 were linked with the Indian Health Service patient registration databases to address racial misclassification. Age-adjusted gastric cancer incidence rates were expressed per 100,000 per year. Incidence and trend analyses were restricted to purchased/referred care delivery area counties in 6 geographic regions, comparing gastric cancer incidence rates for AI/AN vs white populations in the United States.

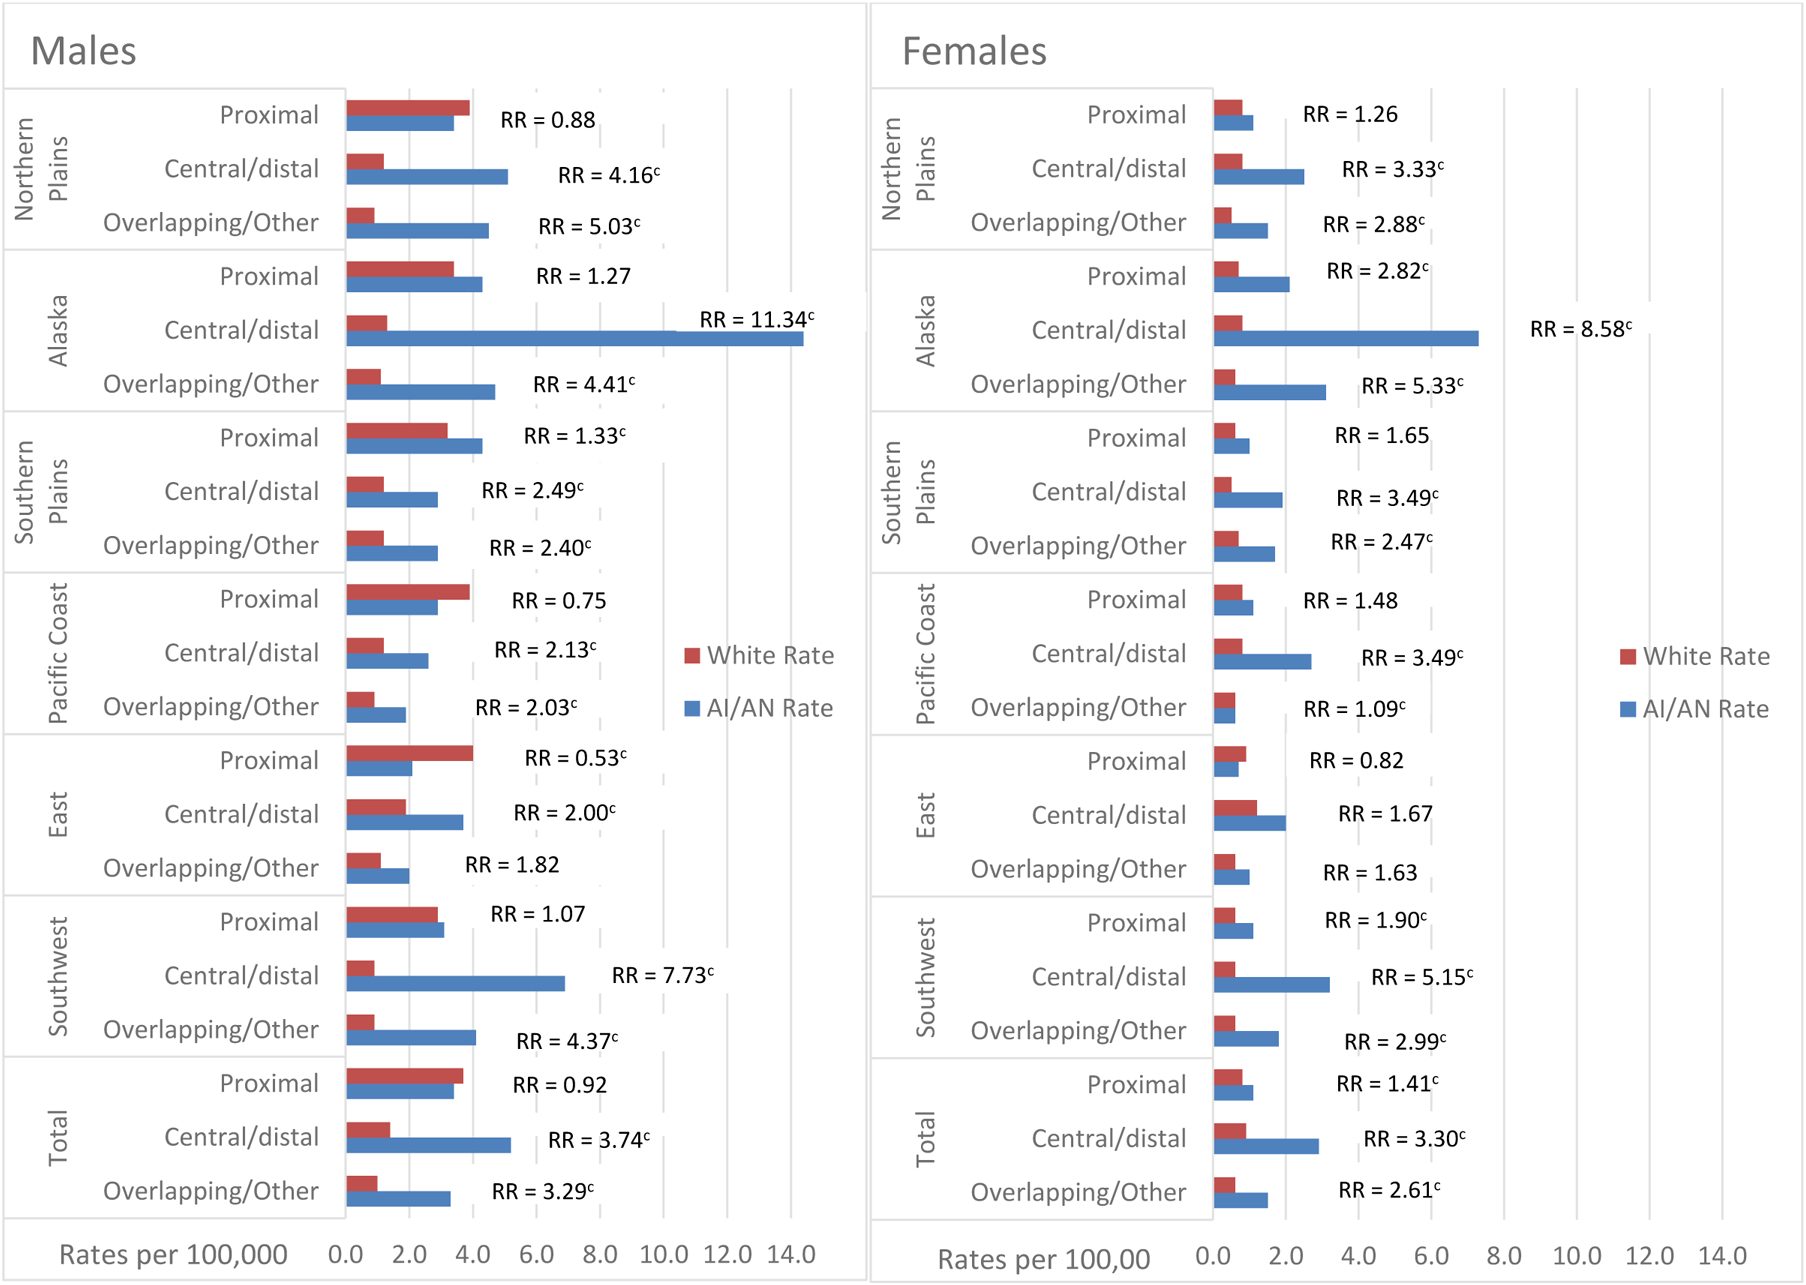
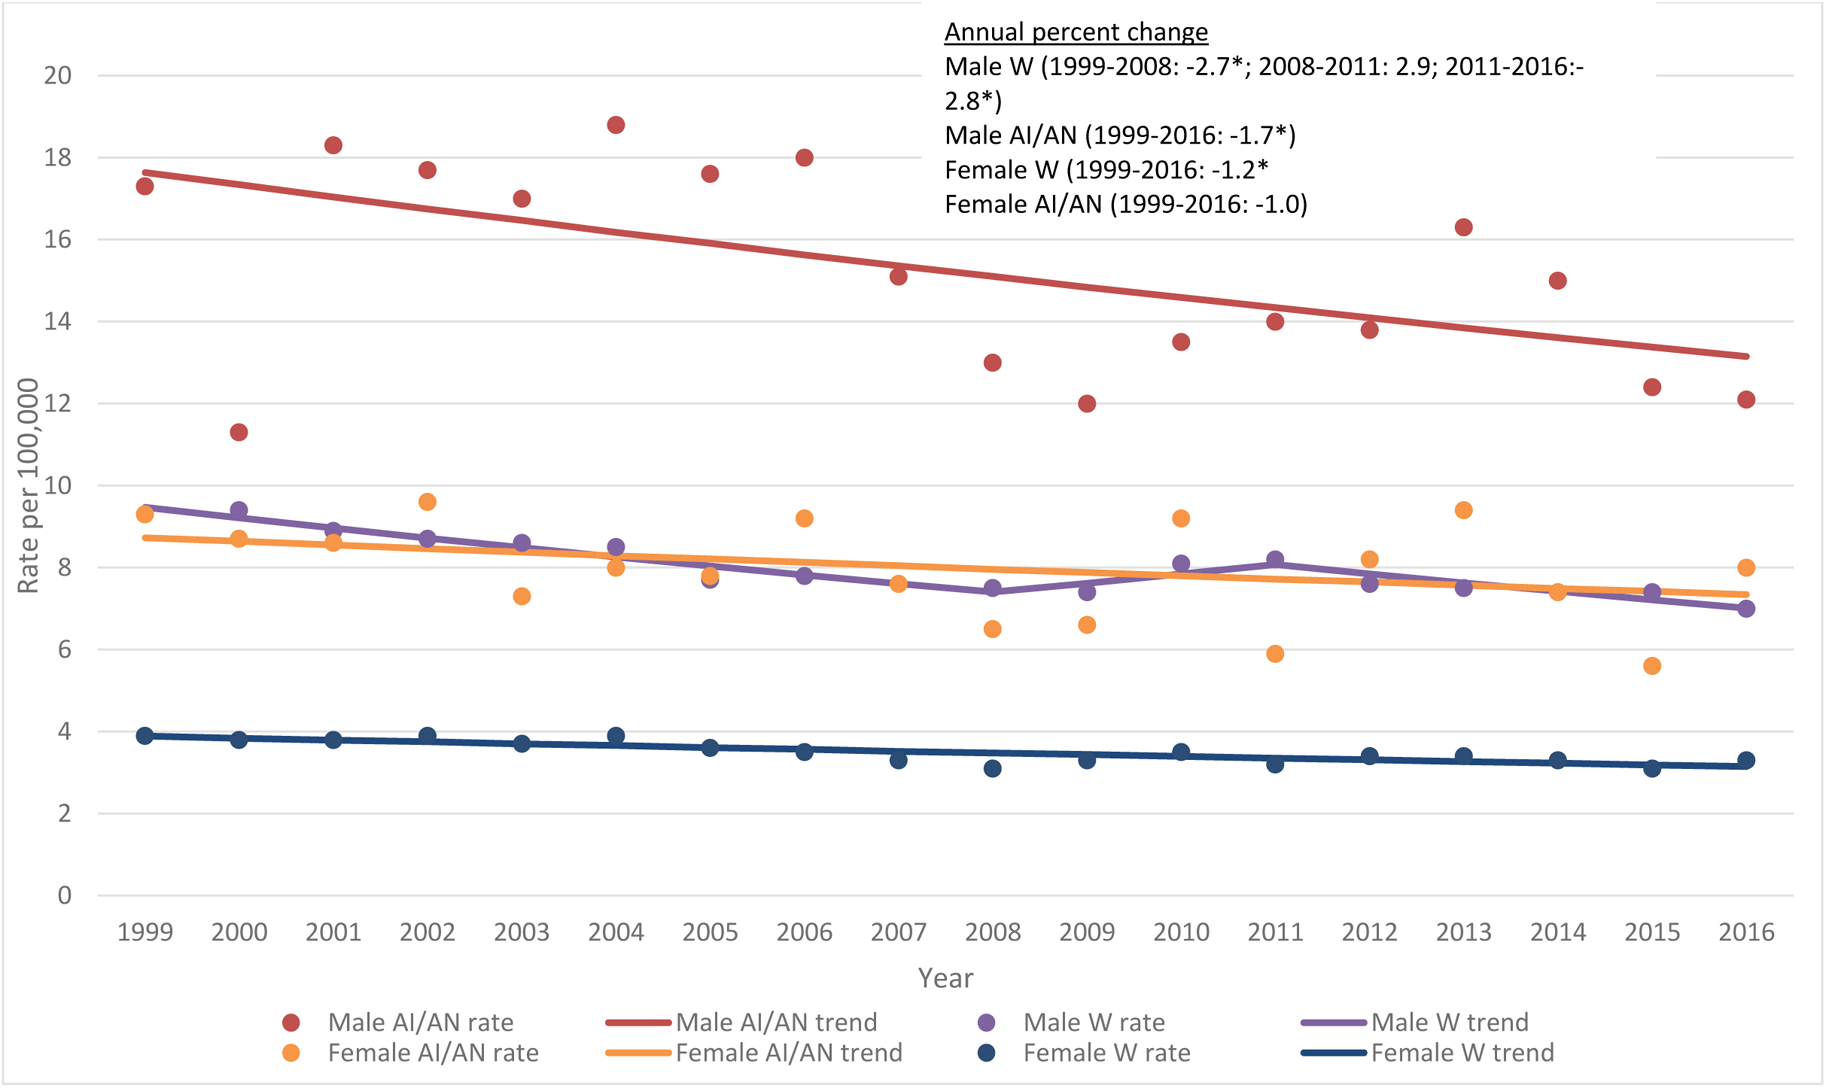
Results: Gastric cancer rates were higher in the AI/AN compared with white populations in nearly every US region. Incidence rates for central/distal portions of the stomach were higher in AI/AN individuals compared with whites. Rates of later stage gastric cancer were higher in AI/AN populations overall and in every region except the Pacific Coast and East. Incidence rates decreased significantly over time in both populations. Declining rates in the AI/AN populations were driven by changes in the Pacific Coast and Northern Plains regions.

Discussion: AI/AN populations have a disproportionately high incidence of gastric cancer, especially in Alaska. High incidence in the central/distal portions of the stomach among AI/AN populations likely reflects a high prevalence of Helicobacter pylori infection in these populations. These data can be used to develop interventions to reduce risk factors and improve access to health services among AI/AN people at high risk for gastric cancer.


Conflict of interest statement

No conflicts of interest to disclose.

Figures

Figure 1:
Figure 1:
Gastric cancer incidence ratesa and rate ratios by stage of diagnosis, sex, and Indian Health Service region for American Indian/Alaska Nativeb and white populations in PRCDA counties, 2005–2016. Figure 1 contains two bar separate bar graphs, one for male and one for females. Each show gastric cancer incidence rates for AI/AN compared to white populations by stage of disease and Indian Health service region for those regions that are Purchased/Referred Care Delivery Area (PRCDA) counties. The figures also show the AI/AN versus white rate ratio. aRates are per 100,000 and age-adjusted to the 2000 US Std Population (19 age groups-Census P25–1130) standard; Confidence Intervals (Tiwari model) are 95% for rates and ratios b AI/AN race is reported by NPCR and SEER registries or through linkage with the IHS patient registration database. The updated bridged intercensal population estimates significantly overestimate AI/AN populations of Hispanic origin. All analyses are limited to non-Hispanic AI/AN populations. Non-Hispanic White was chosen as the reference population. The term “non-Hispanic” is omitted when discussing both groups c The rate ratio indicates that the AI/AN rate is significantly different than the rate for whites (P<0.05). Rates are per 100,000 and age-adjusted to the 2000 US Std Population (19 age groups-Census P25–1130) standard; Confidence Intervals (Tiwari model) are 95% for rates and ratios Localized: Disease restricted to the stomach Regional: Disease extended into organ and areas adjacent to the stomach. Distant: Disease metastasized to portions of the body not adjacent to the stomach Unstaged: Diagnosis could not be determined
Figure 2:
Figure 2:
Gastric adenocarcinoma incidence ratesa and rate ratios by anatomic subsite, sex, and Indian Health Service region for American Indian/Alaska Nativeb and white populations in PRCDA counties, 2005–2016. Figure 2 contains two bar separate bar graphs, one for male and one for females. Each show gastric cancer incidence rates for AI/AN compared to white populations by anatomic subsite and Indian Health service region for those regions that are Purchased/Referred Care Delivery Area (PRCDA) counties. The figures also show the AI/AN versus white rate ratio. aRates are per 100,000 and age-adjusted to the 2000 US Std Population (19 age groups-Census P25–1130) standard; Confidence Intervals (Tiwari model) are 95% for rates and ratios b AI/AN race is reported by NPCR and SEER registries or through linkage with the IHS patient registration database. The updated bridged intercensal population estimates significantly overestimate AI/AN populations of Hispanic origin. All analyses are limited to non-Hispanic AI/AN populations. Non-Hispanic White was chosen as the reference population. The term “non-Hispanic” is omitted when discussing both groups c The rate ratio indicates that the AI/AN rate is significantly different than the rate for whites (P<0.05). Rates are per 100,000 and age-adjusted to the 2000 US Std Population (19 age groups-Census P25–1130) standard; Confidence Intervals (Tiwari model) are 95% for rates and ratios d Includes primary Sites C16.0-C16.1 (topography codes from the International Classification of Diseases for Oncology) e Includes primary sites C16.2-C16.6 f Includes primary sites C16.8-C16.9
Figure 3.
Figure 3.
Trends in gastric cancer incidence for American Indian/Alaska Native and white males and females, all regions, PRCDA counties, 1999–2016 Figure 3 contains four lines describing the gastric cancer incidence rates and trends between 1999—2016 for AI/AN males, AI/AN females, white males and white females. It also contains the average annual percent change in incidence rates for these groups. Source: Cancer Registries in the National Program of Cancer Registries (NPCR) of the Centers for Disease Control and Prevention and the Surveillance, Epidemiology, and End Results (SEER) program of the National Cancer Institute PRCDA Purchased/Referred Care Delivery Areas; IHS Indian Health Service; AI/AN; American Indian/Alaska Native; W; non-Hispanic white a APC (Annual Percent Change) is based on rates that were age-adjusted to the 2000 US standard population (11 age groups, Census P25–1130). * 2-sided P < 0.05

References

    1. Karimi P, Islami F, Anandasabapathy S, et al. Gastric cancer: descriptive epidemiology, risk factors, screening, and prevention. Cancer Epidemiol Biomarkers Prev 2014;23:700–13. - PMC - PubMed
    1. Melkonian SC, Jim MA, Haverkamp D, et al. Disparities in Cancer Incidence and Trends among American Indians and Alaska Natives in the United States, 2010–2015. Cancer Epidemiol Biomarkers Prev 2019;28:1604–1611. - PMC - PubMed
    1. Jim MA, Pinheiro PS, Carreira H, et al. Stomach cancer survival in the United States by race and stage (2001–2009): Findings from the CONCORD-2 study. Cancer 2017;123 Suppl 24:4994–5013. - PMC - PubMed
    1. Crew KD, Neugut AI. Epidemiology of gastric cancer. World J Gastroenterol 2006;12:354–62. - PMC - PubMed
    1. Kelley JR, Duggan JM. Gastric cancer epidemiology and risk factors. J Clin Epidemiol 2003;56:1–9. - PubMed

Publication types