. 2021 Mar;39(3):553-564.
doi: 10.1002/jor.24819. Epub 2020 Aug 11.

Evaluation of impaired growth plate development of long bones in skeletally immature mice by antirheumatic agents

Affiliations

Evaluation of impaired growth plate development of long bones in skeletally immature mice by antirheumatic agents

Marjolein M J Caron et al. J Orthop Res. 2021 Mar.

Abstract

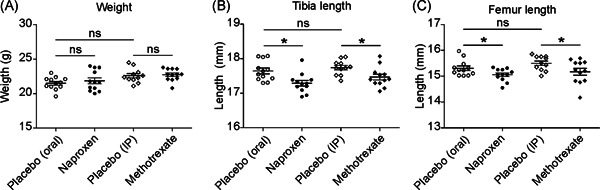
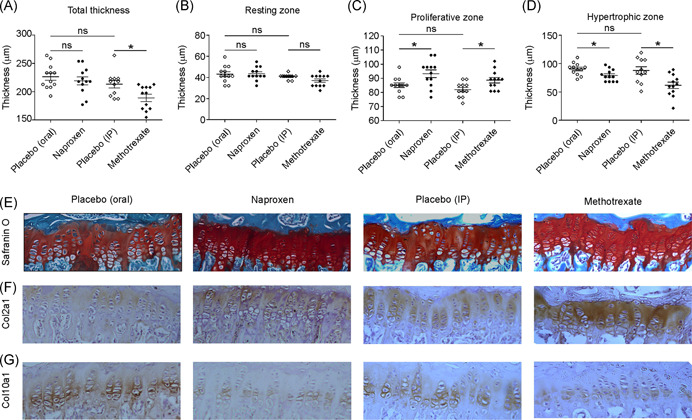
Restriction of physical growth and development is a known problem in patients with juvenile idiopathic arthritis (JIA). However, the effect of medical treatment for JIA on skeletal growth in affected children has not been properly investigated. We, therefore, hypothesize that naproxen and methotrexate (MTX) affect endochondral ossification and will lead to reduced skeletal development. Treatment of ATDC5 cells, an in vitro model for endochondral ossification, with naproxen or MTX resulted in increased chondrogenic but decreased hypertrophic differentiation. In vivo, healthy growing C57BL/6 mice were treated with naproxen, MTX, or placebo for 10 weeks. At 15 weeks postnatal, both the length of the tibia and the length of the femur were significantly reduced in the naproxen- and MTX-treated mice compared to their controls. Growth plate analysis revealed a significantly thicker proliferative zone, while the hypertrophic zone was significantly thinner in both experimental groups compared to their controls, comparable to the in vitro results. Micro-computed tomography analysis of the subchondral bone region directly below the growth disc showed significantly altered bone microarchitecture in naproxen and MTX groups. In addition, the involvement of the PTHrP-Ihh loop in naproxen- and MTX-treated cells was shown. Overall, these results demonstrate that naproxen and MTX have a profound effect on endochondral ossification during growth plate development, abnormal subchondral bone morphology, and reduced bone length. A better understanding of how medication influences the development of the growth plate will improve understanding of endochondral ossification and reveal possibilities to improve the treatment of pediatric patients.

Keywords: JIA; MTX; endochondral ossification; growth plate; naproxen.


Conflict of interest statement

The authors declare that there are no conflict of interests.

Figures

Figure 1
Figure 1
Influence of naproxen and MTX on chondrogenic differentiation of ATDC5 cells. ATDC5 cells were differentiated under control conditions (white bars) and with naproxen (1 mM; dotted bars) or MTX (1 µM; black bars) for 7 and 14 days. A, Induction of chondrogenic markers Col2a1 and Sox9 mRNA expression was determined by RT‐qPCR at day 7 and 14 in differentiation, relatively to day 0 conditions and normalized for β‐actin mRNA expression. B, Glycosaminoglycan (GAG) content (corrected for protein content) was analyzed by DMB assay and fold change of t = 7 and t = 14 samples were calculated as compared to t = 0 samples. C, Induction of hypertrophic markers Col10a1 and Runx2 mRNA expression was determined by RT‐qPCR at day 7 and 14 in differentiation, relatively to day 0 conditions and normalized for β‐actin mRNA expression. D, DNA content was measured and t = 7 and t = 14 samples were compared to t = 0 samples. In graphs, error bars represent mean ± SEM. Statistical significant differences (P < .05) are shown by an *,**P < .01, ***P < .0001, NS. DMB, dimethyl methylene blue; mRNA, messenger RNA; MTX, methotrexate; NS, not significant; RT‐qPCR, real‐time quantitative polymerase chain reaction
Figure 2
Figure 2
Weight and length measurements in control, naproxen, and MTX‐treated mice. Five weeks old C57BL/6 mice were orally treated with either naproxen (10 mg/kg/d; n = 12) or placebo (n = 12) or received IP injections with MTX (1 mg/kg; three times per week; n = 12) or placebo (n = 11) for 10 weeks. At 15 weeks of age weight (A) and length of the tibia (B) and femur (C) were analyzed. Each dot represents the determined value for each of the individual mice and lines in graphs indicate mean ± SEM. Statistical significant differences (P < .05) are shown by an *NS. IP, intraperitoneal; MTX, methotrexate; NS, not significant
Figure 3
Figure 3
Growth plate stainings and measurements in control, naproxen‐ and MTX‐treated mice. The thickness of the tibia growth plate and individual zones was measured on hematoxylin‐stained sections. A, Thickness of the total growth plate. B, The thickness of the resting zone. C, The thickness of the proliferative zone. D, The thickness of the hypertrophic zone. In adjacent growth plate sections (immuno)histochemical stainings were performed and analyzed. E, Safranin‐O/Fast green staining. F, Collagen type II immunohistochemical staining. G, Collagen type X immunohistochemical staining. Each dot represents the determined value for each of the individual mice and lines in graphs indicate mean ± SEM. Statistical significant differences (P < .05) are shown by an *NS. IP, intraperitoneal; MTX, methotrexate; NS, not significant [Color figure can be viewed at wileyonlinelibrary.com]
Figure 4
Figure 4
Bone microstructure analysis in control, naproxen‐ and MTX‐treated mice. Bone microstructure in the first calcified zone in tibia was determined by µCT. A, Quantification of bone volume density. B, Quantification of bone density. C, Quantification of trabecular thickness, number (D), and separation (E). Each dot represents the determined value for each of the individual mice and lines in graphs indicate mean ± SEM. Statistical significant differences (P < .05) are shown by an *NS. µCT, micro‐computed tomography; IP, intraperitoneal; MTX, methotrexate; NS, not significant; Tb.N, trabecular number; Tb.Sp, trabecular separation; Tb.Th, trabecular thickness
Figure 5
Figure 5
ALP activity and hydroxyproline in ulna of control, naproxen‐ and MTX‐treated mice. Skeletal consequences of treatment with naproxen or MTX was determined. A, ALP enzymatic activity of cortical bone samples was determined and normalized to total DNA content. B, Hydroxyproline levels corrected for DNA content were determined in cortical bone samples. Each dot represents the determined value for each of the individual mice and lines in graphs indicate mean ± SEM. Statistical significant differences (P < .05) are shown by an *NS. ALP, alkaline phosphatase; IP, intraperitoneal; MTX, methotrexate; NS, not significant
Figure 6
Figure 6
Involvement of Ihh‐PTHrP loop in effects of naproxen and MTX on endochondral ossification in vitro and in vivo. ATDC5 cells were differentiated under control conditions (white bars) and with naproxen (1 mM; dotted bars) or MTX (1 µM; black bars) for 7 and 14 days. A, PTHrP and Ihh mRNA expression were determined by RT‐qPCR at day 7 and 14 in differentiation, relatively to day 0 conditions and normalized for β‐actin mRNA expression. B, mRNA expression of Ihh receptor patched 1 and 2 was determined by RT‐qPCR at day 7 and 14 in differentiation, relatively to day 0 conditions and normalized for β‐actin mRNA expression. C, mRNA expression of Ihh signaling‐induced transcription factors Gli1 and Gli3 were determined by RT‐qPCR at day 7 and 14 in differentiation, relatively to day 0 conditions and normalized for β‐actin mRNA expression. In graphs, error bars represent mean ± SEM. Statistical significant differences (p < .05) are shown by an *,**p < .01, ***p < .0001, NS. mRNA, messenger RNA; MTX, methotrexate; NS, not significant; RT‐qPCR, real‐time quantitative polymerase chain reaction

Similar articles

Cited by

References

    1. Kronenberg HM. Developmental regulation of the growth plate. Nature. 2003;423:332‐336. - PubMed
    1. Shim KS. Pubertal growth and epiphyseal fusion. Ann Pediatr Endocrinol Metab. 2015;20:8‐12. - PMC - PubMed
    1. Chung R, Xian CJ. Recent research on the growth plate: mechanisms for growth plate injury repair and potential cell‐based therapies for regeneration. J Mol Endocrinol. 2014;53:T45‐T61. - PubMed
    1. Politoolito C, Strano CG, Olivieri AN, et al. Growth retardation in non‐steroid treated juvenile rheumatoid arthritis. Scand J Rheumatol. 1997;26:99‐103. - PubMed
    1. McerlanecErlane F, Carrasco R, Kearsley‐Fleet L, et al. Growth patterns in early juvenile idiopathic arthritis: results from the Childhood Arthritis Prospective Study (CAPS). Semin Arthritis Rheum. 2018;48:53‐60. - PMC - PubMed

Publication types