[Preprint]. 2020 Jul 16:3652322.
doi: 10.2139/ssrn.3652322.

The Loss of Bcl-6 Expressing T Follicular Helper Cells and the Absence of Germinal Centers in COVID-19

Affiliations

The Loss of Bcl-6 Expressing T Follicular Helper Cells and the Absence of Germinal Centers in COVID-19

Naoki Kaneko et al. SSRN. .

Update in

  • Loss of Bcl-6-Expressing T Follicular Helper Cells and Germinal Centers in COVID-19.
    Kaneko N, Kuo HH, Boucau J, Farmer JR, Allard-Chamard H, Mahajan VS, Piechocka-Trocha A, Lefteri K, Osborn M, Bals J, Bartsch YC, Bonheur N, Caradonna TM, Chevalier J, Chowdhury F, Diefenbach TJ, Einkauf K, Fallon J, Feldman J, Finn KK, Garcia-Broncano P, Hartana CA, Hauser BM, Jiang C, Kaplonek P, Karpell M, Koscher EC, Lian X, Liu H, Liu J, Ly NL, Michell AR, Rassadkina Y, Seiger K, Sessa L, Shin S, Singh N, Sun W, Sun X, Ticheli HJ, Waring MT, Zhu AL, Alter G, Li JZ, Lingwood D, Schmidt AG, Lichterfeld M, Walker BD, Yu XG, Padera RF Jr, Pillai S; Massachusetts Consortium on Pathogen Readiness Specimen Working Group. Kaneko N, et al. Cell. 2020 Oct 1;183(1):143-157.e13. doi: 10.1016/j.cell.2020.08.025. Epub 2020 Aug 19. Cell. 2020. PMID: 32877699 Free PMC article.

Abstract

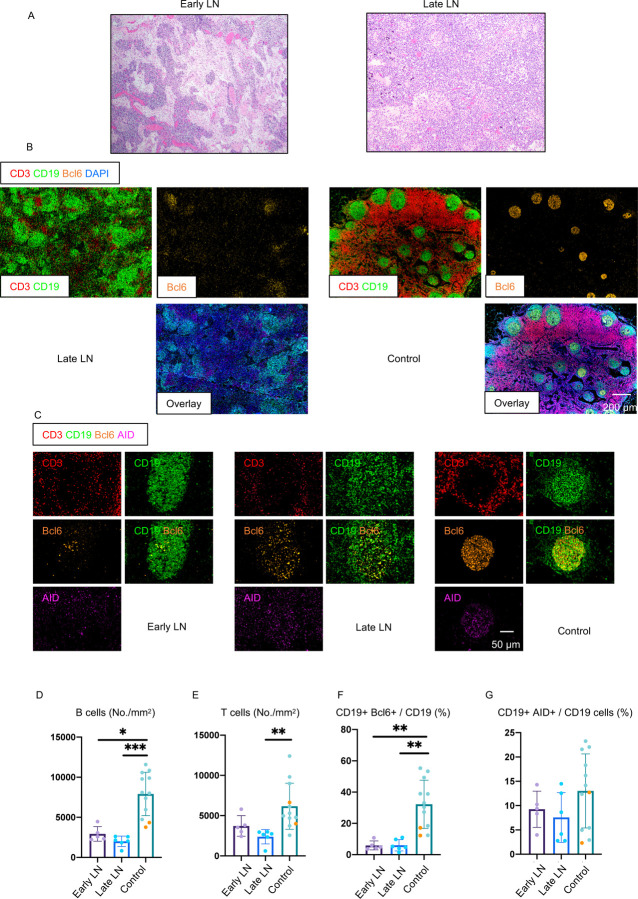
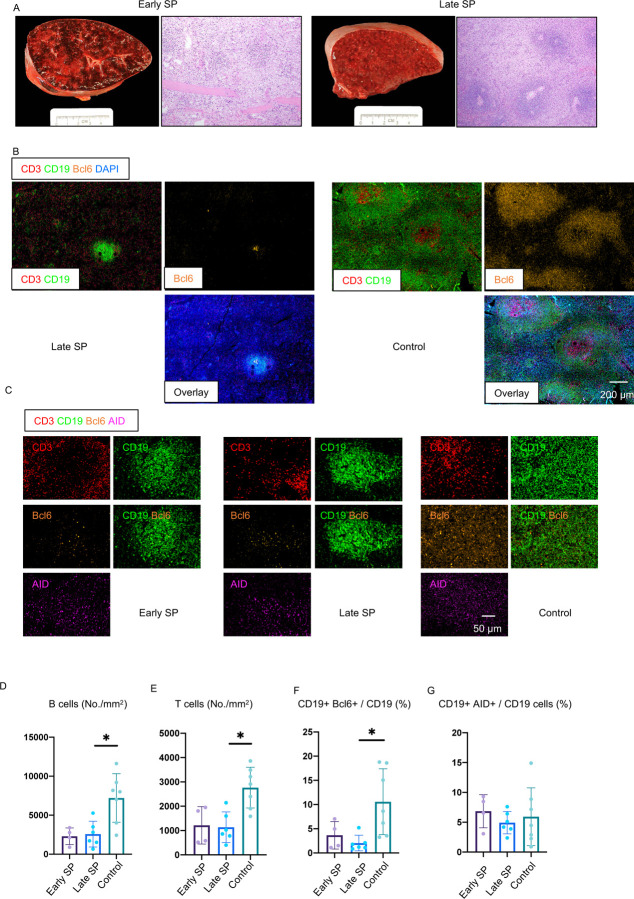
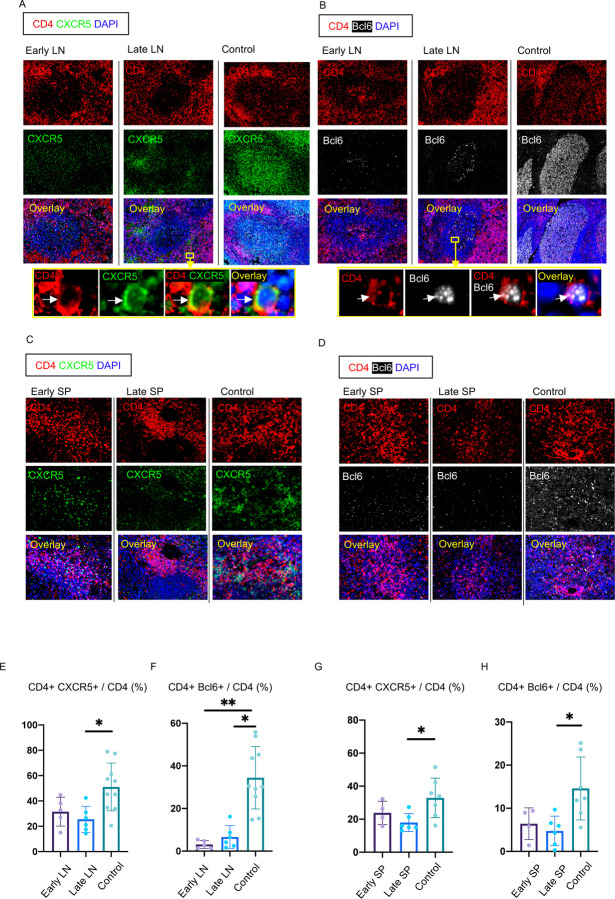
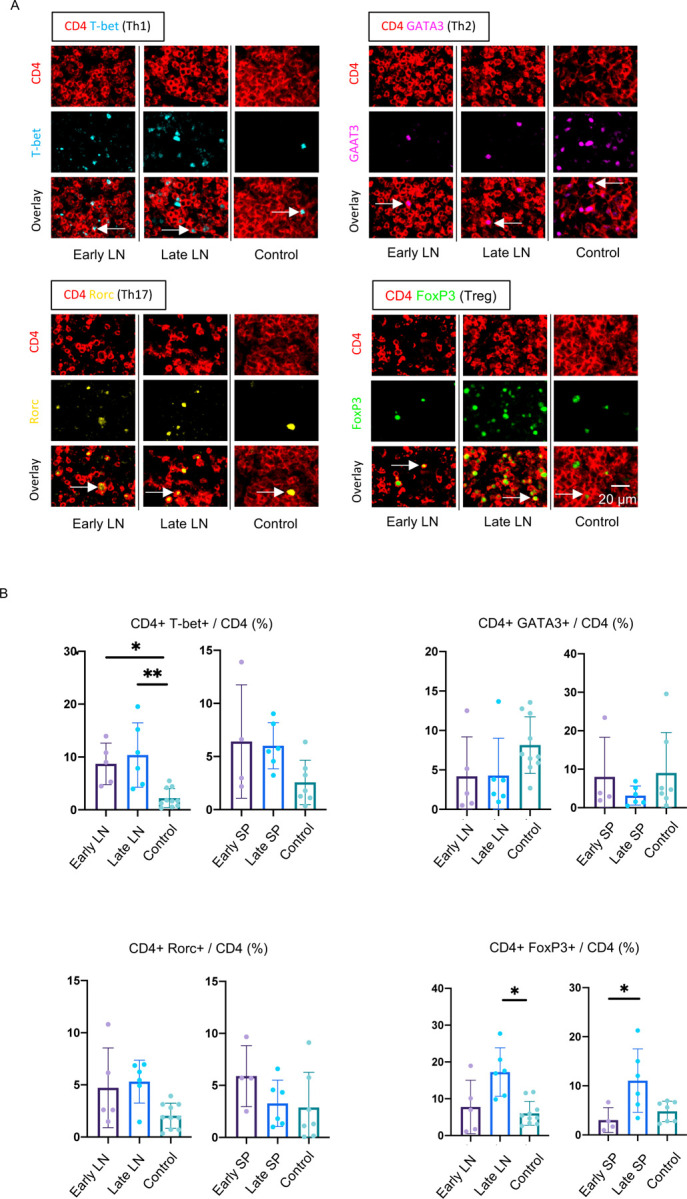
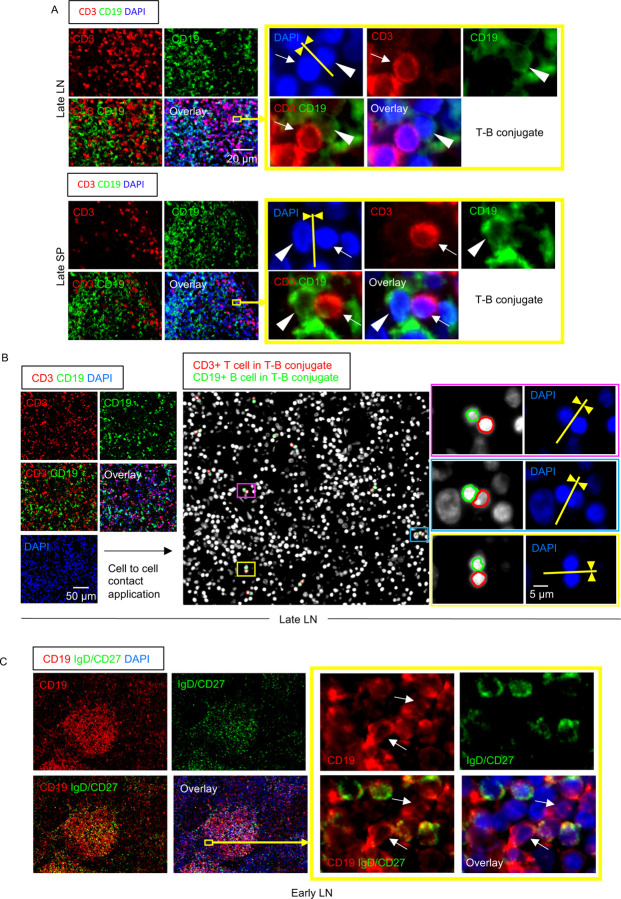
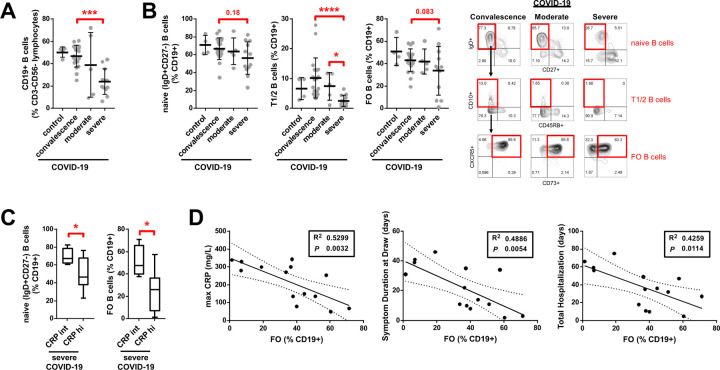
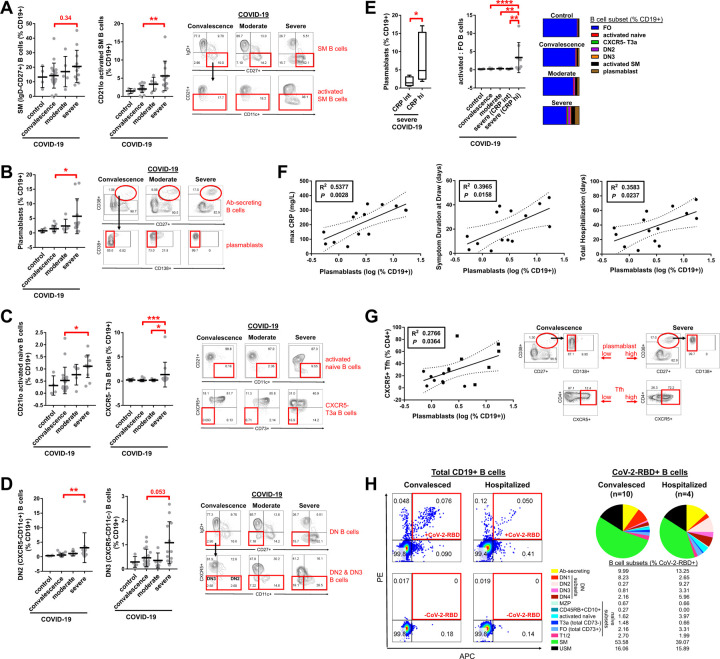
Humoral responses in COVID-19 disease are often of limited durability, as seen with other human coronavirus epidemics. To address the underlying etiology, we examined postmortem thoracic lymph nodes and spleens in acute SARS-CoV-2 infection and observed the absence of germinal centers, a striking reduction in Bcl-6+ germinal center B cells but preservation of AID+ B cells. Absence of germinal centers correlated with an early specific block in Bcl-6+TFH cell differentiation together with an increase in T-bet+TH1 cells and aberrant extra-follicular TNF-a accumulation.  Parallel peripheral blood studies revealed loss of transitional and follicular B cells in severe disease and accumulation of SARS-CoV-2-specific "disease-related" B cell populations. These data identify defective Bcl-6+TFH cell generation and dysregulated humoral immune induction early in COVID-19 disease, providing a mechanistic explanation for the limited durability of antibody responses in coronavirus infections and suggest that achieving herd immunity through natural infection may be difficult. Funding: This work was supported by NIH U19 AI110495 to SP, NIH R01 AI146779 to AGS, NIH R01AI137057 and DP2DA042422 to DL, BMH was supported by NIGMS T32 GM007753, TMC was supported by T32 AI007245. Funding for these studies from the Massachusetts Consortium of Pathogen Readiness, the Mark and Lisa Schwartz Foundation and Enid Schwartz is also acknowledged. Conflict of Interest: None. Ethical Approval: This study was performed with the approval of the Institutional Review Boards at the Massachusetts General Hospital and the Brigham and Women's Hospital.


Figures

Figure 1.
Figure 1.. Early loss of germinal centers and Bcl-6 expressing B cells in COVID-19 thoracic lymph nodes
(A) Hematoxylin–eosin staining of lymph nodes from early (left) and late (right) COVID-19 patients. (B) Low-power images of CD3 (red), CD19 (green), Bcl-6 (orange) and DAPI (blue) staining in a lymph node from a late COVID-19 patient (left) and control (right). (C) Representative multi-color immunofluorescence images of CD3 (red), CD19 (green), Bcl-6 (orange) and AID (purple) staining in lymph nodes from early (left) and late (middle) COVID-19 patients and controls (right). (D and E) Absolute numbers of CD19+ B cells (D) and CD3+ T cells (E) in lymph nodes from early (purple) (n = 5) and late (blue) (n = 6) COVID-19 patients and controls (green and orange) (n = 12). Controls include lymph nodes (n = 2) and tonsils (n = 10). Orange dots mark lymph nodes and green dots mark tonsils. (F and G) Relative proportion of Bcl6+ B cells (F) and AID+ B cells (G) among CD19+ B cells in lymph nodes from early (purple) (n = 5) and late (blue) (n = 6) COVID-19 patients and controls (green and orange) (n = 12). LN= Lymph node. Multiple comparisons are controlled for by Kruskal-Wallis test. Error bars represent mean ±SEM. *p < 0.05; **p < 0.01; ***p < 0.001.
Figure 2.
Figure 2.. White pulp attrition, early loss of germinal centers and Bcl-6 expressing B cells in COVID-19 spleens
(A) Cross-sectional view of whole spleen and hematoxylin–eosin staining from early (left) and late (right) COVID-19 patients. (B) Low-power images of CD3 (red), CD19 (green), Bcl-6 (orange) and DAPI (blue) staining in a spleen from late COVID-19 patient (left) and control (right). (C) Representative multi-color immunofluorescence image of CD3 (red), CD19 (green), Bcl-6 (orange) and AID (purple) staining in spleens from early (left) and late (middle) COVID-19 patients and controls (right). (D and E) Absolute numbers of CD19+ B cells (D) and CD3+ T cells (E) in spleens from early (purple) (n = 4) and late (blue) (n = 6) COVID-19 patients and controls (green) (n = 7). (F and G) Relative proportion of Bcl-6+ B cells (F) and AID+ B cells (G) among CD19+ B cells in spleens from early (purple) (n = 4) and late (blue) (n = 6) COVID-19 patients and controls (green) (n = 7). SP=Spleen. Multiple comparisons are controlled for by Kruskal-Wallis test. Error bars represent mean ±SEM. *p < 0.05.
Figure 3.
Figure 3.. Loss of germinal center type Bcl-6+ T follicular helper cells in COVID-19 lymph nodes and spleens
(A) Representative multi-color immunofluorescence image of CD4 (red), CXCR5 (green) and DAPI (blue) staining in lymph nodes from early (left) and late (middle) COVID-19 patients and controls (right). Arrows indicate CD4+ CXCR5+ TFH cells. (B) Representative multi-color immunofluorescence images of CD4 (red), Bcl-6 (white) and DAPI (blue) staining in lymph nodes from early (left) and late (middle) COVID-19 patients and controls (right). Arrows indicate CD4+ Bcl-6+ GC-type TFH cells. (C) Representative multi-color immunofluorescence image of CD4 (red), CXCR5 (green) and DAPI (blue) staining in spleens from early (left) and late (middle) COVID-19 patients and controls (right). (D) Representative multi-color immunofluorescence image of CD4 (red), Bcl-6 (white) and DAPI (blue) staining in spleens from early (left) and late (middle) COVID-19 patients and controls (right). (E and F) Relative proportions of CD4+ CXCR5+ TFH cells (E) and CD4+ Bcl-6+ GC-type TFH cells among CD4+ T cells (F) in lymph nodes from early (purple) (n = 5) and late (blue) (n = 6) COVID-19 patients and controls (green) (n = 10). (G and H) Relative proportions of CD4+ CXCR5+ TFH cells (G) and CD4+ Bcl-6+ GC-type TFH (H) among CD4+ T cells in spleens from early (purple) (n = 4) and late (blue) (n = 6) COVID-19 patients and controls (green) (n = 7). Multiple comparisons are controlled for by Kruskal-Wallis test. Error bars represent mean ±SEM. *p < 0.05; **p < 0.01.
Figure 4.
Figure 4.. TH1 cells are prominent among CD4+T cell subsets in thoracic lymph nodes and spleens
(A) Representative multi-color staining showing TH1, TH2, TH17 and Treg cells in lymph nodes form early (left) and late (middle) COVID-19 patients and control (right). [TH1: CD4+ (red) T-bet+ (light blue)] [TH2: CD4+ (red) GATA3+ (purple)] [TH17: CD4+ (red) RORγ+ (yellow)] [Treg: CD4+ (red) FoxP3+ (green)]. (B) Relative proportions of TH1 (upper left), TH2 (upper right), TH17 (lower left) and Treg (lower right) cells among CD4+ T cells in lymph nodes and spleens from early (purple) (n = 5) and late (blue) (n = 6) COVID-19 patients and controls (green) (n = 10). Multiple comparisons are controlled for by Kruskal-Wallis test. Error bars represent mean ±SEM. *p < 0.05; **p < 0.01.
Figure 5.
Figure 5.. Follicular and extra-follicular T-B conjugates and IgDCD27 B cells in COVID-19 lymph nodes
(A) Immunofluorescence staining of CD3 (red), CD19 (green) and DAPI (blue) in a lymph node (top) and a spleen (bottom) in late COVID-19 patient. Arrows and arrowheads indicate CD3+ T cells and CD19+ B cells respectively. T cell and B cells formed close and extensive intercellular plasma membrane contacts. (B) Immunofluorescence staining (left panels) and visualization of T-B conjugates (middle and right panels) in a lymph node from a late COVID-19 patient using the Strata Quest cell-to-cell contact application. Masks of the nuclei based on DAPI staining establish the inner boundary of the cytoplasm and the software “looks” outwards towards the plasma membrane boundary. An overlap of at least 3 pixels of adjacent cell markers was required to establish each “contact” criterion. Details are in the Methods section. Nuclei surrounded by red and green lines respectively depict CD3+ T cells and CD19+ B cells in T-B conjugates. (C) Representative multi-color immunofluorescence image of CD19 (red), IgD and CD27 (both in green) and DAPI (blue) staining in a lymph node from an early COVID-19 patient. IgD−/CD27− double negative B cells (red staining with no green overlap) are abundant inside the follicle and also outside. Boxed area depicts some of these cells outside the follicle.
Fig. 6.
Fig. 6.. Decreased early transitional and follicular B cells in the peripheral blood of patients with severe COVID-19.
Quantitation of (A) total CD19+ B cells and (B) naïve, early transitional (T1/2), and follicular (FO) B cell subsets in the peripheral blood of patients with COVID-19 at states of convalescence (n=19), moderate disease (n=5), and severe disease (n=12) as defined by the clinical criteria listed in Table S2 as compared to healthy controls (n=4). Quantitation shown by B cell level for each individual patient with mean, standard deviation, and significance by one-way ANOVA of log % B cell value indicated (*P < 0.05, ***P < 0.001, ****P < 0.0001). Representative dot plots shown (B) with full B cell flow cytometry gating strategy outlined in Fig. S6. (C) Quantitation of naïve and FO B cell frequencies in the peripheral blood of patients with severe COVID-19 subdivided by intermediate (int, < 200 mg/L) versus high (hi, > 200 mg/L) maximum C-reactive protein (CRP) level and shown as box and whiskers plot with significance by Student’s t-test of log % B cell value indicated (*P < 0.05). (D) Association of FO B cell frequency in the peripheral blood of hospitalized COVID-19 patients (moderate and severe disease) with maximum CRP level, symptom duration at blood draw, and total length of hospital stay by linear regression with individual patients, 95% confidence bands, R2 and P values shown.
Fig. 7.
Fig. 7.. Increased activated B cell subsets specific for CoV-2-RBD in the peripheral blood of patients with severe COVID-19.
Quantitation of (A) switched memory (SM) B cells, (B) plasmablasts, (C) activated naïve and CXCR5- late transitional (T3a) B cells, (D) double negative (DN) B cells, and (E, right) total (sum) activated to follicular B cell ratios in the peripheral blood of patients with COVID-19 at states of convalescence (n=19), moderate disease (n=5), and severe disease (n=12) as defined by the clinical criteria listed in Table S2 as compared to healthy controls (n=4). Quantitation shown by B cell level for each individual patient with mean, standard deviation, and significance by one-way ANOVA of log % B cell value indicated (*P < 0.05, **P < 0.01, ***P < 0.001, ****P < 0.0001). Representative dot plots shown with full B cell flow cytometry gating strategy outlined in Fig. S6. (E, left) Quantitation of plasmablast frequency in the peripheral blood of patients with severe COVID-19 subdivided by intermediate (int, < 200 mg/L) versus high (hi, > 200 mg/L) maximum C-reactive protein (CRP) level and shown as box and whiskers plot with significance by Student’s t-test of log % B cell value indicated (*p < 0.05). (F) Association of plasmablast frequency in the peripheral blood of hospitalized COVID-19 patients (moderate and severe disease) with maximum CRP level, symptom duration at blood draw, and total length of hospital stay by linear regression with individual patients, 95% confidence bands, R2 and P values shown. (G) Association of plasmablast frequency in the peripheral blood of COVID-19 patients with T follicular helper cell frequency by linear regression with individual patients (squares indicating severe disease), 95% confidence bands, R2 and P values shown. Representative dot plots shown. (H) Summation of all CD19+ B cells binding to CoV-2-RBD shown for n=10 convalesced and n=4 hospitalized COVID-19 patients with % CoV2-RBD reactivity by B cell subset indicated and representative dot plots shown. % CoV-2-RBD reactivity by B cell subset per individual patient further detailed in Fig. S7. DN2 and DN3 Double negative B cells are CXCR5 low, while DN1 and DN4 B cells are CXCR5hi.

Comment in

References

    1. Amanat F., Stadlbauer D., Strohmeier S., Nguyen T.H.O., Chromikova V., McMahon M., Jiang K., Arunkumar G.A., Jurczyszak D., Polanco J., et al. (2020). A serological assay to detect SARS-CoV-2 seroconversion in humans. Nat Med. - PMC - PubMed
    1. Buja L.M., Wolf D.A., Zhao B., Akkanti B., McDonald M., Lelenwa L., Reilly N., Ottaviani G., Elghetany M.T., Trujillo D.O., et al. (2020). The emerging spectrum of cardiopulmonary pathology of the coronavirus disease 2019 (COVID-19): Report of 3 autopsies from Houston, Texas, and review of autopsy findings from other United States cities. Cardiovasc Pathol 48, 107233. - PMC - PubMed
    1. Cao W.C., Liu W., Zhang P.H., Zhang F., and Richardus J.H. (2007). Disappearance of antibodies to SARS-associated coronavirus after recovery. N Engl J Med 357, 1162–1163. - PubMed
    1. Crotty S. (2014). T follicular helper cell differentiation, function, and roles in disease. Immunity 41, 529–542. - PMC - PubMed
    1. Farmer J.R., Allard-Chamard H., Sun N., Ahmad M., Bertocchi A., Mahajan V.S., Aicher T., Arnold J., Benson M.D., Morningstar J., et al. (2019). Induction of metabolic quiescence defines the transitional to follicular B cell switch. Sci Signal 12. - PMC - PubMed

Publication types