. 2020 Aug;20(2):754-761.
doi: 10.3892/etm.2020.8761. Epub 2020 May 17.

Serum levels of 14-3-3η are associated with increased disease risk, activity and duration of rheumatoid arthritis in Chinese patients

Affiliations

Serum levels of 14-3-3η are associated with increased disease risk, activity and duration of rheumatoid arthritis in Chinese patients

Jianxin Tu et al. Exp Ther Med. 2020 Aug.

Abstract

The aim of the present study was to determine the association between serum 14-3-3η expression levels and disease risk, inflammation level and disease duration in Chinese patients with rheumatoid arthritis (RA). A total of 45 Chinese patients with RA, 45 patients with osteoarthritis (OA) and 44 age- and sex-matched (with the RA group) healthy control (HC) subjects were consecutively recruited for the present case-controlled study. In addition, the demographic and clinicopathological characteristics of the patients with RA were collected. Serum samples were obtained from patients with RA, patients with OA and the HCs, and the serum levels of 14-3-3η were determined by ELISA. Compared with that in the OA patients (P=0.006) and HCs (P<0.001), 14-3-3η expression was significantly increased in RA patients, and receiver operating characteristics (ROC) analysis indicated that it served as a potential predictive marker for the risk of RA. In patients with RA, serum levels of 14-3-3η were positively correlated with disease duration (P=0.003), erythrocyte sedimentation rate (P=0.006) and disease activity score in 28 joints (P=0.025). The proportion of rheumatoid factor (RF)-positive patients (P=0.023) and anti-citrullinated protein antibody (ACPA)-positive patients (P=0.002) with RA was increased (when 14-3-3η expression was increased) compared with RF-negative patients or ACPA-negative patients, respectively. Of note, 14-3-3η serum levels were able to distinguish patients with established RA (disease duration, >2 years) from patients with early RA (disease duration, ≤2 years) with an AUC of 0.759 (95% CI, 0.612-0.905), and the sensitivity and the specificity at the best cut-off point (14-3-3η=0.613 ng/ml) were 79.3 and 75.0%, respectively. Furthermore, 14-3-3η was able to differentiate between RF-positive RA patients and RF-negative patients or HCs. In conclusion, circulating 14-3-3η expression may serve as a novel biomarker for disease risk and activity of RA in Chinese patients.

Keywords: 14-3-3η; Chinese; disease activity; disease duration; disease risk; rheumatoid arthritis.


Figures

Figure 1
Figure 1
14-3-3η expression in RA patients, OA patients and HCs. (A) Serum level of 14-3-3η expression; (B) Predictive value of 14-3-3η in RA patients and OA patients; (C) Predictive value of 14-3-3η in RA and HCs. Receiver operating characteristic curves were drawn to assess the ability of 14-3-3η expression to distinguish RA patients from OA patients and HCs. RA, rheumatoid arthritis; OA, osteoarthritis; HCs, healthy controls; AUC, area under curve.
Figure 2
Figure 2
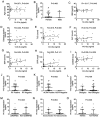
Correlation of 14-3-3η expression in serum with clinicopathological characteristics of patients with RA. The correlation of 14-3-3η expression with (A) age, (B) sex, (C) BMI, (D) disease duration, (E) TJC, (F) SJC, (G) ESR, (H) CRP (I) DAS28, (J) RF positive (K) ACPA positive, (L) Biologicals, (M) cDMARDs, (N) Glucocorticoids and (O) NSAIDs for RA are presented. RA, rheumatoid arthritis; HCs, healthy controls; BMI, body mass index; TJC, tender joint count; SJC, swollen joint count; ESR, erythrocyte sedimentation rate; CRP, C-reactive protein; DAS28, disease activity score in 28 joints; RF, rheumatoid factor; ACPA, anti-citrullinated protein antibody; cDMARDs, conventional disease-modifying anti-rheumatic drugs; NSAIDs, non-steroidal anti-inflammatory drugs.
Figure 3
Figure 3
ROC curve of 14-3-3η expression in serum for distinguishing between patients with established RA (>2 years) from patients with early RA (≤2 years). Expression of 14-3-3η between patients with established RA from patients with early RA with an area under the curve of 0.759; 95% CI, 0.612-0.905 at the appropriate cut-off point (the expression of 14-3-3η was 0.613 ng/ml). ROC curves were constructed to calculate the predictive value of 14-3-3η expression for RA risk. RA, rheumatoid arthritis; ROC, receiver operating characteristic curve; AUC, area under curve.
Figure 4
Figure 4
Comparison between RA patients with RF-positive and RF-negative status as well as HCs regarding 14-3-3η expression. (A) 14-3-3η expression in RA patients with RF-positive status was increased compared with that in RA patients with RF-negative status (P=0.046) and HCs (P<0.001). (B) Furthermore, 14-3-3η was able to distinguish RA patients with RF-positive status from RA patients with RF-negative status (AUC, 0.738; 95% CI, 0.550-0.925), and the sensitivity and the specificity at the best cut-off point (14-3-3η=1.537 ng/ml) was 62.5 and 90.0%, respectively. (C) 14-3-3η was also able to differentiate RA patients with RF-positive status from HCs (AUC, 0.760; 95%CI, 0.631-0.890), with a sensitivity and specificity at the best cut-off point (14-3-3η=0.062 ng/ml) of 65.2 and 86.4%, respectively. Comparison among groups was performed by using the Kruskal-Wallis H-test followed by Bonferroni correction. P<0.05 was considered to indicate a statistically significant difference. Receiver operating characteristic curves were drawn to assess the ability of 14-3-3η expression to distinguish RF positive RA patients from the RF negative RA patients and HCs. RA, rheumatoid arthritis; RF, rheumatoid factor; HCs, healthy controls; AUC, area under the curve.
Figure 5
Figure 5
Comparison of the predictive value for the risk of RA among 14-3-3η, CRP and ESR. The AUCs for 14-3-3η, CRP and ESR were 0.883 (95%CI: 0.813-0.952), 0.888 (95%CI: 0.817-0.956) and 0.961 (95%CI: 0.919-1.000), respectively, in predicting the risk of RA. Receiver operating characteristic curves were drawn to assess the ability of 14-3-3η, CRP and ESR expression to distinguish RA patients from HCs. RA, rheumatoid arthritis; CRP, C-reactive protein; ESR, erythrocyte sedimentation rate; AUC, area under the curve; HCs, healthy controls.

References

    1. Malmstrom V, Catrina AI, Klareskog L. The immunopathogenesis of seropositive rheumatoid arthritis: From triggering to targeting. Nat Rev Immunol. 2017;17:60–75. doi: 10.1038/nri.2016.124. - DOI - PubMed
    1. Smolen JS, Aletaha D, McInnes IB. Rheumatoid arthritis. Lancet. 2016;388:2023–2038. doi: 10.7326/AITC201901010. - DOI - PubMed
    1. McInnes IB, Schett G. The pathogenesis of rheumatoid arthritis. N Engl J Med. 2011;365:2205–2219. doi: 10.1056/NEJMra1004965. - DOI - PubMed
    1. Scott DL, Wolfe F, Huizinga TW. Rheumatoid arthritis. Lancet. 2010;376:1094–1108. doi: 10.7326/AITC201901010. - DOI - PubMed
    1. Isaacs JD. The changing face of rheumatoid arthritis: Sustained remission for all? Nat Rev Immunol. 2010;10:605–611. doi: 10.1038/nri2804. - DOI - PubMed