[Preprint]. 2020 Jul 19:2020.07.17.20156513.
doi: 10.1101/2020.07.17.20156513.

Large-scale Multi-omic Analysis of COVID-19 Severity

Affiliations

Large-scale Multi-omic Analysis of COVID-19 Severity

Katherine A Overmyer et al. medRxiv. .

Update in

  • Large-Scale Multi-omic Analysis of COVID-19 Severity.
    Overmyer KA, Shishkova E, Miller IJ, Balnis J, Bernstein MN, Peters-Clarke TM, Meyer JG, Quan Q, Muehlbauer LK, Trujillo EA, He Y, Chopra A, Chieng HC, Tiwari A, Judson MA, Paulson B, Brademan DR, Zhu Y, Serrano LR, Linke V, Drake LA, Adam AP, Schwartz BS, Singer HA, Swanson S, Mosher DF, Stewart R, Coon JJ, Jaitovich A. Overmyer KA, et al. Cell Syst. 2021 Jan 20;12(1):23-40.e7. doi: 10.1016/j.cels.2020.10.003. Epub 2020 Oct 8. Cell Syst. 2021. PMID: 33096026 Free PMC article.

Abstract

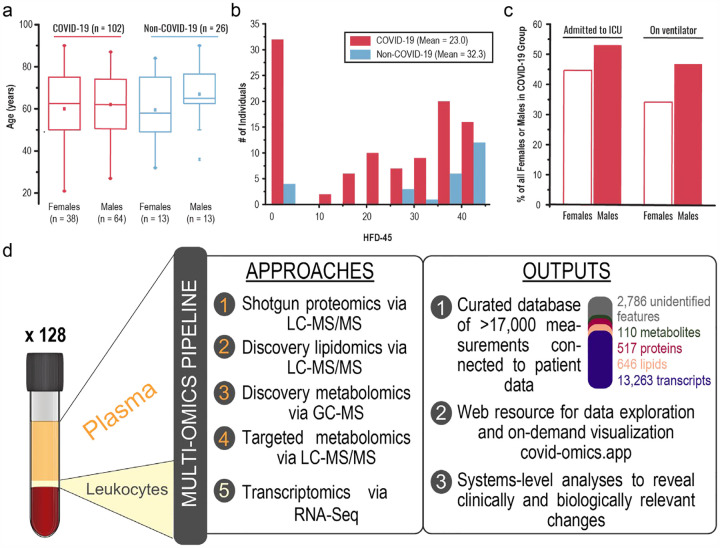
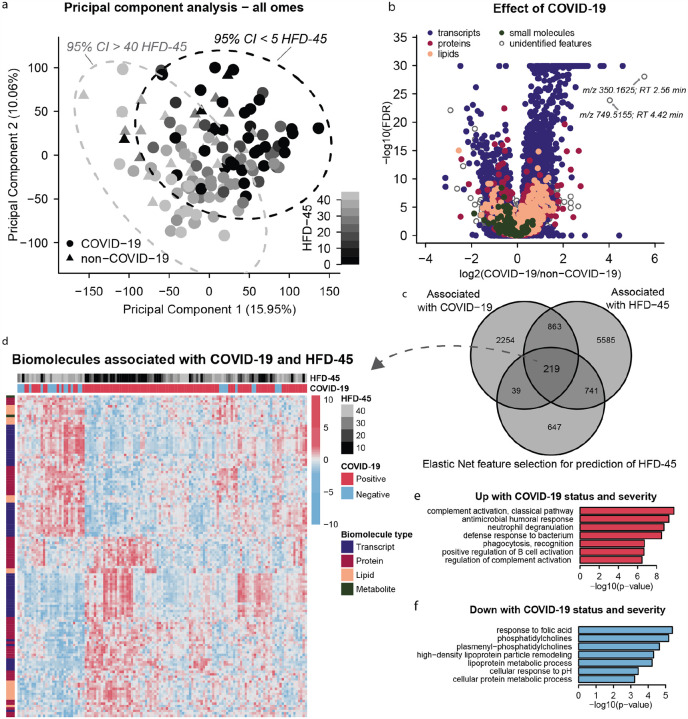
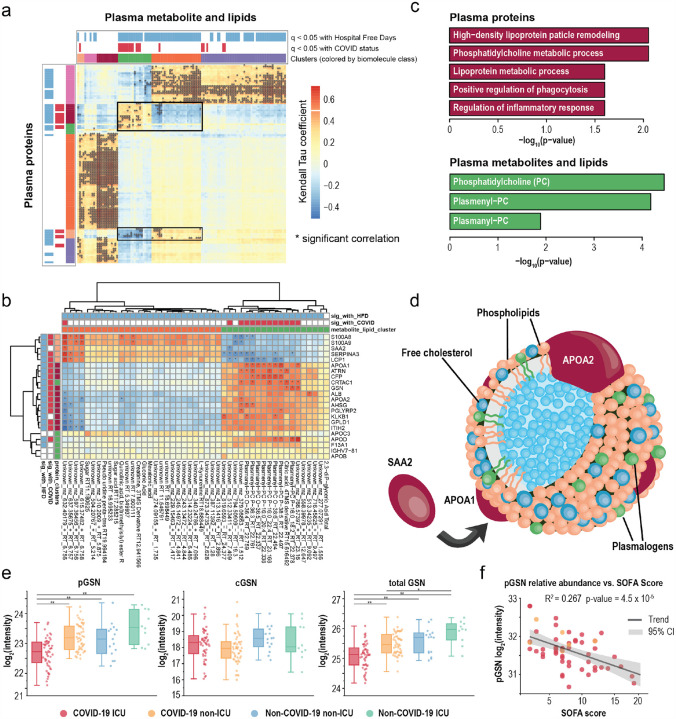
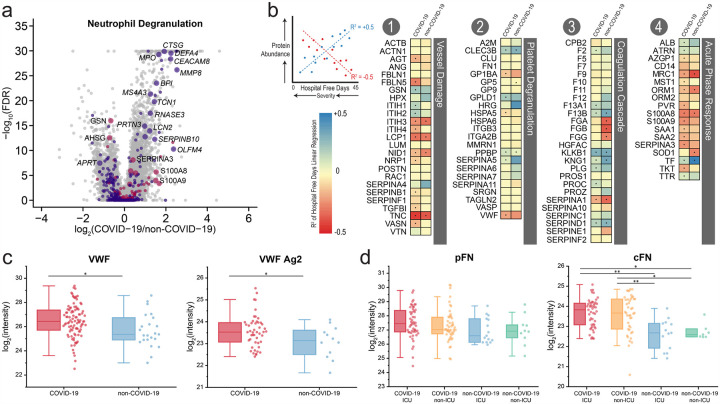
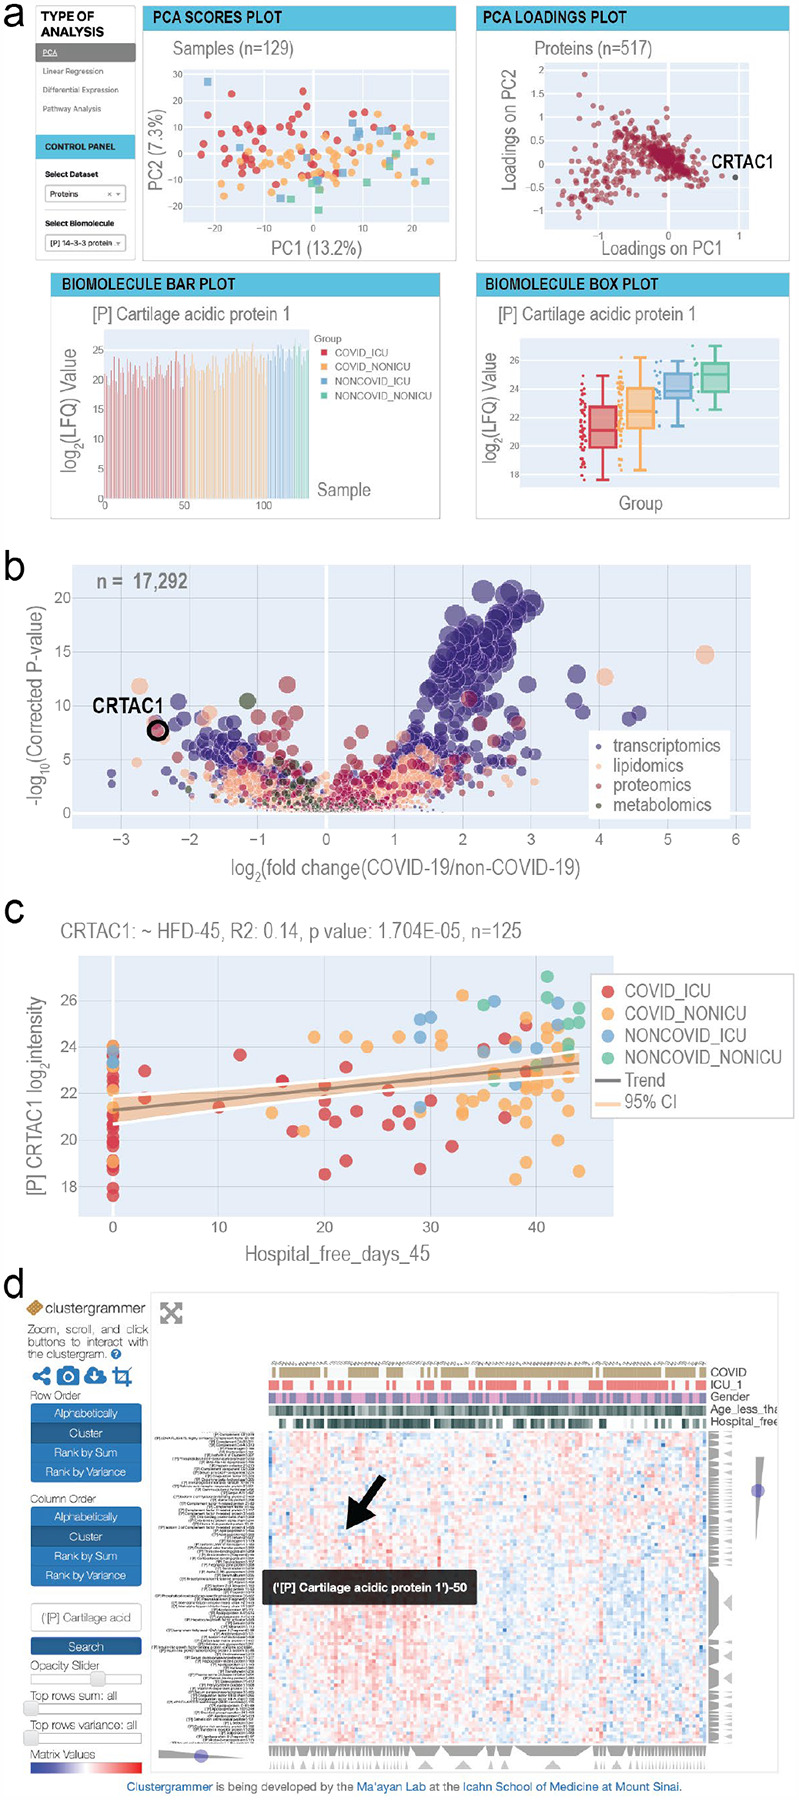
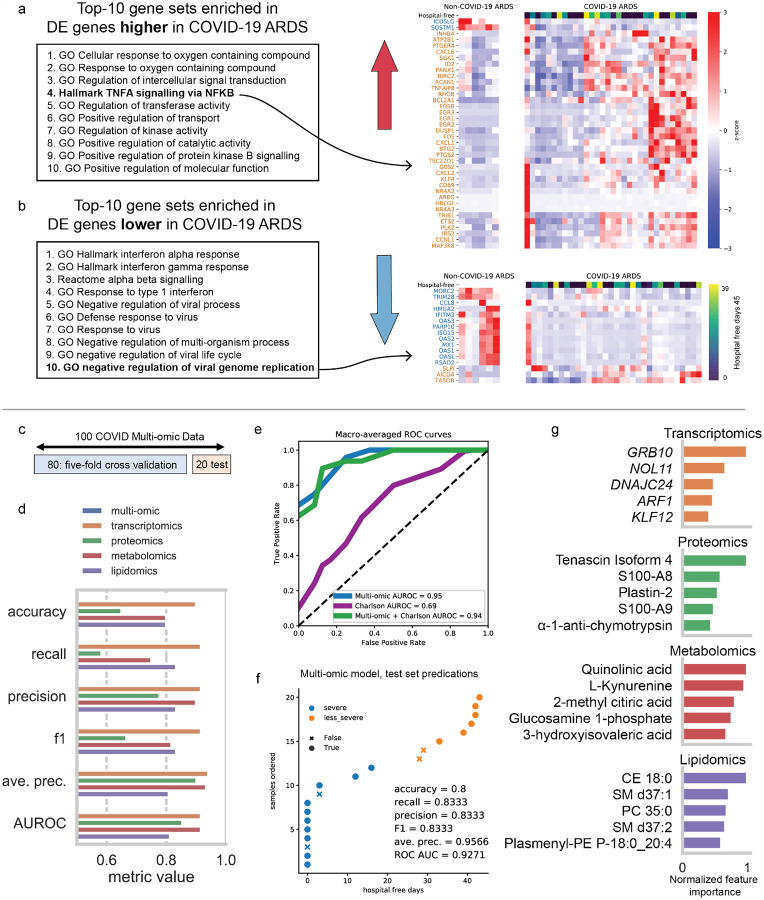
We performed RNA-Seq and high-resolution mass spectrometry on 128 blood samples from COVID-19 positive and negative patients with diverse disease severities. Over 17,000 transcripts, proteins, metabolites, and lipids were quantified and associated with clinical outcomes in a curated relational database, uniquely enabling systems analysis and cross-ome correlations to molecules and patient prognoses. We mapped 219 molecular features with high significance to COVID-19 status and severity, many involved in complement activation, dysregulated lipid transport, and neutrophil activation. We identified sets of covarying molecules, e.g., protein gelsolin and metabolite citrate or plasmalogens and apolipoproteins, offering pathophysiological insights and therapeutic suggestions. The observed dysregulation of platelet function, blood coagulation, acute phase response, and endotheliopathy further illuminated the unique COVID-19 phenotype. We present a web-based tool (covid-omics.app) enabling interactive exploration of our compendium and illustrate its utility through a comparative analysis with published data and a machine learning approach for prediction of COVID-19 severity.


Figures

Figure 1.
Figure 1.. Overview of sample cohort and experimental design.
a Age and sex distributions of COVID-19 (n = 102) and non-COVID-19 (n = 26) groups. b Distributions of hospital-free days over a continuous 45-day period aggregated with survival (HFD-45, see outcomes selection in the methods section) among COVID-19 and non-COVID-19 groups. c The proportion (%) of female and male patients who were admitted to the intensive care unit (ICU) and required support of a mechanical ventilator. d Overview of the study design, experimental approaches, and primary outcomes. Notice that the leukocytes were separated by filtering (see methods for details).
Figure 2.
Figure 2.. Multi-omics analysis reveals strong molecular signatures associated with COVID-19 status and severity.
a Principal component analysis using quantitative values from all omics data (leukocyte transcripts, and plasma proteins, lipids, and small molecules) shows principal components 1 and 2 capture 16% and 10% of the variance between patient samples. Plotting samples by these two components show a linear tread with hospital free days at 45 days (HFD-45). b Associations of biomolecules with COVID-19 status was determined using differential expression analysis (EBseq) for transcripts, and linear regression log-likelihood tests for plasma biomolecules, the adjusted p-values (1 - posterior probability or Benjamini Hochberg-adjusted pvalues, respectively) are plotted relative to the log2 fold change of mean values between COVID and non-COVID samples. In total, 2,537 leukocyte transcripts, 146 plasma proteins, 168 plasma lipids, and 13 plasma metabolites had adjusted p-values < 0.05. c Associations between biomolecules and HFD-45 was estimated using a univariate linear regression (HFD-45 ~ biomolecule abundance + age + sex) resulting in 7,408 biomolecules. A multivariate linear regression with elastic net penalty was applied to each omics dataset separately to further refine features of interest and resulted in 946 features. In total 219 features were determined as most important for distinguishing COVID status and severity. d The 219 features abundances were visualized via a heat map and clustered with hierarchical clustering. Features that were elevated (e) or reduced (f) with COVID status and severity were used for GO-term and molecular class enrichment analysis.
Figure 3:
Figure 3:. Leveraging the value of multi-omic data through cross-ome correlation analysis.
a Hierarchical clustering of Kendall Tau coefficients calculated for correlations between abundances of proteins (rows) and small molecules (lipids and metabolites; columns) in the pairwise fashion. Significance of their association with HFD-45 and COVID-19 status is indicated above the biomolecule clusters. b Re-clustering of biomolecules found in the clusters highlighted in panel a with molecule annotations. c Enrichment analyses of protein GO terms (purple) and small molecule classes (green) present in the cluster in panel b. d A schematic of a high-density lipoprotein (HDL) particle containing APOA1 and APOA2 proteins surrounded by various lipids, specifically plasmalogens. SAA2, also detected in the cluster in panel b, can replaced APOA1 within the particle. e Relative abundance measurements of plasma gelsolin (pGSN), cellular gelsolin (cGSN), and total gelsolin obtained using parallel reaction monitoring (PRM) on representative peptide sequences. * and ** indicate p-values < 0.05 and 0.001, respectively. f Regression analysis of plasma gelsolin levels and SOFA scores (R2 = 0.267, p = 4.53 × 10⁻⁵).
Figure 4.
Figure 4.. Biological processes dysregulated in COVID-19.
a Volcano plots highlighting proteins (pink) and transcripts (purple) assigned with the GO term 0043312 “Neutrophil Degranulation.” Increased point size signified the inclusion of the biomolecule in the list of 219 features most significantly associated with COVID-19 status and severity (Figure 2e). b Linear regressions of protein abundance vs. HFD-45 for the indicated proteins as measured in COVID-19 (left) and non-COVID-19 patients (right). Resulting R2 values and their associated +/− slope indicate the goodness of fit and change in abundance of a given protein with severity (HFD-45). Proteins that are more decreased in severe cases appear blue, while proteins that are increased in severe cases appear red. Significance of the protein vs. HFD-45 correlation is denoted by a dot (p-value < 0.01). c Relative abundance measurements of peptides attributed to plasma fibronectin (pFN) and cellular fibronectin (cFN). d Relative abundance measurements of VWF multimer and VWF Antigen-2 (VWF Ag2), as estimated based on relative abundances of its unique peptides. Peptide- and protein-level data are log2-transformed and grouped into four categories, according to patient status: COVID-19 ICU (red), COVID-19 non-ICU (orange), non-COVID-19 ICU (blue), and non-COVID-19 non-ICU (green). * and ** indicate p-values < 0.05 and 0.001, respectively.
Figure 5.
Figure 5.. Overview of the COVID-19 Multi-omics Web Tool.
a The home page provides principal component analysis (PCA) scores and loadings plots. Selected biomolecules are presented in a barplot and a boxplot. Each page provides buttons to navigate to the other web tools. b The differential expression page displays a multi-omics volcano plot with the y-axis representing −log10(p-values) where the p-values derive from the analysis in Figure 2 c The linear regression page allows users to select any combination of biomolecule and clinical measurement to analyze via univariate linear regression. R2 and p-values for the F-statistic are displayed on the plot. d The Clustergrammer page offers an interactive clustered heatmap.
Figure 6.
Figure 6.. Results from analyses demonstrating use-cases of this multi-omic resource.
a The top-ten enriched gene sets ranked by their adjusted p-value. For the gene set “TFNA signalling via NFKB”, we show a heatmap (right) of the z-score normalized expression data (in units of log transcripts per million) partitioned by whether the data came from the COVID-19-ARDS patients (right) or the non-COVID-19-ARDS (i.e. sepsis ARDS) patients from Englert et al. (left). The first row of each heatmap depicts the hospital-free days of each patient. We note that hospital-free days are not available for the Englert et al. dataset. The gene names labelling each row are colored according to whether the gene was deemed by EBSeq to be more highly expressed in COVID-19 ARDS (orange) or non-COVID-19 ARDS (blue). b Similar to (a); however, we instead analyze DE genes that are more lowly expressed in COVID-19 ICU patients. c Data splitting scheme for training and test sets from the 100 COVID patients with all four omic datasets. A random 20% was held out to be used for model evaluation, and the remaining 80% was used to determine the best hyperparameters with 5-fold cross validation. d Extra trees classifier performance metrics on the test set after hyperparameter optimization using each of the four omic datasets separately for training or all omic data combined. e Macro-averaged receiver-operator characteristic curves for the models trained with multi-omic data, Charlson score, or both multi-omic data and charlson score. f Test set predictions of the extra trees model trained on the combined multi-omic dataset showing correct predictions as a function of the disease severity defined by hospital free days. G Top 5 most important predictive features for each of the models trained on the four omic subsets. Feature importance for each set was normalized to the most important feature.

Comment in

References

    1. Ackermann M., Verleden S.E., Kuehnel M., Haverich A., Welte T., Laenger F., Vanstapel A., Werlein C., Stark H., Tzankov A., et al. (2020). Pulmonary Vascular Endothelialitis, Thrombosis, and Angiogenesis in Covid-19. N. Engl. J. Med. 383, 120–128. - PMC - PubMed
    1. Ali R.A., Gandhi A.A., Meng H., Yalavarthi S., Vreede A.P., Estes S.K., Palmer O.R., Bockenstedt P.L., Pinsky D.J., Greve J.M., et al. (2019). Adenosine receptor agonism protects against NETosis and thrombosis in antiphospholipid syndrome. Nat. Commun. 10, 1916. - PMC - PubMed
    1. Antcliffe D.B., Burnham K.L., Al-Beidh F., Santhakumaran S., Brett S.J., Hinds C.J., Ashby D., Knight J.C., and Gordon A.C. (2019). Transcriptomic Signatures in Sepsis and a Differential Response to Steroids. From the VANISH Randomized Trial. Am. J. Respir. Crit. Care Med. 199, 980–986. - PMC - PubMed
    1. Arndt S., Turvey C., and Andreasen N.C. (1999). Correlating and predicting psychiatric symptom ratings: Spearman’s r versus Kendall’s tau correlation. J. Psychiatr. Res. 33, 97–104. - PubMed
    1. Ashburner M., Ball C.A., Blake J.A., Botstein D., Butler H., Cherry J.M., Davis A.P., Dolinski K., Dwight S.S., Eppig J.T., et al. (2000). Gene ontology: tool for the unification of biology. The Gene Ontology Consortium. Nat. Genet. 25, 25–29. - PMC - PubMed

Publication types