

The composition and turnover of the Arabidopsis thaliana 80S cytosolic ribosome
- PMID: 32744327
- PMCID: PMC7452503
- DOI: 10.1042/BCJ20200385
The composition and turnover of the Arabidopsis thaliana 80S cytosolic ribosome
Abstract
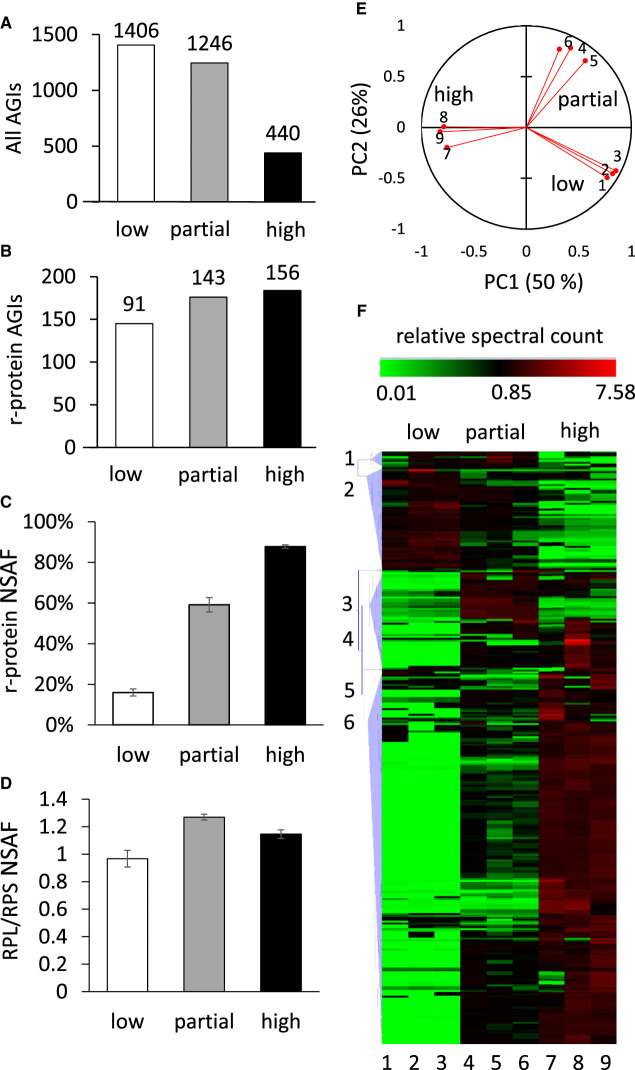
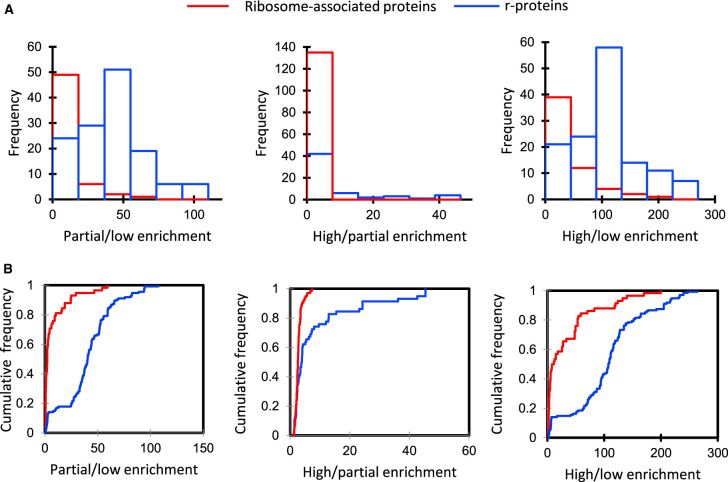
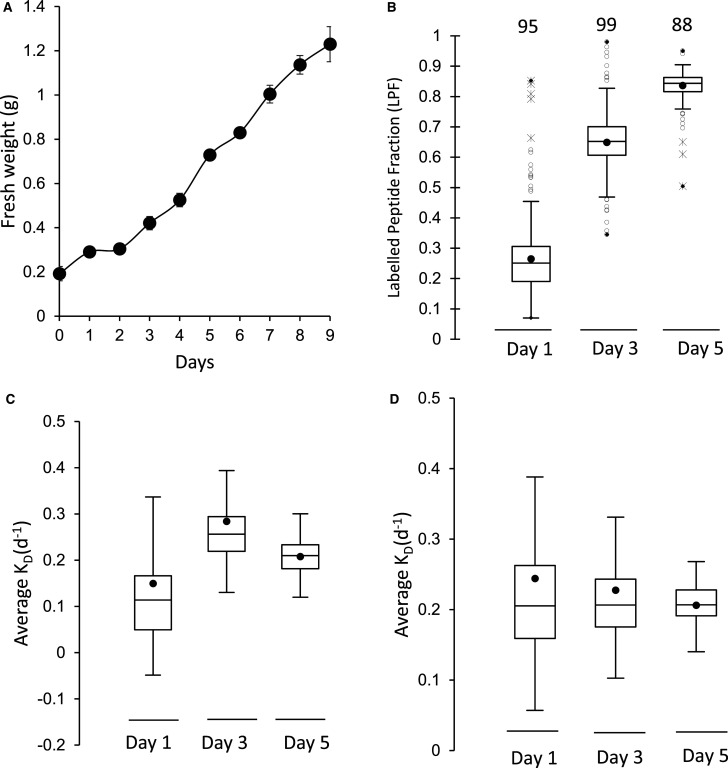
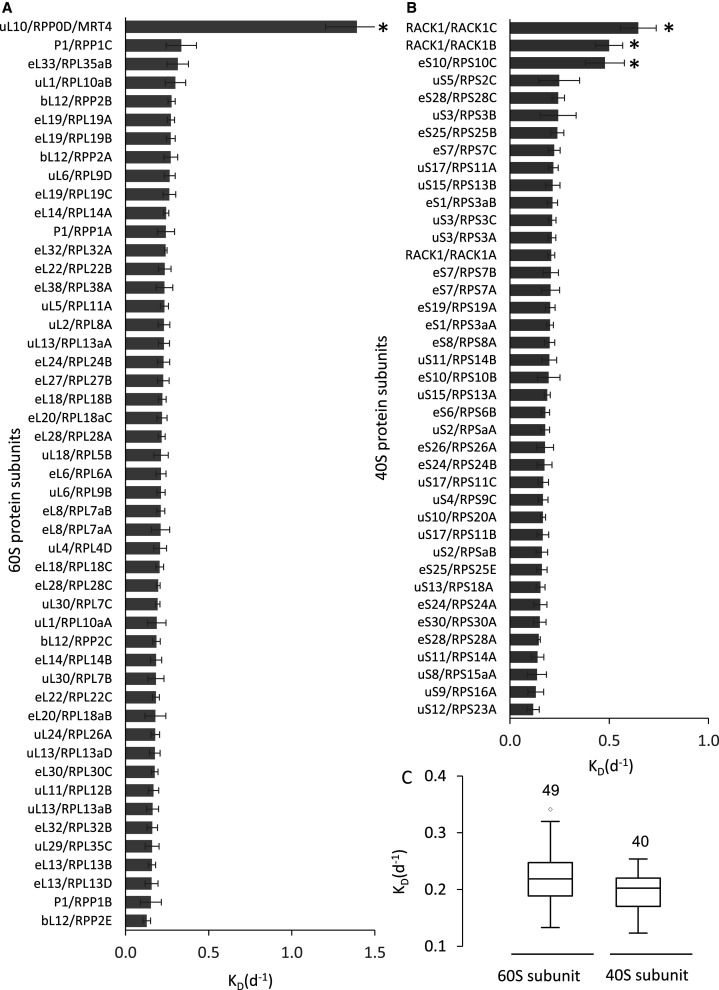
Cytosolic 80S ribosomes contain proteins of the mature cytosolic ribosome (r-proteins) as well as proteins with roles in ribosome biogenesis, protein folding or modification. Here, we refined the core r-protein composition in Arabidopsis thaliana by determining the abundance of different proteins during enrichment of ribosomes from cell cultures using peptide mass spectrometry. The turnover rates of 26 40S subunit r-proteins and 29 60S subunit r-proteins were also determined, showing that half of the ribosome population is replaced every 3-4 days. Three enriched proteins showed significantly shorter half-lives; a protein annotated as a ribosomal protein uL10 (RPP0D, At1g25260) with a half-life of 0.5 days and RACK1b and c with half-lives of 1-1.4 days. The At1g25260 protein is a homologue of the human Mrt4 protein, a trans-acting factor in the assembly of the pre-60S particle, while RACK1 has known regulatory roles in cell function beyond its role in the 40S subunit. Our experiments also identified 58 proteins that are not from r-protein families but co-purify with ribosomes and co-express with r-proteins; 26 were enriched more than 10-fold during ribosome enrichment. Some of these enriched proteins have known roles in translation, while others are newly proposed ribosome-associated factors in plants. This analysis provides an improved understanding of A. thaliana ribosome protein content, shows that most r-proteins turnover in unison in vivo, identifies a novel set of potential plant translatome components, and how protein turnover can help identify r-proteins involved in ribosome biogenesis or regulation in plants.
Keywords: Arabidopsis thaliana; proteomics; ribosomes.
© 2020 The Author(s).
Conflict of interest statement
The authors declare that there are no competing interests associated with the manuscript.
Figures
Comment on
-
A copper transcription factor, AfMac1, regulates both iron and copper homeostasis in the opportunistic fungal pathogen Aspergillus fumigatus.Biochem J. 2018 Sep 11;475(17):2831-2845. doi: 10.1042/BCJ20180399. Biochem J. 2018. PMID: 30072493
Similar articles
-
High heterogeneity within the ribosomal proteins of the Arabidopsis thaliana 80S ribosome.Plant Mol Biol. 2005 Mar;57(4):577-91. doi: 10.1007/s11103-005-0699-3. Plant Mol Biol. 2005. PMID: 15821981
-
Proteomic characterization of evolutionarily conserved and variable proteins of Arabidopsis cytosolic ribosomes.Plant Physiol. 2005 Mar;137(3):848-62. doi: 10.1104/pp.104.053637. Epub 2005 Feb 25. Plant Physiol. 2005. PMID: 15734919 Free PMC article.
-
The 60S associated ribosome biogenesis factor LSG1-2 is required for 40S maturation in Arabidopsis thaliana.Plant J. 2014 Dec;80(6):1043-56. doi: 10.1111/tpj.12703. Epub 2014 Nov 13. Plant J. 2014. PMID: 25319368
-
Structural analysis of ribosomal RACK1 and its role in translational control.Cell Signal. 2017 Jul;35:272-281. doi: 10.1016/j.cellsig.2017.01.026. Epub 2017 Feb 2. Cell Signal. 2017. PMID: 28161490 Review.
-
Plant-Specific Features of Ribosome Biogenesis.Trends Plant Sci. 2015 Nov;20(11):729-740. doi: 10.1016/j.tplants.2015.07.003. Epub 2015 Oct 11. Trends Plant Sci. 2015. PMID: 26459664 Review.
Cited by
-
Proteomic profile of the germinating seeds reveals enhanced seedling growth in Arabidopsis rpp1a mutant.Plant Mol Biol. 2023 Oct;113(1-3):105-120. doi: 10.1007/s11103-023-01378-w. Epub 2023 Oct 7. Plant Mol Biol. 2023. PMID: 37804450
-
Upon heat stress processing of ribosomal RNA precursors into mature rRNAs is compromised after cleavage at primary P site in Arabidopsis thaliana.RNA Biol. 2022;19(1):719-734. doi: 10.1080/15476286.2022.2071517. Epub 2021 Dec 31. RNA Biol. 2022. PMID: 35522061 Free PMC article.
-
Diurnal dynamics of the Arabidopsis rosette proteome and phosphoproteome.Plant Cell Environ. 2021 Mar;44(3):821-841. doi: 10.1111/pce.13969. Epub 2020 Dec 24. Plant Cell Environ. 2021. PMID: 33278033 Free PMC article.
-
Patterns of protein synthesis in the budding yeast cell cycle: variable or constant?Microb Cell. 2024 Aug 20;11:321-327. doi: 10.15698/mic2024.08.835. eCollection 2024. Microb Cell. 2024. PMID: 39188509 Free PMC article.
-
Membrane-Enriched Proteomics Link Ribosome Accumulation and Proteome Reprogramming With Cold Acclimation in Barley Root Meristems.Front Plant Sci. 2021 Apr 30;12:656683. doi: 10.3389/fpls.2021.656683. eCollection 2021. Front Plant Sci. 2021. PMID: 33995454 Free PMC article.
References
Publication types
MeSH terms
Substances
LinkOut - more resources
Full Text Sources
Molecular Biology Databases