. 2020 Aug 3:9:e54993.
doi: 10.7554/eLife.54993.

NuRD subunit CHD4 regulates super-enhancer accessibility in rhabdomyosarcoma and represents a general tumor dependency

Affiliations

NuRD subunit CHD4 regulates super-enhancer accessibility in rhabdomyosarcoma and represents a general tumor dependency

Joana G Marques et al. Elife. .

Abstract

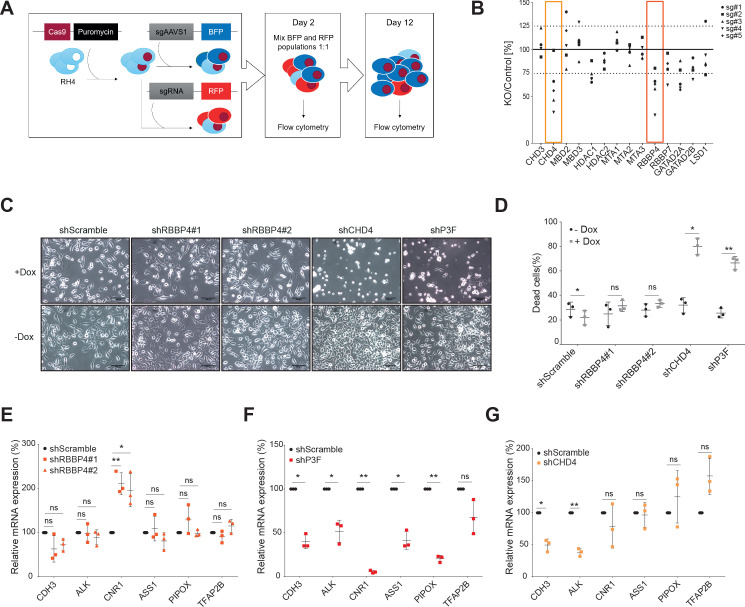
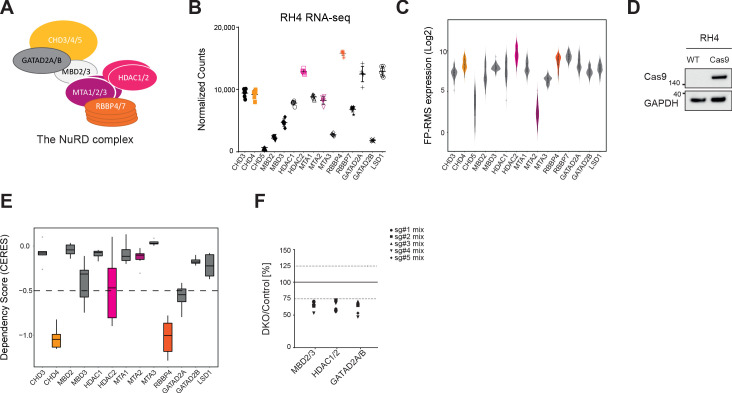
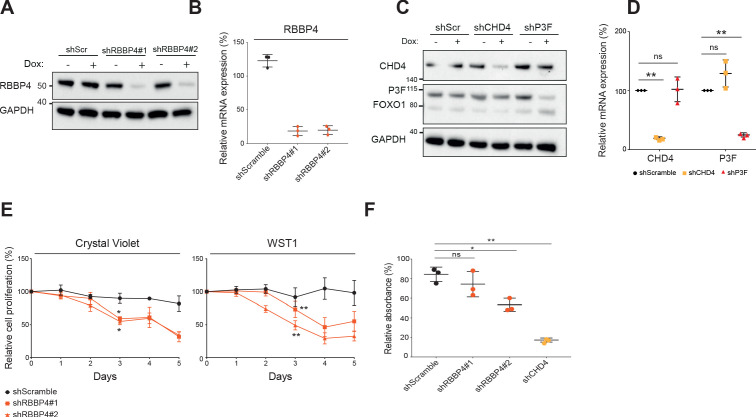
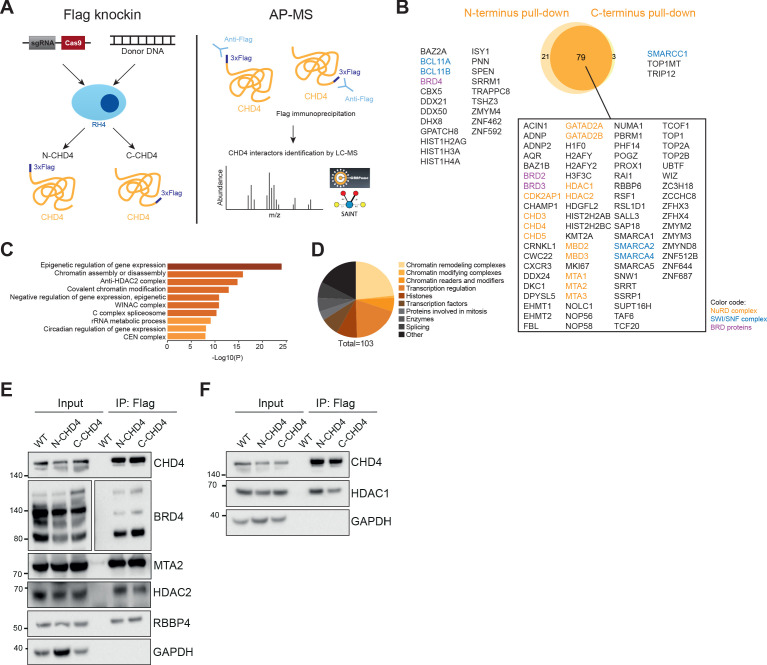
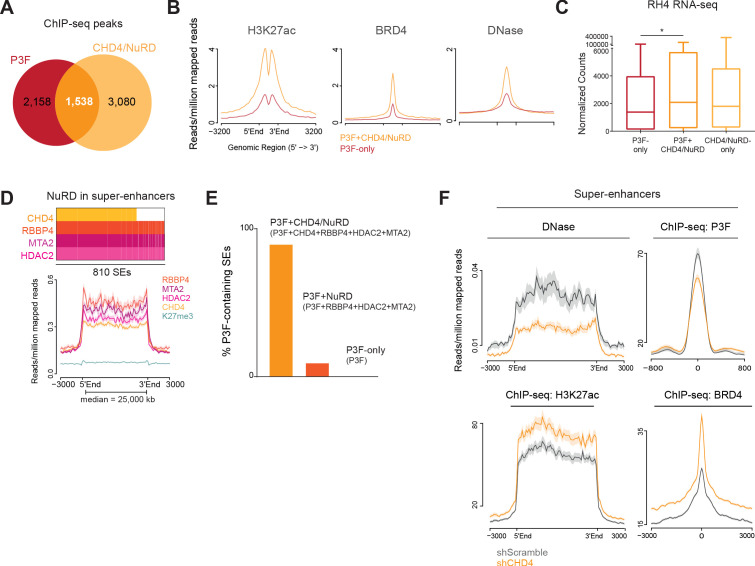
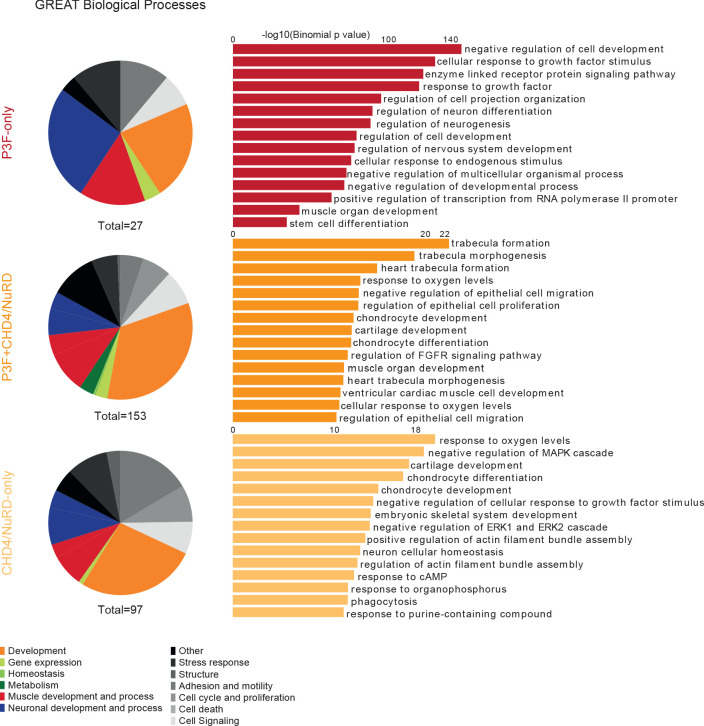
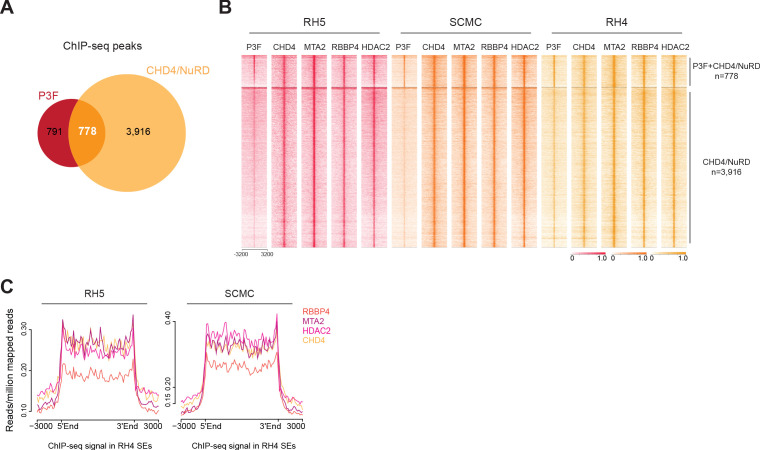
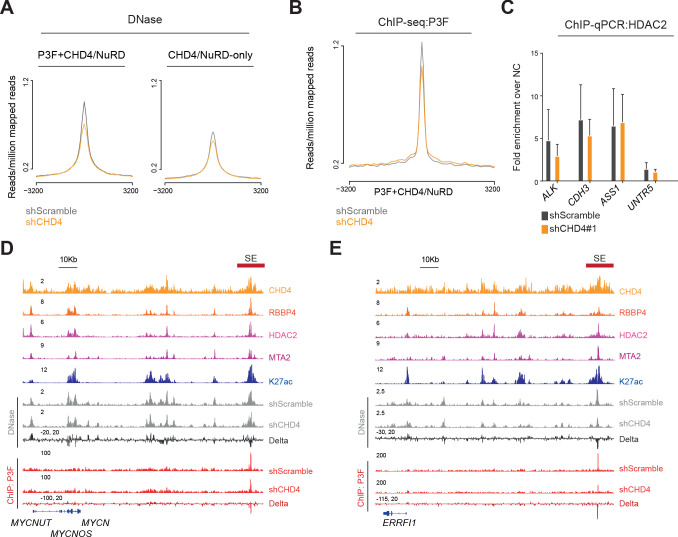
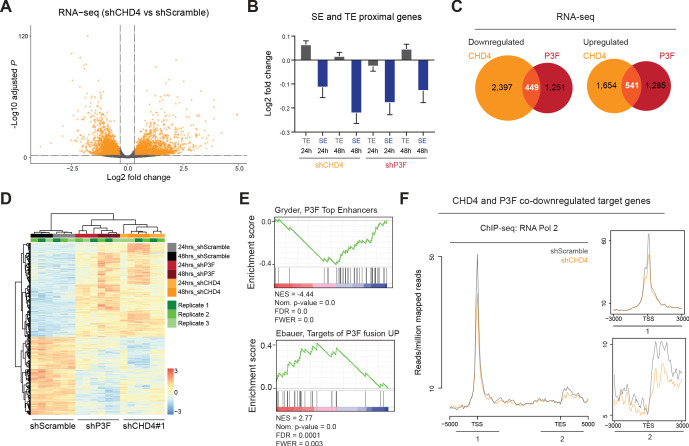
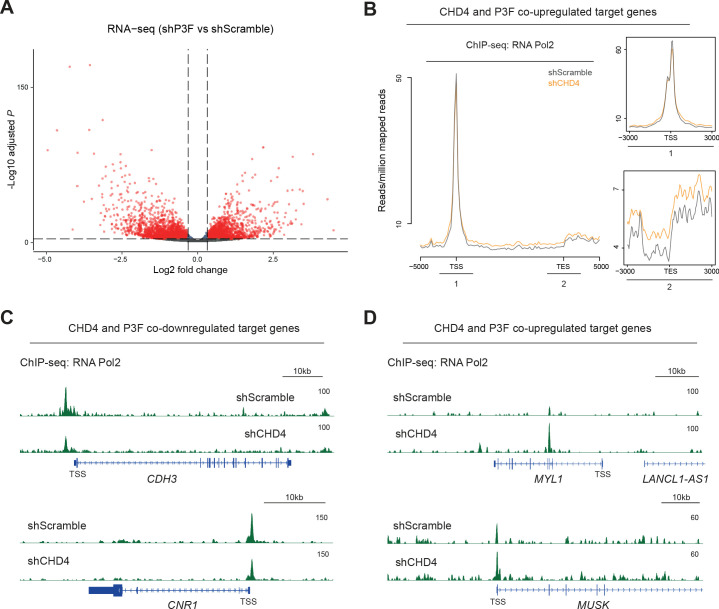
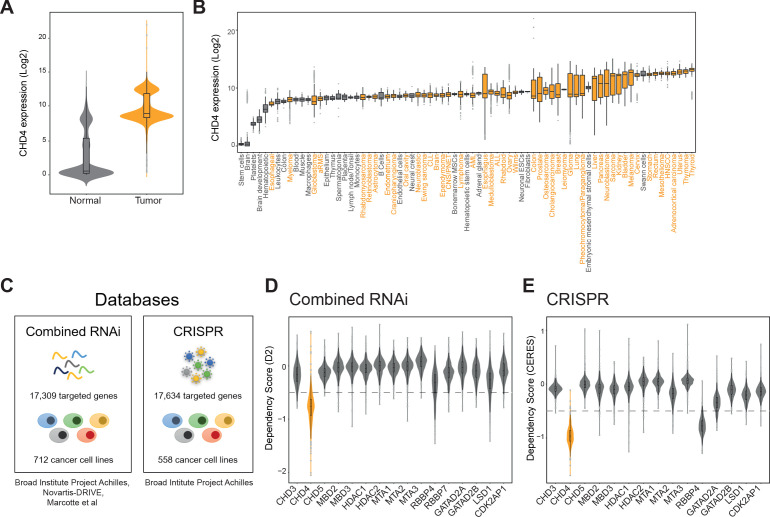
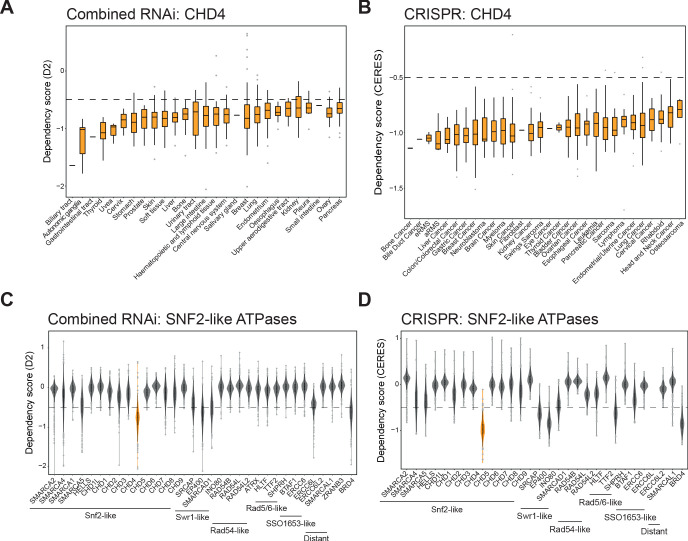
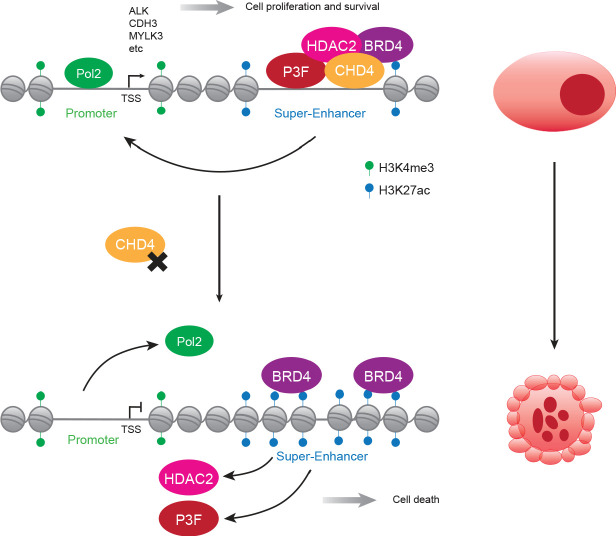
The NuRD complex subunit CHD4 is essential for fusion-positive rhabdomyosarcoma (FP-RMS) survival, but the mechanisms underlying this dependency are not understood. Here, a NuRD-specific CRISPR screen demonstrates that FP-RMS is particularly sensitive to CHD4 amongst the NuRD members. Mechanistically, NuRD complex containing CHD4 localizes to super-enhancers where CHD4 generates a chromatin architecture permissive for the binding of the tumor driver and fusion protein PAX3-FOXO1, allowing downstream transcription of its oncogenic program. Moreover, CHD4 depletion removes HDAC2 from the chromatin, leading to an increase and spread of histone acetylation, and prevents the positioning of RNA Polymerase 2 at promoters impeding transcription initiation. Strikingly, analysis of genome-wide cancer dependency databases identifies CHD4 as a general cancer vulnerability. Our findings describe CHD4, a classically defined repressor, as positive regulator of transcription and super-enhancer accessibility as well as establish this remodeler as an unexpected broad tumor susceptibility and promising drug target for cancer therapy.

Keywords: CHD4; DNA accessibility; NuRD; cancer biology; chromatin remodeling; human; rhabdomyosarcoma; super-enhancer.


Conflict of interest statement

JM, BG, BP, YC, QN, FF, MG, YS, KB, DL, MW, JK, BS No competing interests declared

Figures

Figure 1.
Figure 1.. CHD4, unlike RBBP4, causes FP-RMS tumor cell death.
(A) Illustrative scheme of the NuRD centered CRISPR/Cas9-based screen. Briefly, RH4 cells stably expressing Cas9 were transduced with lentiviral expression vectors containing either a BFP-labelled control sgRNA (sgAAVS1) or a RFP-la-belled sgRNA targeting a certain NuRD subunit. Two days after transduction, the blue and red populations were mixed 1:1 and their evolution was analyzed by flow cytometry at day 2 and 12 after transduction. (B) CRISPR/Cas9 screen results displayed as ratio between the indicated NuRD member knockout (KO) population and the control population (RFP/BFB ratio) at day 12 normalized to day 2. Each point represents the average of 3 biological replicates. Five sgRNAs were used per NuRD member. (C) Representative phase-contrast images of RH4 cells 5 days after doxycycline-mediated (Dox) RBBP4, CHD4, and PAX3-FOXO1 (P3F) depletion by shRNA. A scramble shRNA was used as negative control. Scale bar - 100μm. (D) Percentage of dead cells, measured by 7-AAD staining, observed in the same samples described in (C). Data are represented as mean ± SD (n=3; *p< 0.1, **p < 0.01, ***p < 0.001, ratio paired t test). (E, F and G) Expression levels (relative to GAPDH) of the indicated P3F target genes quantified by qPCR in RH4 cells at 48hrs upon RBBP4, P3F and CHD4 induced knockdown by doxycycline treatment. Data were normalized to untreated cells and are represented as mean ± SD (n=3; *p<0.1, **p < 0.01, ***p < 0.001, ratio paired t test).
Figure 1—figure supplement 1.
Figure 1—figure supplement 1.. The NuRD complex expression and function in FP-RMS.
(A) Representation of NuRD complex according to Bornelöv et al., 2018 and Torrado et al., 2017 (B) Expression levels, as normalized counts, of the displayed NuRD subunits (CHD4 in orange, HDAC2 in pink, MTA2 in dark pink, and RBBP4 in dark orange) obtained from RNA-seq data of RH4 cells expressing a tetracycline-inducible shRNA scramble construct at 24 and 48hrs of doxycycline treatment (n=3, see Materials and methods for details). (C) Violin plot depicting the expression levels of NuRD subunits in FP-RMS tumor tissue. Displayed are microarray data from three independent studies (Davicioni et al., 2006; Sun et al., 2015; Wachtel et al., 2004) available on the R2 gene expression database (r2.aml.nl). (D) Immunoblot depicting Cas9 expression in RH4-Cas9 cells. GAPDH was used as a loading control and wildtype RH4 cells (WT) served as negative control. (E) Box plot depicting the tumor dependency scores, calculated as CERES, of the indicated NuRD members in 6 FP-RMS cell lines (CRISPR Avana Public 19Q2, depmap.org). (F) Results of CRISPR/Cas9 double knockoutsdisplayed as ratio between the indicated NuRD members double knockout (DKO) population and the control population (sgAAVS1) at day 12 normalized to day 2. Each point represents the average of 3 biological replicates.
Figure 1—figure supplement 2.
Figure 1—figure supplement 2.. RBBP4 silencing reduces FP-RMS cell proliferation.
(A) Immunoblot confirms the knockdown of RBBP4 in RH4 cells by two shRNAs after 72hrs of shRNA expression induction by doxycycline (Dox). RH4 cells expressing a scramble shRNA (shScr) served as negative control and GAPDH as loading control. (B) RBBP4 expression levels (relative to GAPDH) quantified by qPCR in the same cells described in (A). Data were normalized to uninduced cells and are represented as mean ± SD (n=3). (C) Immunoblot confirms silencing of CHD4 and P3F after 48hrs of shRNA expression induction by doxycycline (Dox) in RH4 cells. GAPDH was used as a loading control and a scramble shRNA (shScr) served as negative control. (D) mRNA expression levels (relative to GAPDH), of the samples described in (C), quantified by qPCR and normalized to uninduced cells. Data are represented as mean ± SD (n=3, * p< 0.1, **p < 0.01; ***p < 0.001, ratio paired t test). (E) RH4 cell proliferation measured by crystal violet and WST1 assay at the indicated time points after silencing of RBBP4. Data were normalized to uninduced cells and are represented as mean ± SD (n=3; * p< 0.1, **p < 0.01, ***p < 0.001, ratio paired t test). (F) Cell proliferation measured by BrdU incorporation after 72hrs of RBBP4 or CHD4 knockdown. Data are represented as percentage of absorbance at 450nm normalized to uninduced control (n=3; * p<0.1, **p < 0.01, ***p < 0.001, ratio paired t test).
Figure 2.
Figure 2.. Mass spectrometry analysis of CHD4 interactome exposes interaction with the gene expression activator BRD4.
(A) Illustrative scheme of the affinity purification-mass spectrometry (AP-MS) studies performed to identify CHD4 interactors. CRISPR/Cas9-mediated repair was used to endogenously Flag tag CHD4 on RH4 cells at the N- and C-terminus, creating two new clonal cell lines (N-CHD4 and C-CHD4) (left). Endogenous CHD4 was immunoprecipitated from the N- and C-CHD4 cell lines using an anti-Flag antibody and interactors were identified by liquid chromatography-mass spectrometry (LC-MS)(right). (B) Overlap of CHD4 putative interactors identified in the Flag pull-downs of CHD4. (C) Top 10 gene ontology terms found enriched on CHD4 interactome by Metascape online tool. (D) Distribution of the putative CHD4 interactors according to their protein class. (E and F) Western blots of Flag immunoprecipitation assays (IP).
Figure 2—figure supplement 1.
Figure 2—figure supplement 1.. CRISPR/Cas9-mediated repair efficiently inserts a 3xFlag tag to endogenous CHD4 and BRD4.
(A, D and E) Immunoblot confirms the insertion of the 3xFlag tag at endogenous CHD4 (both N- and C-terminus) and BRD4 (N-terminus) in RH4 cells (Ab=antibody). GAPDH was used as a loading control and wildtype RH4 cells (WT) served as negative control. Arrows indicate BRD4 bands. (B) Representative immunofluorescence images show the expected nuclear localization of Flag tagged CHD4 and BRD4 in over 95% of the cells. DAPI was used to visualize the nucleus. Scale bar - 100μm. (C) Cell counts over six days of RH4 WT and N-CHD4 (top), C-CHD4 (middle), or N-BRD4 (bottom) cells. Data are represented as mean ± SD (n=3). (F-H) Western blots of Flag immunoprecipitation assays (IP).
Figure 3.
Figure 3.. NuRD localizes to active chromatin with distinct compositions at enhancers and promoters.
(A) Pearson correlation heatmap of DNase I hypersensitivity (DNase) and ChIP-seq signal of the indicated epigenetic factors and histone marks in RH4 cells. Datasets are ordered by unsupervised clustering. (B) Chromatin states and respective abundance of the depicted NuRD components per state. (C) Overlap of CHD4, RBBP4, MTA2, and HDAC2 ChIP-seq peaks. (D) Distribution of the peak counts for CHD4/NuRD and NuRD-only regions according to their distance to the transcription start sites (TSSs) and genome functional region. (E) Heatmap depicting the ChIP-seq signal of the indicated NuRD subunits, BRD4, histone marks (H3K9ac,H3K27ac, H3K4me1, and H3K4me3), RNA Polymerase 2 (Pol 2), and DNase I hypersensitivity signal at CHD4/NuRD (n=4,599) and NuRD-only regions (n=8,901). The rows show 8kb regions, centered on HDAC2 peaks and ranked by the ChIP-seq signal intensity of H3K27ac. Color shading corresponds to ChIP-seq read counts. (F) Density plots displaying the average ChIP-seq signal of H3K27ac, H3K4me1, BRD4, H3K4me3, RNA Polymerase 2, and DNase I hypersensitivity signal at CHD4/NuRD and NuRD-only locations. (G) Examples of gene tracks displaying the ChIP-seq signal of the indicated proteins, histone marks and DNase I hypersensitivity signal at a CHD4/NuRD enhancer (CREB5) and a NuRD-only promoter (TRIM33).
Figure 3—figure supplement 1.
Figure 3—figure supplement 1.. The NuRD complex localizes to similar enhancer locations in RH5 and SCMC cells as in RH4.
(A) Density plots and heatmaps depicting the ChIP-seq signal of the indicated NuRD subunits at CHD4/NuRD locations defined in RH4 cells (n=4,599). The rows show 8kb regions and color shading corresponds to ChIP-seq read counts. (B) Distribution of peak counts for CHD4/NuRD and NuRD-only locations in RH5 and SCMC cells according to their distance to transcription start sites (TSSs) and genome functional region.
Figure 3—figure supplement 2.
Figure 3—figure supplement 2.. The NuRD complex regulates distinct processes according to the presence or absence of CHD4.
(A) GREAT gene ontology analysis of the CHD4/NuRD and NuRD-only locations. Displayed are pie charts depicting the categories of biological processes (left) and the top 15 biological processes (right) found enriched for each set of locations. (B) Example of gene track where CHD4/NuRD is present at an enhancer in the vicinity of a gene (MYLK2) involved in the category muscle development.
Figure 4.
Figure 4.. CHD4 influences chromatin accessibility and allows P3F binding to SEs.
(A) Overlap between P3F and CHD4/NuRD ChIP-seq peaks. (B) Density plots depicting the average H3K27ac and BRD4 ChIP-seq as well as DNase I hypersensitivity (DNase) signal in RH4 cells at P3F+CHD4/NuRD (orange, n=1,538) and P3F-only locations (red, n=2,158). (C) Expression levels as normalized counts, obtained from RNA-seq data of RH4 cells, of the genes located nearest, within TADs, to P3F-only, P3F+CHD4/NuRD and CHD4/NuRD-only locations (one-way ANOVA; adjusted p-value=0.0411; *p< 0.1, **p < 0.01, ***p < 0.001). (D) Representative plot of the presence of the indicated NuRD subunits at the 810 super-enhancers (SEs) identified in RH4 cells (top). Density plot showing the average ChIP-seq signal of RBBP4, MTA2, HDAC2, CHD4, and H3K27me3 at SEs (bottom). (E) Distribution (in percentage) of P3F-bound SEs according to the presence of NuRD subunits. (F) Density plots depicting the average DNase I hypersensitivity signal, P3F, H3K27ac and BRD4 ChIP-seq signal in RH4 cells at SEs upon 48hrs of CHD4 knockdown (orange).
Figure 4—figure supplement 1.
Figure 4—figure supplement 1.. PAX3-FOXO1 regulates muscle-related processes with CHD4/NuRD.
GREAT gene ontology analysis of the P3F-only, P3F+CHD4/NuRD, and CHD4/NuRD-only regions defined in RH4 cells. Displayed are pie charts depicting the categories of biological processes (left) and the top 15 biological processes (right) found enriched for each set of regions.
Figure 4—figure supplement 2.
Figure 4—figure supplement 2.. CHD4/NuRD is present at SEs and co-localizes with a subset of P3F locations in RH5 and SCMC cells.
(A) Overlap between P3F and CHD4/NuRD ChIP-seq peaks found in at least 2 out of the 3 FP-RMS cell lines analyzed (RH4, RH5, and SCMC). (B) Heatmap depicting the ChIP-seq signal of P3F and the indicated NuRD subunits at CHD4/NuRD (n=3,916) and P3F+CHD4/NuRD regions (n=778). Color shading corresponds to ChIP-seq read counts. (C) Density plots showing the average ChIP-seq signal of RBBP4, MTA2, HDAC2, and CHD4 in RH5 and SCSMC cells at the 810 super-enhancers (SEs)identified in RH4 cells.
Figure 4—figure supplement 3.
Figure 4—figure supplement 3.. CHD4 depletion impairs P3F binding to enhancers and SEs.
(A) Density plots depicting the average DNase I hypersensitivity signal in RH4 cells at P3F+CHD4/NuRD and CHD4/NuRD-only locations upon 48hrs of CHD4 knockdown (orange). (B) Density plot depicting the average P3F ChIP-seq signal in RH4 cells at P3F+CHD4/NuRD locations upon 48hrs of CHD4 knockdown (orange). (C) ChIP-qPCR of HDAC2 at selected P3F-binding sites (ALK, CDH3 and ASS1) in RH4 cells upon 48hrs of CHD4 silencing (orange). Results are displayed as fold enrichment over negative control (NC, n=2). UNTR5 is a gene desert region. (D and E) Gene tracks showing CHD4/NuRD at SEs bound by P3F and in the vicinity of the MYCN and ERRFI1 genes. Also displayed are the changes in chromatin accessibility (DNase) and P3F ChIP-seq signal after 48hrs of CHD4 silencing by shRNA.
Figure 5.
Figure 5.. CHD4 regulates P3F- and SE-mediated gene expression as well as RNA Pol 2 binding to promoters.
(A) Volcano plot depicting changes in gene expression upon 48hrs of CHD4 silencing in RH4 cells (fold change≥ 25%, false discovery rate of 1%). (B) Changes in expression, as log2 fold change, of the nearest genes within TADs associated with typical enhancers and super-enhancers (TE and SE, respectively) in RH4 cells upon 24 or 48hrs of CHD4 or P3F silencing. Data are represented as mean ± SEM. (C) Overlap of CHD4 and P3F regulated genes identified by RNA-seq upon 48hrs of silencing. (D) Heatmap of unsupervised hierarchical clustering analysis depicting CHD4 and P3F co-regulated genes (n=990) in RH4 cells. (E) GSEA ontology analysis performed with the CHD4 and P3F co-regulated signature (n=990) as pre-ranked dataset. NES – normalized enrichment score, FDR – false discovery rate, FWER – family-wise error rate. (F) Density plots depicting the average RNA Pol 2 ChIP-seq signal upon 48hrs of CHD4 silencing (orange) at genes co-downregulated by P3F and CHD4 (n=449).
Figure 5—figure supplement 1.
Figure 5—figure supplement 1.. RNA Pol 2 positioning is affected by CHD4 silencing.
(A) Volcano plot depicting changes in gene expression after 48hrs of P3F silencing in RH4 cells (fold change≥ 25%, false discovery rate of 1%). (B) Density plots depicting the average RNA Pol 2 ChIP-seq signal upon 48hrs of CHD4 silencing (orange) at genes co-upregulated by P3F and CHD4 (n=541). (C and D) Gene tracks depicting changes in RNA Pol 2 binding after 48hrs of CHD4 silencing at promoters of genes co-down (C) or co-upregulated (D) by CHD4 and P3F.
Figure 6.
Figure 6.. CHD4 is essential for a broad range of tumors.
(A and B) Violin and boxplots depicting CHD4 expression levels (data: r2.aml.nl) in normal (grey) and tumor tissue (orange). (C) Databases used to evaluate tumor sensitivities to CHD4 silencing or knockout. (D and E) Violin plots showing the tumor dependency scores, calculated by D2 or CERES, of the indicated NuRD members. CHD4 is displayed in orange. The -0.5 threshold is depicted as a dashed line.
Figure 6—figure supplement 1.
Figure 6—figure supplement 1.. CHD4 depletion affects the viability of a variety of tumor types.
(A and B) Boxplots demonstrate the sensitivity, displayed as dependency scores D2 or CERES, of the indicated tumor types to CHD4 knockdown (Combined RNAi) or knockout (CRISPR). (C and D) Violin plots show the cancer dependency scores, calculated by D2 or CERES, for the indicated SNF2-like family members of chromatin remodelers and BRD4. CHD4 is displayed in orange.
Figure 7.
Figure 7.. Proposed model of CHD4-dependent and P3F-driven gene expression regulation.
In FP-RMS, CHD4/NuRD co-localizes with P3F and BRD4 at enhancers and super-enhancers enabling the expression of a subset of the fusion protein target genes and allowing tumor maintenance and survival (top). In the absence of CHD4, super-enhancers lose DNA accessibility and, consequentially, binding of P3F and HDAC2 which leads to a spread of H3K27ac, an increase in BRD4 binding and prevents the positioning of RNA Pol 2 to promoters (bottom). These changes of chromatin architecture result in a reduction of SE- and P3F-regulated gene expression contributing to tumor cell death.
Author response image 1.
Author response image 1.. Benzonase digestion of RH4 nuclear extracts used for AP-MS.

References

    1. Allen HF, Wade PA, Kutateladze TG. The NuRD architecture. Cellular and Molecular Life Sciences. 2013;70:3513–3524. doi: 10.1007/s00018-012-1256-2. - DOI - PMC - PubMed
    1. Becker PB, Workman JL. Nucleosome remodeling and epigenetics. Cold Spring Harbor Perspectives in Biology. 2013;5:a017905. doi: 10.1101/cshperspect.a017905. - DOI - PMC - PubMed
    1. Bernasconi M, Remppis A, Fredericks WJ, Rauscher FJ, Schäfer BW. Induction of apoptosis in Rhabdomyosarcoma cells through down-regulation of PAX proteins. PNAS. 1996;93:13164–13169. doi: 10.1073/pnas.93.23.13164. - DOI - PMC - PubMed
    1. Böhm M, Wachtel M, Marques JG, Streiff N, Laubscher D, Nanni P, Mamchaoui K, Santoro R, Schäfer BW. Helicase CHD4 is an epigenetic coregulator of PAX3-FOXO1 in alveolar Rhabdomyosarcoma. Journal of Clinical Investigation. 2016;126:4237–4249. doi: 10.1172/JCI85057. - DOI - PMC - PubMed
    1. Bornelöv S, Reynolds N, Xenophontos M, Gharbi S, Johnstone E, Floyd R, Ralser M, Signolet J, Loos R, Dietmann S, Bertone P, Hendrich B. The nucleosome remodeling and deacetylation complex modulates chromatin structure at sites of active transcription to Fine-Tune gene expression. Molecular Cell. 2018;71:56–72. doi: 10.1016/j.molcel.2018.06.003. - DOI - PMC - PubMed

Publication types

MeSH terms

Substances

Associated data