. 2020 Aug 3:9:e58659.
doi: 10.7554/eLife.58659.

A human ESC-based screen identifies a role for the translated lncRNA LINC00261 in pancreatic endocrine differentiation

Affiliations

A human ESC-based screen identifies a role for the translated lncRNA LINC00261 in pancreatic endocrine differentiation

Bjoern Gaertner et al. Elife. .

Abstract

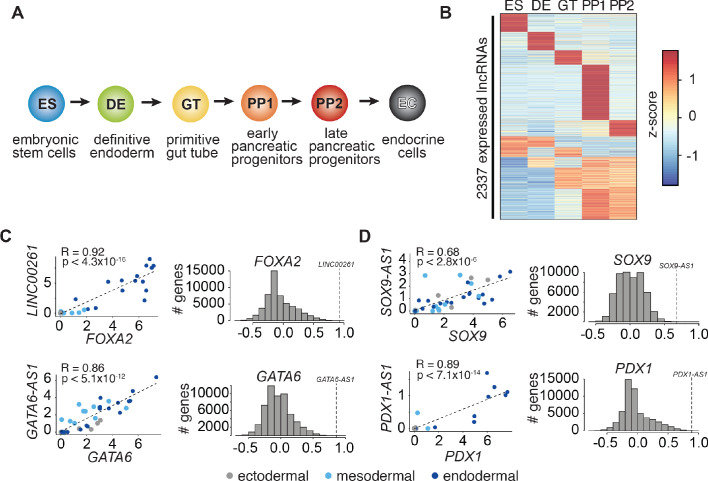
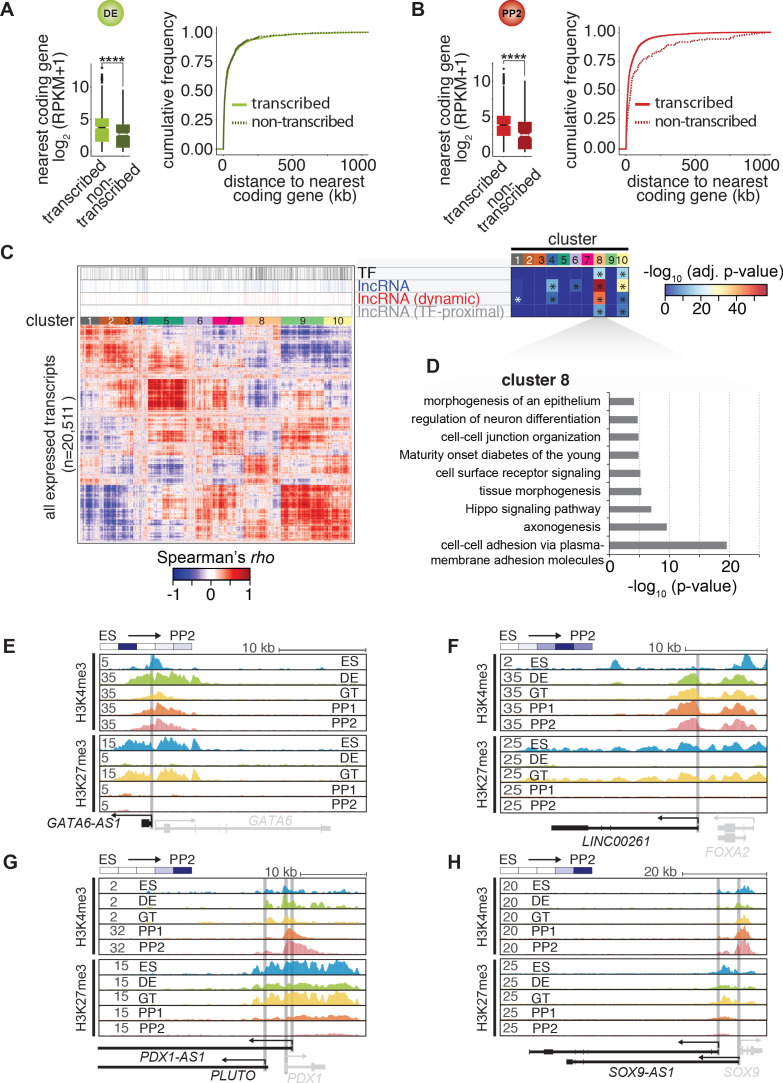
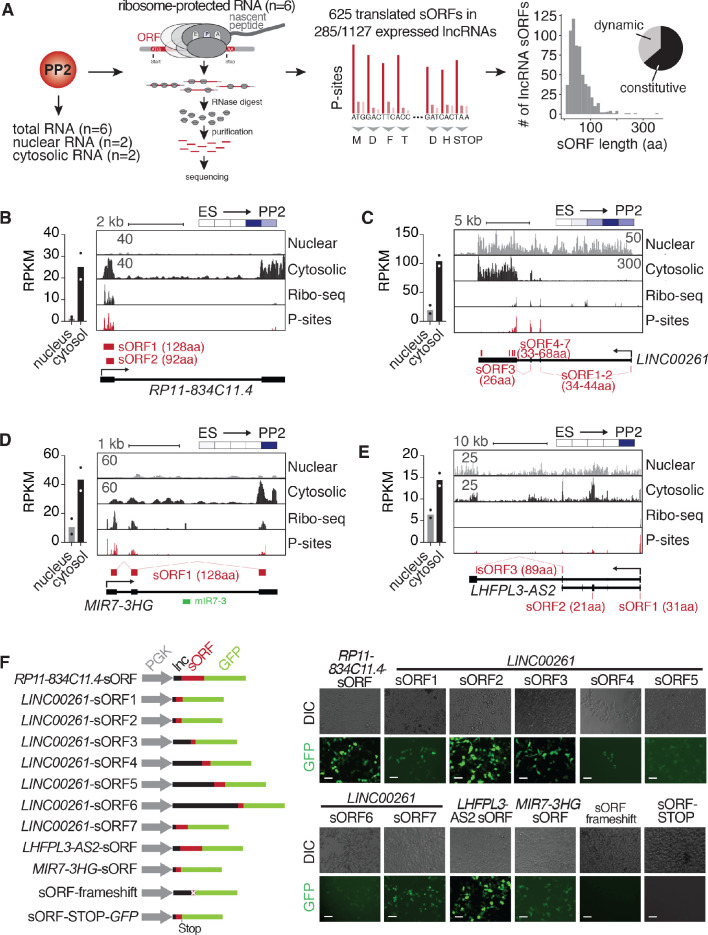
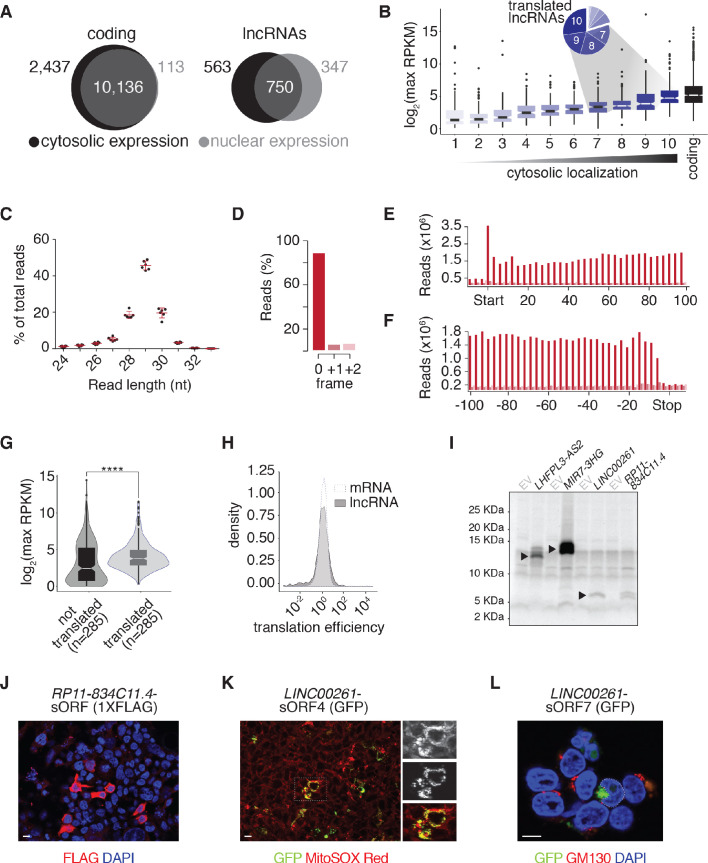
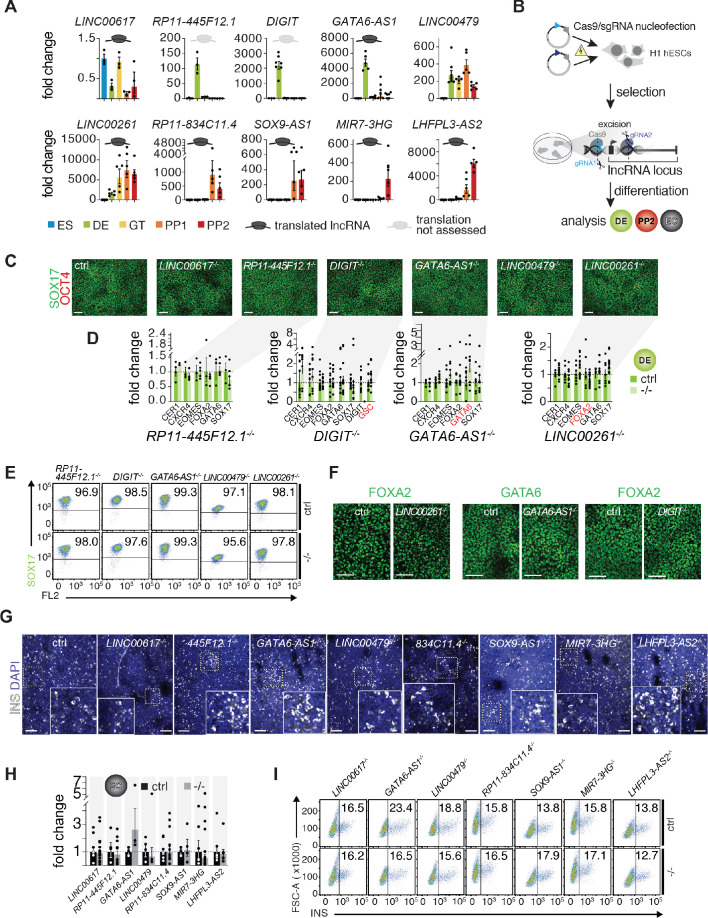
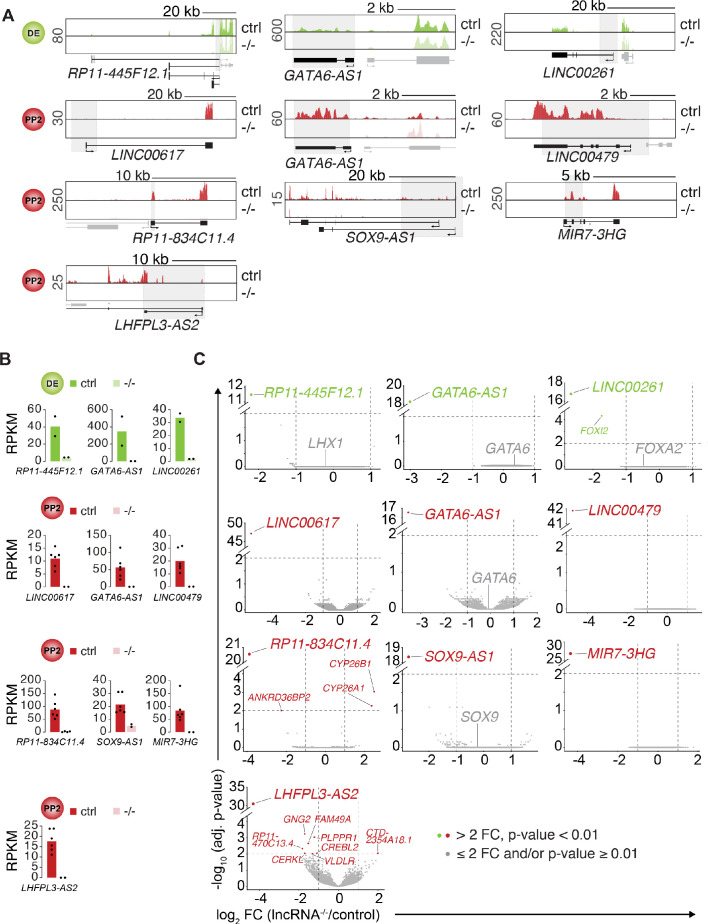
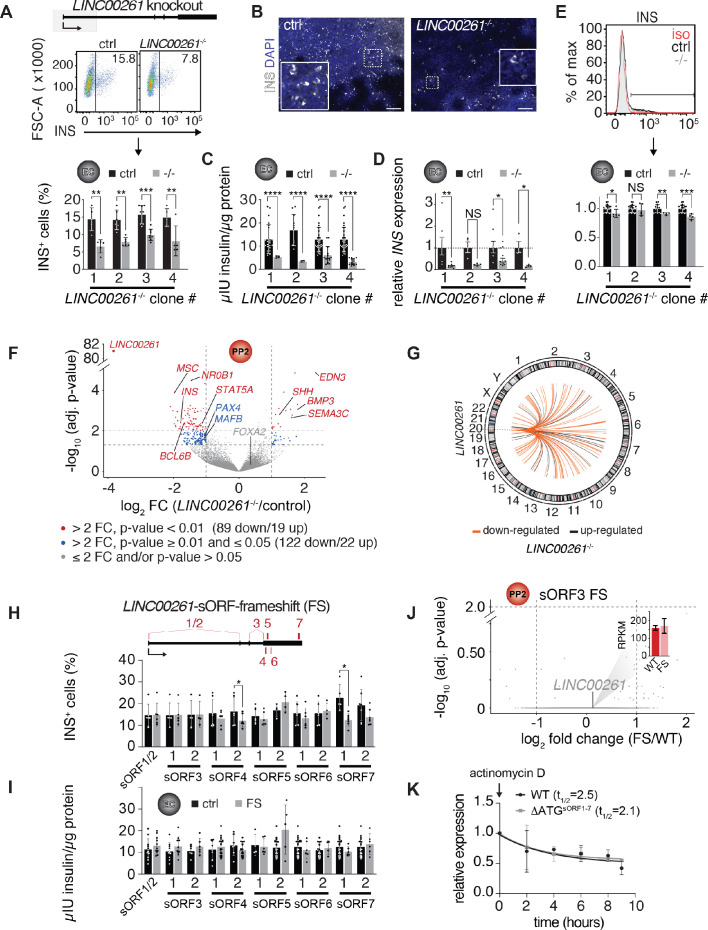
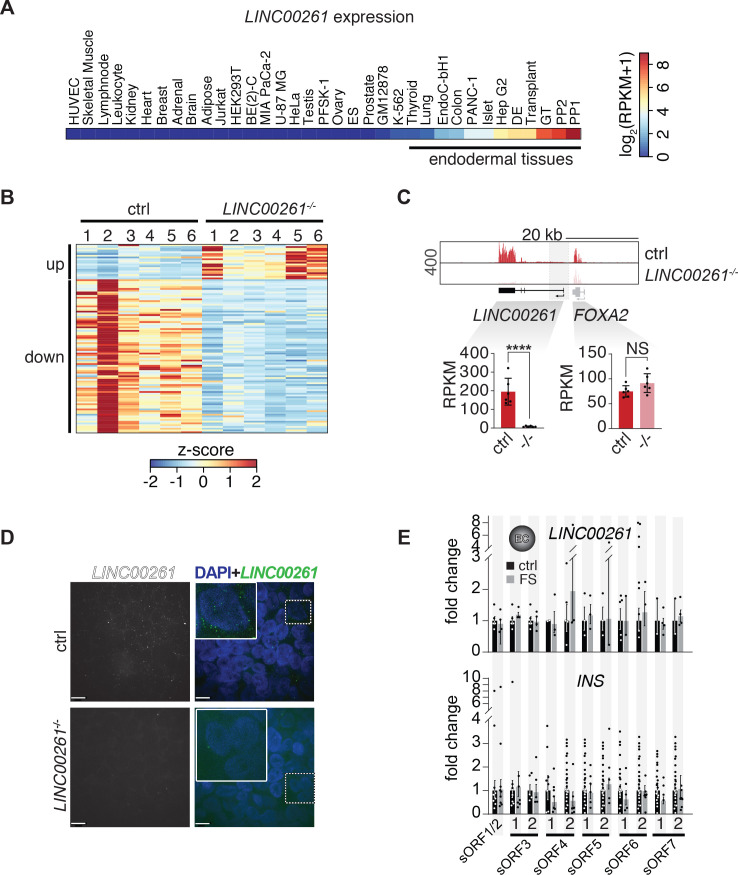
Long noncoding RNAs (lncRNAs) are a heterogenous group of RNAs, which can encode small proteins. The extent to which developmentally regulated lncRNAs are translated and whether the produced microproteins are relevant for human development is unknown. Using a human embryonic stem cell (hESC)-based pancreatic differentiation system, we show that many lncRNAs in direct vicinity of lineage-determining transcription factors (TFs) are dynamically regulated, predominantly cytosolic, and highly translated. We genetically ablated ten such lncRNAs, most of them translated, and found that nine are dispensable for pancreatic endocrine cell development. However, deletion of LINC00261 diminishes insulin+ cells, in a manner independent of the nearby TF FOXA2. One-by-one disruption of each of LINC00261's open reading frames suggests that the RNA, rather than the produced microproteins, is required for endocrine development. Our work highlights extensive translation of lncRNAs during hESC pancreatic differentiation and provides a blueprint for dissection of their coding and noncoding roles.

Keywords: ORF detection; computational biology; developmental biology; endocrine development; endoderm; human; lncRNA; microproteins; pancreas; systems biology.


Conflict of interest statement

BG, Sv, VS, JS, FW, SB, SN, RW, IM, NH, MS No competing interests declared

Figures

Figure 1.
Figure 1.. LncRNA expression and regulation during pancreatic differentiation.
(A) Stages of directed differentiation from human embryonic stem cell (hESCs) to hormone-producing endocrine cells. The color scheme for each stage is used across all figures. (B) K-means clustering of all lncRNAs expressed (RPKM ≥ 1) during pancreatic differentiation based on their expression z-score (mean of n = 2 independent differentiations per stage; from CyT49 hESCs). (C,D) Left: Scatterplots comparing the expression of early (C) and late (D) expressed endodermal transcription factors (TFs) with the expression of their neighboring lncRNAs across 38 tissues. The dot color indicates the germ layer of origin of these tissues. Pearson correlation coefficients and p-values (t-test) are displayed. Right: Distribution of the Pearson correlation coefficients for each TF with all Ensembl 87 genes across the same 38 tissues. Dashed lines denote the correlation for the neighboring lncRNA, which for all lncRNAs shown is higher than expected by chance. See also Figure 1—figure supplement 1 and Figure 1—source data 1.
Figure 1—figure supplement 1.
Figure 1—figure supplement 1.. Characterization of lncRNAs expressed during pancreatic differentiation.
(A,B) Left: Expression of the single nearest coding genes (±1000 kb) in cis to transcribed and non-transcribed lncRNAs at the DE stage (A) or PP2 stage (B). Log2 transformed mean expression values (RPKM + pseudocount) from two biological replicates were used to generate the box plots (****, p-value<0.0001, Wilcoxon rank sum test). Right: Corresponding cumulative distance distribution functions. (C) Heatmap of the hierarchically clustered expression correlations (Spearman’s rho) of all RNAs transcribed during pancreatic differentiation (with RPKM ≥ 1 in at least ten out of 38 tissues). Transcription factor (TF)-encoding mRNAs, lncRNAs (all), dynamically expressed lncRNAs (RPKM ≤ 1 in at least one stage (ESC to PP2)), and TF-proximal lncRNAs are highlighted above the heatmap. Clusters 8 and 10 are significantly enriched for all of these RNAs (*, p-value<0.03, Fisher test). (D) Gene ontology and KEGG pathway analysis for all coding genes in cluster 8 (p-value<0.05, Fisher test). The full list of significantly enriched terms is shown in Figure 1—source data 1C. (E–H) H3K4me3 and H3K27me3 ChIP-seq tracks of loci containing lncRNAs GATA6-AS1 (A), LINC00261 (B), PDX1-AS1/PLUTO (C), or SOX9-AS1 (D) during pancreatic differentiation of CyT49 hESCs.
Figure 2.
Figure 2.. Cytosolic lncRNAs contain translated small open reading frames.
(A) Overview of experimental strategy for subcellular fractionation and Ribo-seq-based identification of translated small open reading frames (sORFs) from lncRNAs expressed in PP2 cells. Replicates from six independent differentiations to PP2 stage each for total (polyA) RNA-seq and Ribo-seq experiments, and two biological replicates for the subcellular fractionation were analyzed. The histogram on the far right depicts the size distribution of the sORF-encoded small peptides as number of amino acids (aa). The pie chart summarizes the percentages of constitutively and dynamically expressed sORF-encoding lncRNAs during pancreatic differentiation of CyT49 hESCs. (B–E) Left: Bar graphs showing nuclear and cytosolic expression (in RPKM) of lncRNAs RP11-834C11.4 (B), LINC00261 (C), MIR7-3HG (D), and LHFPL3-AS2 (E). Data are shown as mean, with individual data points represented by dots (n = 2 biological replicates). Right: Subcellular fractionation RNA-seq, Ribo-seq, and P-site tracks (ribosomal P-sites inferred from ribosome footprints on ribosome-protected RNA) for loci of the depicted lncRNAs. Identified highest stringency sORFs (ORF in 6/6 replicates) are shown in red. For LINC00261, visually identified sORFs 1 and 2 are also shown. Heatmaps in the top right visualize the relative expression of the shown lncRNAs during pancreatic differentiation (means of two biological replicates per stage), on a minimum (white)/maximum (dark blue) scale. (F) In vivo translation reporter assays testing whether sORFs computationally defined in (A) give rise to translation products in HEK293T cells when fused in-frame to a GFP reporter. Left: Schematic of the constructs (gray: PGK promoter, black: lncRNA sequence 5’ to sORF to be tested, red: sORF, green: GFP ORF). Right: Representative DIC and GFP images of HEK293T cells transiently transfected with the indicated reporter constructs. Scale bars = 50 µm. See also Figure 2—figure supplement 1 and Figure 2—source data 1.
Figure 2—figure supplement 1.
Figure 2—figure supplement 1.. Cytosolic lncRNAs engage with ribosomes.
(A) Venn diagrams showing the number of coding RNAs (left) and lncRNAs (right) with RPKM ≥ 1 across two biological replicates in cytosolic and nuclear fractions. (B) Box plots of maximum lncRNA expression (RPKM + pseudocount) across 38 tissues binned by their degree of cytosolic localization (measured as nuclear/cytosolic lncRNA expression ratio deciles in PP2); the expression of all PP2-transcribed coding RNAs with dynamic expression during differentiation is included for reference. The pie chart summarizes the proportions of translated lncRNAs within each cytoplasmic localization decile. (C) Read length distribution (nt) of Ribo-seq fragments across replicate Ribo-seq experiments (n = 6 biological replicates). (D) Position of the inferred P-sites of the ribosome footprints relative to the reading frame of PP2-transcribed coding genes. (E–F) Coverage of 29 nt footprint P-sites around the start codons (E) or stop codons (F) of PP2-transcribed coding genes. (G) Box plots comparing maximum expression of translated and untranslated lncRNAs (RPKM + pseudocount) across 38 tissues (****, p-value=2.122×10⁻⁸, Wilcoxon rank sum test). For the untranslated set, 285 untranslated PP2-expressed lncRNAs were selected randomly. (H) Density plots comparing the translation efficiencies of PP2-expressed mRNAs and lncRNAs. (I) Autoradiograph of radiolabeled in vitro translation products derived from full-length LHFPL3-AS2, MIR7-3HG, LINC00261, and RP11-834C11.4. EV, empty vector. (J) Anti-FLAG immunofluorescence staining of HEK293T cells transiently transfected with a PGK-RP11-834C11.4-sORF-1xFLAG construct. (K) Microphotograph of HEK293T cells transiently transfected with a PGK-LINC00261-sORF4-GFP construct with mitochondria labeled by MitoSOX Red. (L) Golgi immunofluorescence staining (anti-GM130) of HEK293T cells transiently transfected with a PGK-LINC00261-sORF7-GFP construct. Scale bars = 10 µm.
Figure 3.
Figure 3.. A small-scale CRISPR loss-of-function screen for dynamically expressed and translated lncRNAs during pancreatic differentiation.
(A) qRT-PCR analysis of candidate lncRNAs during pancreatic differentiation of H1 hESCs relative to the ES stage. Data are shown as mean ± S.E.M. (mean of n = 2–6 independent differentiations per stage; from H1 hESCs). Individual data points are represented by dots. See also Figure 3—source data 2. (B) CRISPR-based lncRNA knockout (KO) strategy in H1 hESCs and subsequent phenotypic characterization. (C) Immunofluorescence staining for OCT4 and SOX17 in DE from control (ctrl) and KO cells for the indicated lncRNAs (representative images, n ≥ 3 independent differentiations; at least two KO clones were analyzed). (D) qRT-PCR analysis of DE lineage markers in DE from control and lncRNA KO (-/-) cells. TF genes in cis to the lncRNA locus are highlighted in red. Data are shown as mean ± S.E.M. (n = 3–16 replicates from independent differentiations and different KO clones). Individual data points are represented by dots. NS, p-value>0.05; t-test. See also Figure 3—source data 3. (E) Flow cytometry analysis at DE stage for SOX17 in control and KO (-/-) cells for indicated lncRNAs. The line demarks isotype control. Percentage of cells expressing SOX17 is indicated (representative experiment, n ≥ 3 independent differentiations from at least two KO clones). (F) Immunofluorescence staining for FOXA2 or GATA6 in DE from control and LINC00261, GATA6-AS1, and DIGIT KO cells. (G) Immunofluorescence staining for insulin (INS) in endocrine cell stage (EC) from control and KO hESCs for the indicated lncRNAs (representative images, n ≥ 3 independent differentiations from at least two KO clones). Boxed areas (dashed boxes) are shown in higher magnification. (H) qRT-PCR analysis of INS in EC stage cultures from control and lncRNA KO (-/-) hESCs. Data are shown as mean ± S.E.M. (n ≥ 4 replicates from independent differentiations of at least two KO clones). Individual data points are represented by dots. NS, p-value>0.05; t-test. See also Figure 3—source data 4 (I) Flow cytometry analysis at EC stage for INS in control and KO (-/-) cells for indicated lncRNAs. The line demarks isotype control. Percentage of cells expressing insulin is indicated (representative experiment, n ≥ 3 independent differentiations each from at least two KO clones). Scale bars = 100 µm. See also Figure 3—figure supplement 1 and Figure 3—source data 1–4.
Figure 3—figure supplement 1.
Figure 3—figure supplement 1.. Minor gene expression changes in definitive endoderm or pancreatic progenitor cells after lncRNA deletion.
(A) Genome Browser snap shots of RNA-seq signal at the indicated lncRNA loci in control (ctrl) and lncRNA knockout (KO; -/-) DE (green tracks) and PP2 (red tracks) stage cells. Genomic deletions are indicated by gray boxes. (B) Bar graphs showing expression of indicated lncRNAs in control and lncRNA KO DE (green) and PP2 (red) cells quantified by RNA-seq. Data are shown as mean RPKM (n = 2–6 independent differentiations of two independent KO clones, except for SOX9-AS1 for which one clone was differentiated twice). Individual data points are represented by dots. (C) Volcano plots displaying gene expression changes in control versus lncRNA KO DE (green) or PP2 (red) cells. Differentially expressed genes (DESeq2; >2 fold change (FC), adjusted p-value<0.01; vertical and horizontal dashed lines indicate the thresholds; n = 2 independent differentiations of two independent KO clones, except for SOX9-AS1 for which one clone was differentiated twice) are shown in green (DE) and red (PP2). TF genes in cis to deleted lncRNAs are shown in gray (gray dots represent genes with ≤ 2 fold change and/or adjusted p-value≥0.01).
Figure 4.
Figure 4.. LINC00261 deletion impedes pancreatic endocrine cell differentiation.
(A) Flow cytometry analysis at endocrine cell stage (EC) for insulin (INS) in control (ctrl) and LINC000261-/- H1 hESCs. Top panel: Schematic of the LINC00261 locus. The dashed box represents the genomic deletion. Middle panel: The line demarks isotype control. Percentage of cells expressing INS is indicated (representative experiment, n = 4 deletion clones generated with independent sgRNAs). Bottom panel: Bar graph showing percentages of INS-positive cells. Data are shown as mean ± S.D. (n = 5 (clone 1), n = 6 (clone 2), n = 8 (clone 3), n = 5 (clone 4) independent differentiations). Individual data points are represented by dots. (B) Immunofluorescence staining for INS in EC stage cultures from control and LINC000261-/- hESCs (representative images, number of differentiations see A). Boxed areas (dashed boxes) are shown in higher magnification. (C) ELISA for INS in EC stage cultures from control and LINC00261-/- hESCs. Data are shown as mean ± S.D. (n = 3 (clone 1), n = 2 (clone 2), n = 14 (clone 3), n = 13 (clone 4) independent differentiations). Individual data points are represented by dots. (D) qRT-PCR analysis of INS in EC stage cultures from control and LINC00261-/- hESCs. Data are shown as mean ± S.E.M. (n = 8 (clone 1), n = 4 (clone 2), n = 10 (clone 3), n = 3 (clone 4) independent differentiations). Individual data points are represented by dots. (E) Quantification of median fluorescence intensity after INS staining of control and LINC00261-/- EC stage cultures. Data are shown as mean ± S.D. (n = 5 (clone 1), n = 5 (clone 2), n = 4 (clone 3), n = 4 (clone 4) independent differentiations). iso, isotype control. Individual data points are represented by dots. (F) Volcano plot displaying gene expression changes in control versus LINC00261-/- PP2 cells (n = 6 independent differentiations from all four deletion clones). Differentially expressed genes are shown in red (DESeq2;>2 fold change (FC), adjusted p-value<0.01) and blue (>2 fold change, adjusted p-value≥0.01 and≤0.05). Thresholds are represented by vertical and horizontal dashed lines. FOXA2 in cis to LINC00261 is shown in gray (gray dots represent genes with ≤ 2 fold change and/or adjusted p-value>0.05). (G) Circos plot visualizing the chromosomal locations of the 108 genes differentially expressed (DESeq2;>2 fold change (FC), adjusted p-value<0.01) in LINC00261-/- compared to control PP2 cells, relative to LINC00261 on chromosome 20. No chromosome was over- or underrepresented (Fisher test, p-value>0.05 for all chromosomes). (H) Top panel: Schematic of the LINC00261 locus, with the location of its sORFs (1 to 7) marked by vertical red bars. Bottom panel: Flow cytometric quantification of INS-positive cells in control and LINC00261-sORF-frameshift (FS) at the EC stage. Data are shown as mean ± S.D. (n = 4–7 independent differentiations per clone). (I) ELISA for INS in EC stage cultures from control and LINC00261-sORF-FS hESCs. Data are shown as mean ± S.D. (n = 3–7 independent differentiations per clone). (J) Volcano plot displaying gene expression changes in control versus LINC00261-sORF3-FS PP2 cells. No gene was differentially expressed (DESeq2;>2 fold change, adjusted p-value<0.01; indicated by dashed horizontal and vertical lines; n = 2 independent differentiations). LINC00261 is shown in gray, the bar graph insert displays LINC00261 RPKM values in control and LINC00261-sORF3-FS PP2 cells. (K) LINC00261 half-life measurements in HEK293T cells transduced with lentivirus expressing either wild type (WT) LINC00261 or ΔATGsORF1-7 LINC00261 (mutant in which the ATG start codons of sORFs 1–7 were changed to non-start codons). HEK293T were treated with the transcription inhibitor actinomycin D and RNA isolated at 0, 2, 4, 6, 8, and 9 hr post actinomycin D addition. LINC00261 expression was analyzed by qRT-PCR relative to the TBP gene. Data are shown as mean ± S.E.M. (n = 3 biological replicates for each assay time point). *, p-value<0.05; **, p-value<0.01; ***, p-value<0.001; ****, p-value<0.0001; NS, p-value>0.05; t-test. Scale bars = 100 µm. See also Figure 4—figure supplement 1 and Figure 4—source data 1–3.
Figure 4—figure supplement 1.
Figure 4—figure supplement 1.. Characterization of LINC00261-deleted pancreatic progenitor cells.
(A) RNA-seq expression heatmap of LINC00261 across 35 cell types/tissues originating from all three germ layers (shown as RPKM + pseudocount). (B) Heatmap showing K-means clustering of 108 differentially expressed genes (DESeq2;>2 fold change (FC), adjusted p-value<0.01) between PP2 cells from control and LINC00261-/- H1 hESCs (based on expression z-score; n = 6 independent differentiations). (C) Top: Genome Browser snap shot of RNA-seq signal at the LINC00261/FOXA2 locus in control and LINC00261-/- PP2 stage cells. Genomic deletions are indicated by gray boxes. Bottom: Bar graphs showing LINC00261 and FOXA2 expression in control and LINC00261-/- PP2 cells quantified by RNA-seq. Data are shown as mean RPKM ± S.D. (n = 6 independent differentiations of four independent KO clones). ****, p-value<0.0001; NS, p-value>0.05; t-test. (D) LINC00261 smRNA FISH in control and LINC00261-/- PP2 cells. Scale bars = 8 µm. Boxed areas (dashed boxes) are shown in higher magnification. (E) qRT-PCR analysis of LINC00261 (top) and INS (bottom) expression in control and LINC00261-sORF-FS H1 hESC clones at the endocrine cell (EC) stage. Data are shown as mean ± S.E.M. (n ≥ 3 independent differentiations for each clone). Individual data points are represented by dots.

References

    1. Aguet F, Barbeira AN, Bonazzola R, Brown A, Castel SE, Jo B, Kasela S, Kim-Hellmuth S, Liang Y, Oliva M, Parsana PE, Flynn E, Fresard L, Gaamzon ER, Hamel AR, He Y, Hormozdiari F, Mohammadi P, Muñoz-Aguirre M, Park Y, Saha A, Segrć AV, Strober BJ, Wen X, Wucher V, Das S, Garrido-Martín D, Gay NR, Handsaker RE, Hoffman PJ, Kashin S, Kwong A, Li X, MacArthur D, Rouhana JM, Stephens M, Todres E, Viñuela A, Wang G, Zou Y, Brown CD, Cox N, Dermitzakis E, Engelhardt BE, Getz G, Guigo R, Montgomery SB, Stranger BE, Im HK, Battle A, Ardlie KG, Lappalainen T. The GTEx consortium atlas of genetic regulatory effects across human tissues. bioRxiv. 2019 doi: 10.1101/787903. - DOI - PMC - PubMed
    1. Amaral PP, Leonardi T, Han N, Viré E, Gascoigne DK, Arias-Carrasco R, Büscher M, Pandolfini L, Zhang A, Pluchino S, Maracaja-Coutinho V, Nakaya HI, Hemberg M, Shiekhattar R, Enright AJ, Kouzarides T. Genomic positional conservation identifies topological anchor point RNAs linked to developmental loci. Genome Biology. 2018;19:32. doi: 10.1186/s13059-018-1405-5. - DOI - PMC - PubMed
    1. Anders S, Pyl PT, Huber W. HTSeq--a Python framework to work with high-throughput sequencing data. Bioinformatics. 2015;31:166–169. doi: 10.1093/bioinformatics/btu638. - DOI - PMC - PubMed
    1. Arnes L, Akerman I, Balderes DA, Ferrer J, Sussel L. ??linc1 encodes a long noncoding RNA that regulates islet β-cell formation and function. Genes & Development. 2016;30:502–507. doi: 10.1101/gad.273821.115. - DOI - PMC - PubMed
    1. Artner I, Blanchi B, Raum JC, Guo M, Kaneko T, Cordes S, Sieweke M, Stein R. MafB is required for islet beta cell maturation. PNAS. 2007;104:3853–3858. doi: 10.1073/pnas.0700013104. - DOI - PMC - PubMed

Publication types