

Trends in Emergency Department Visits and Hospital Admissions in Health Care Systems in 5 States in the First Months of the COVID-19 Pandemic in the US
- PMID: 32744612
- PMCID: PMC7400214
- DOI: 10.1001/jamainternmed.2020.3288
Trends in Emergency Department Visits and Hospital Admissions in Health Care Systems in 5 States in the First Months of the COVID-19 Pandemic in the US
Abstract
Importance: As coronavirus disease 2019 (COVID-19) spread throughout the US in the early months of 2020, acute care delivery changed to accommodate an influx of patients with a highly contagious infection about which little was known.
Objective: To examine trends in emergency department (ED) visits and visits that led to hospitalizations covering a 4-month period leading up to and during the COVID-19 outbreak in the US.
Design, setting, and participants: This retrospective, observational, cross-sectional study of 24 EDs in 5 large health care systems in Colorado (n = 4), Connecticut (n = 5), Massachusetts (n = 5), New York (n = 5), and North Carolina (n = 5) examined daily ED visit and hospital admission rates from January 1 to April 30, 2020, in relation to national and the 5 states' COVID-19 case counts.
Exposures: Time (day) as a continuous variable.
Main outcomes and measures: Daily counts of ED visits, hospital admissions, and COVID-19 cases.
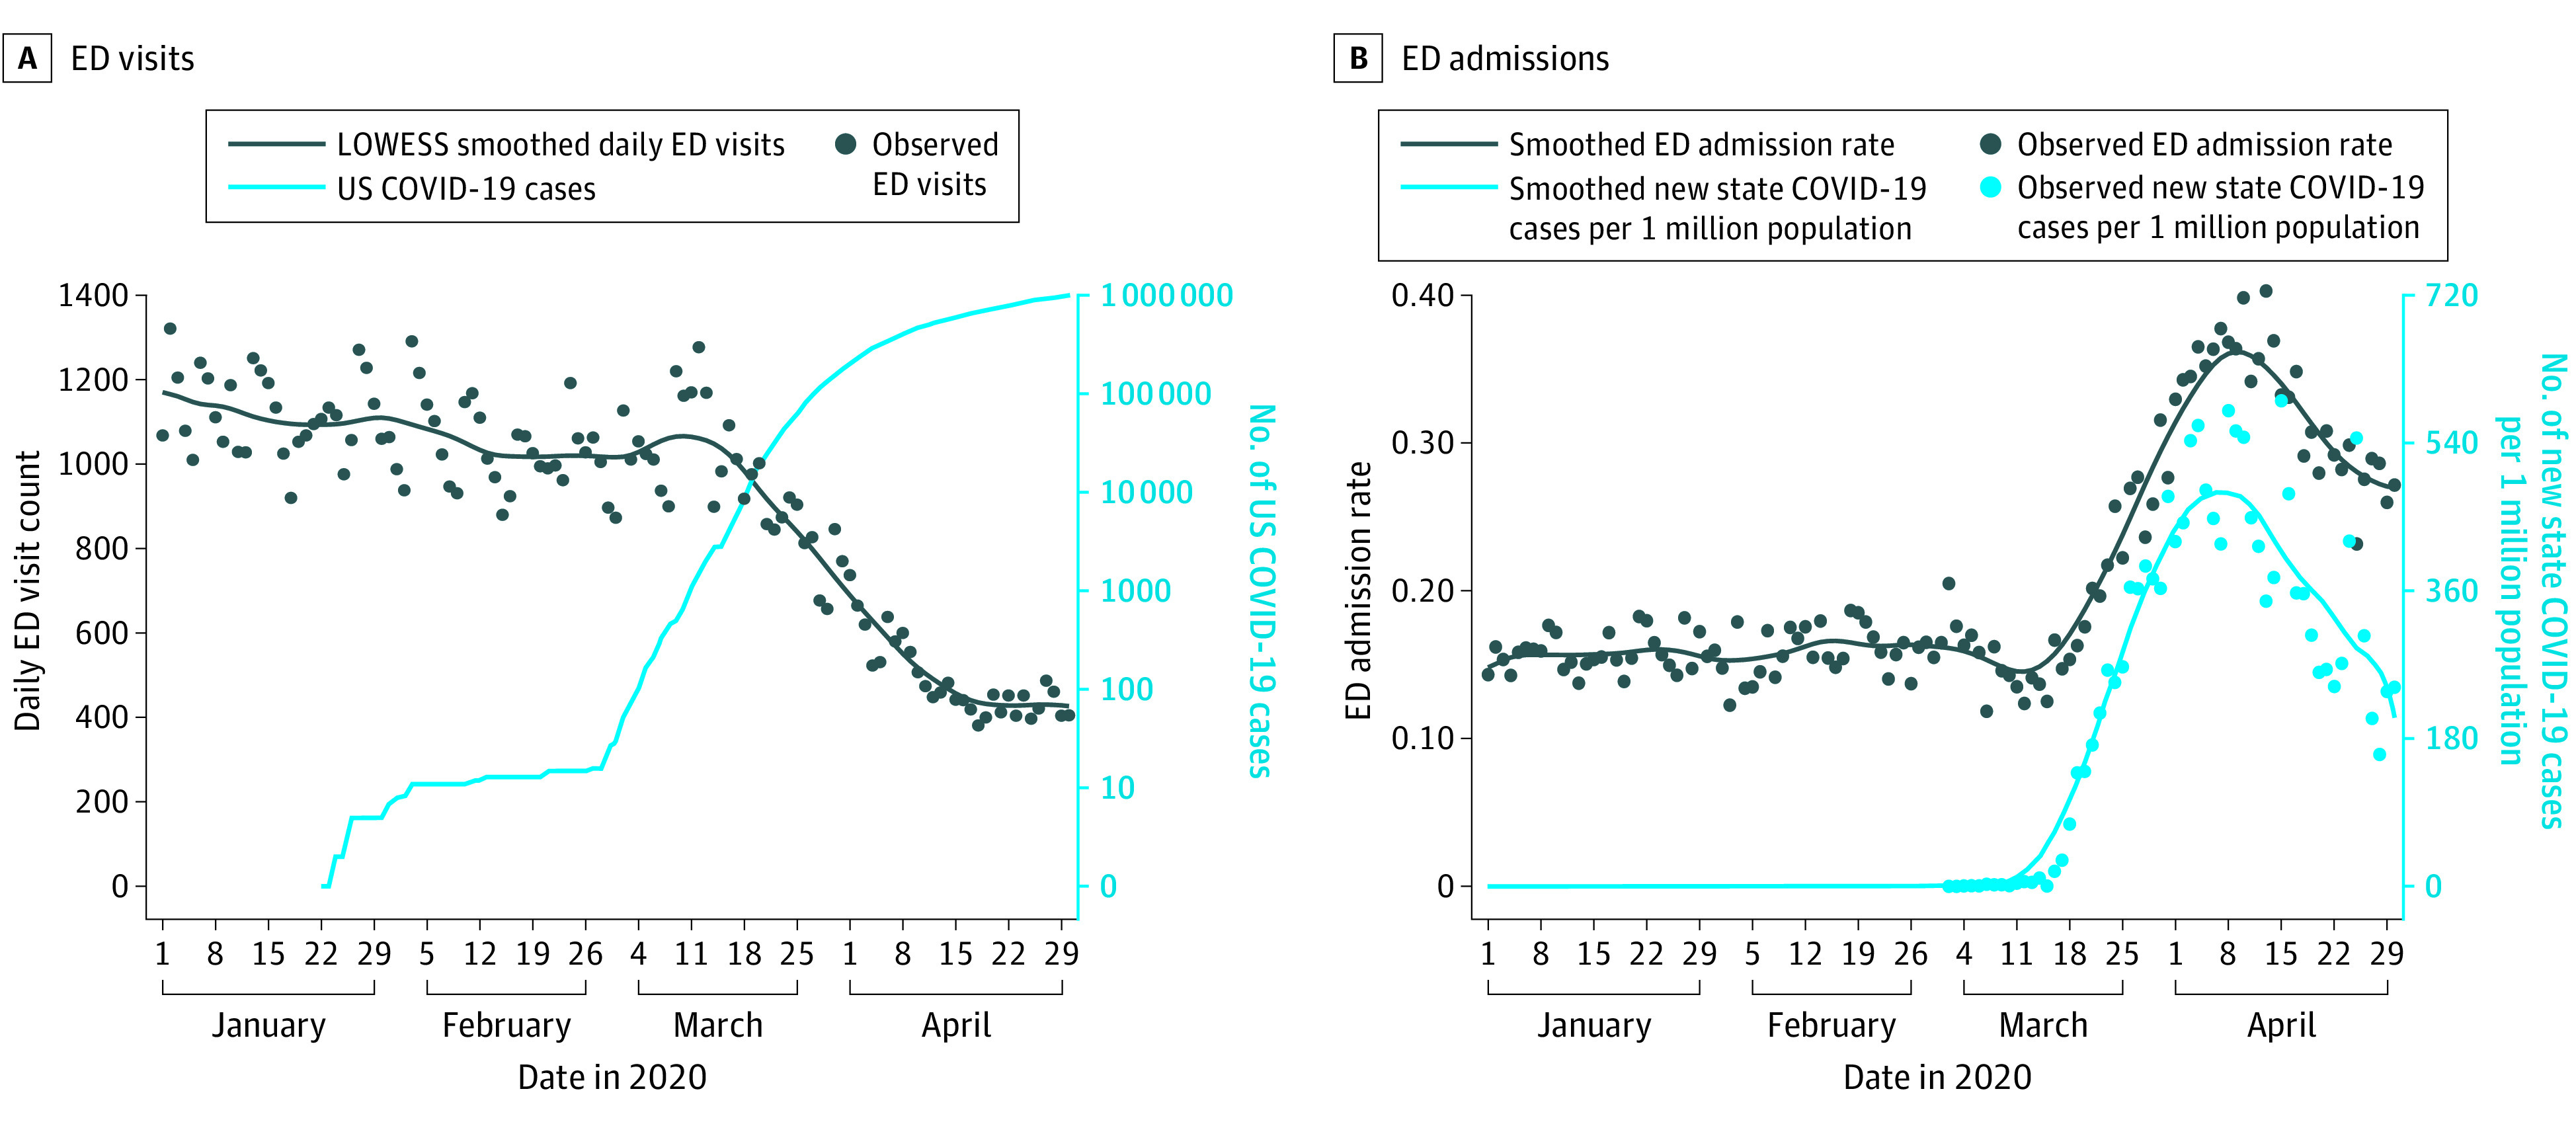
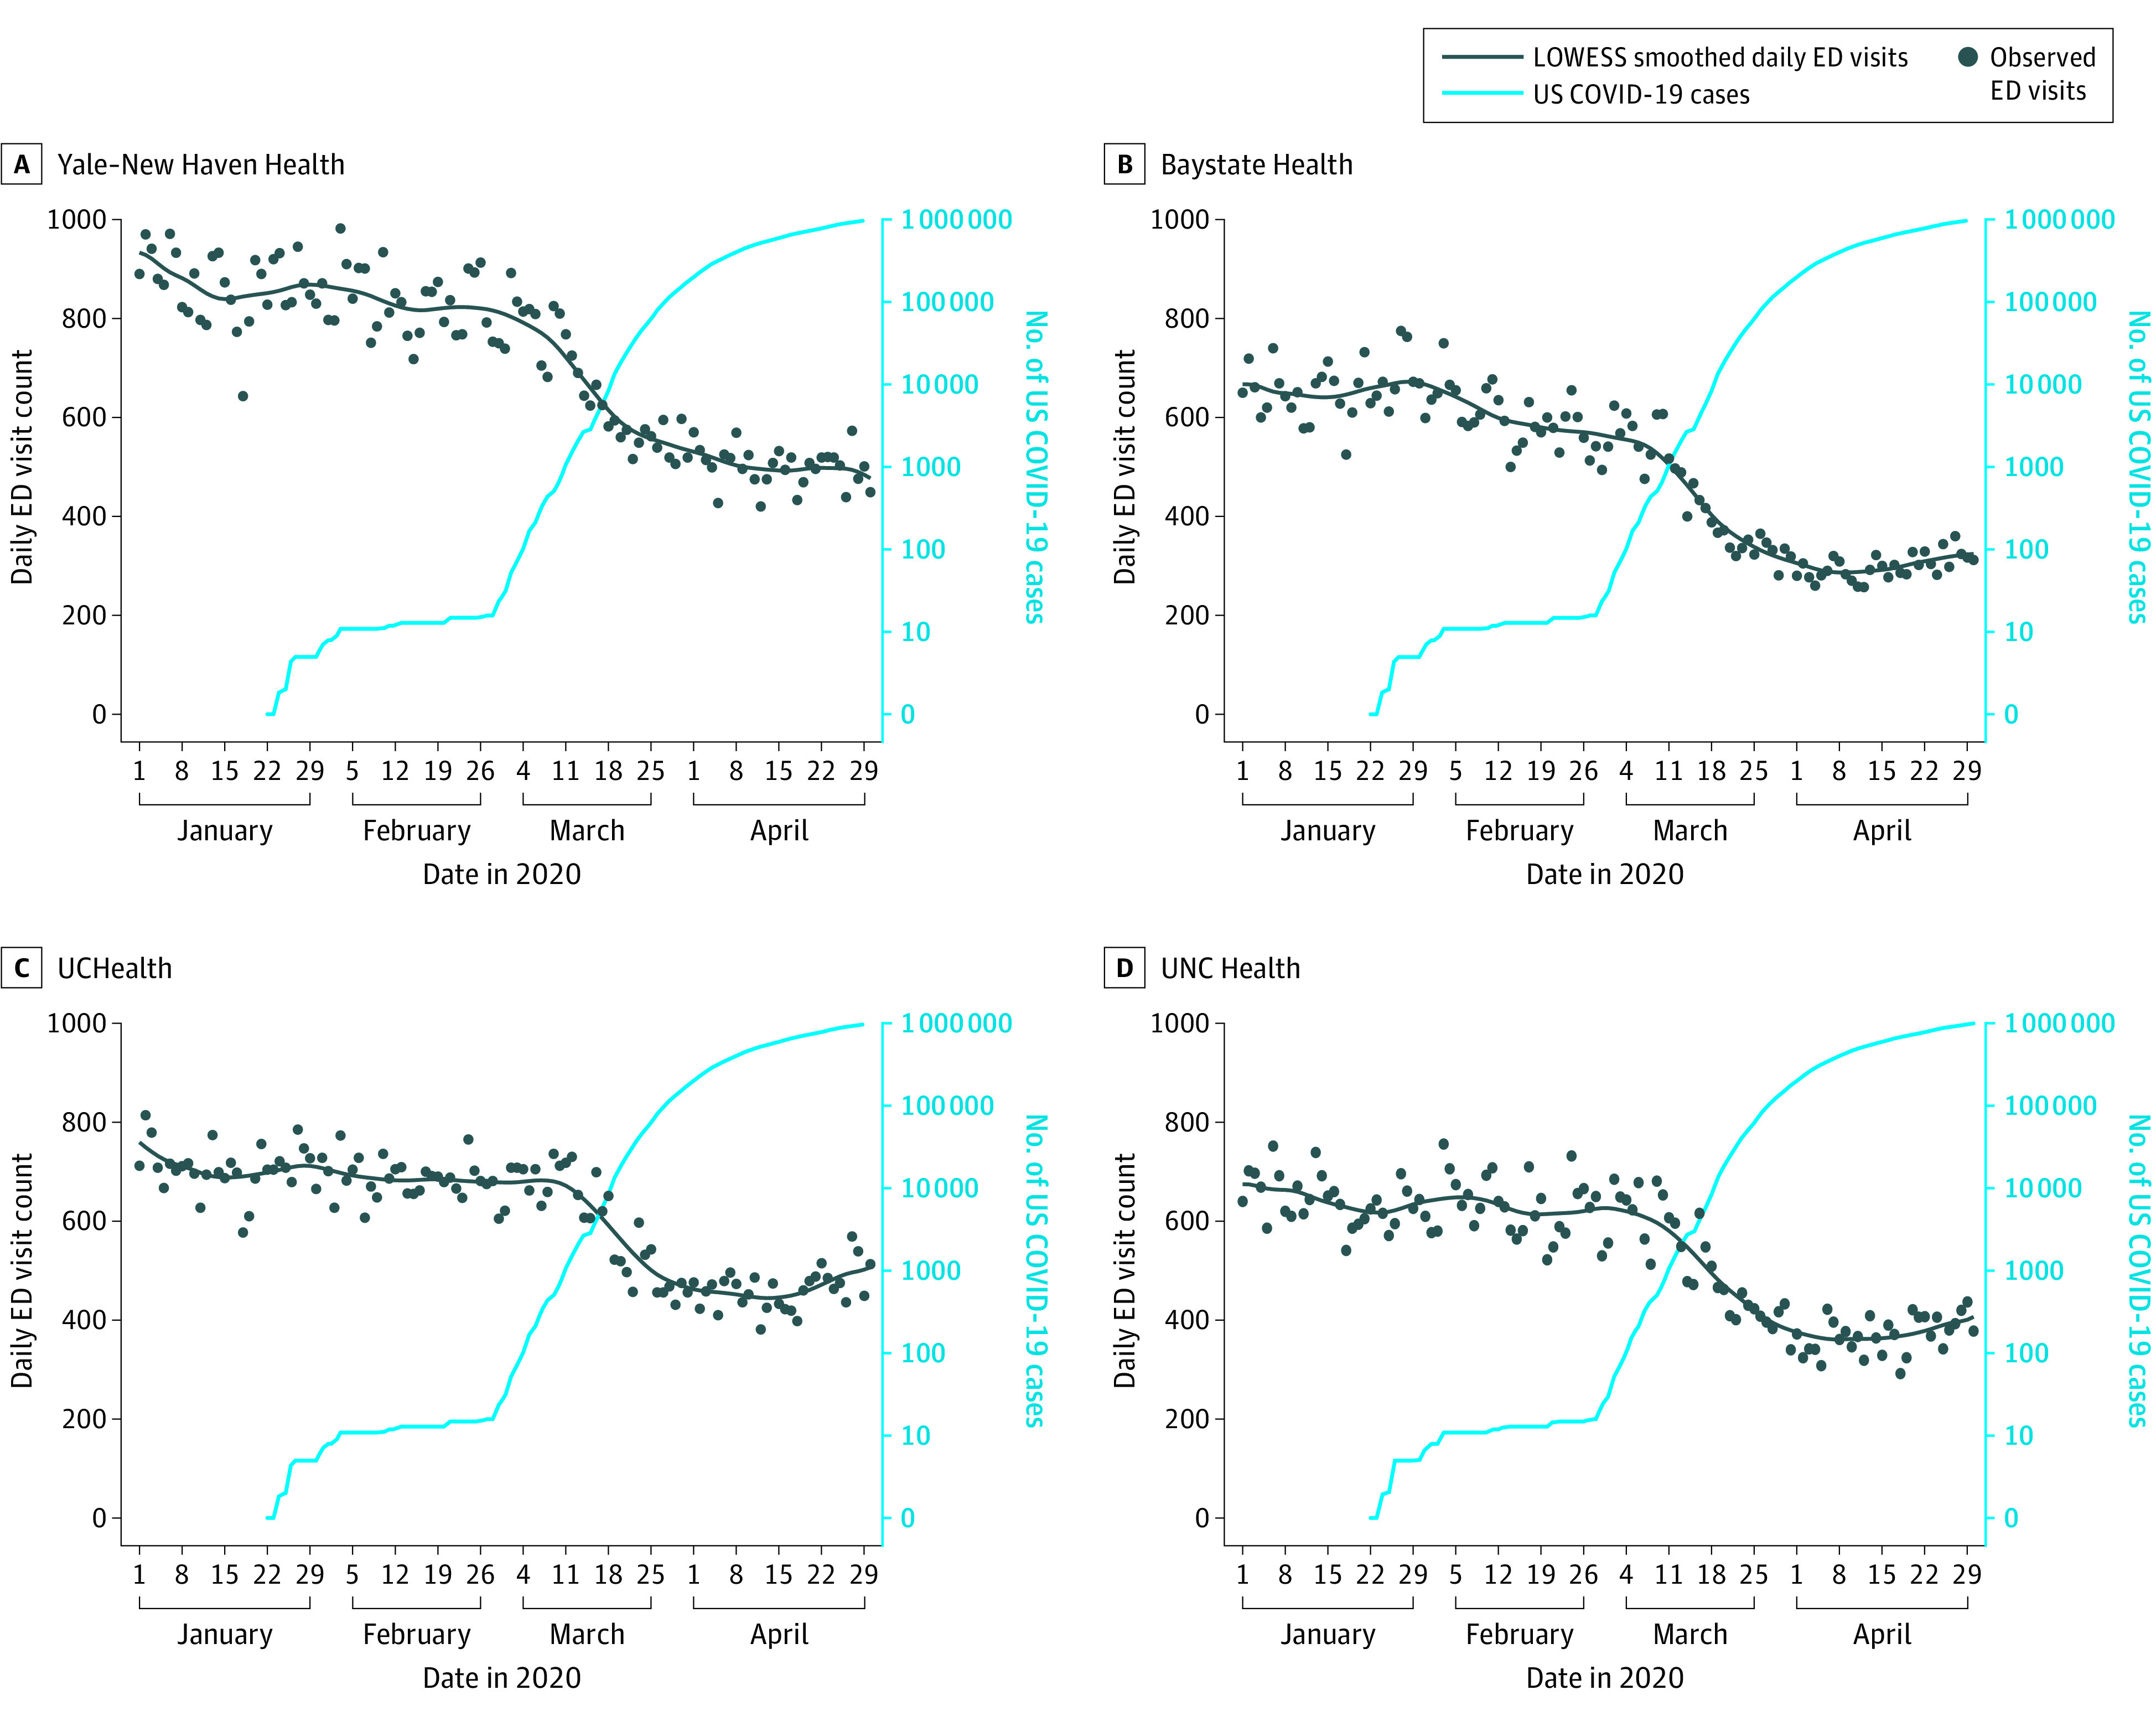
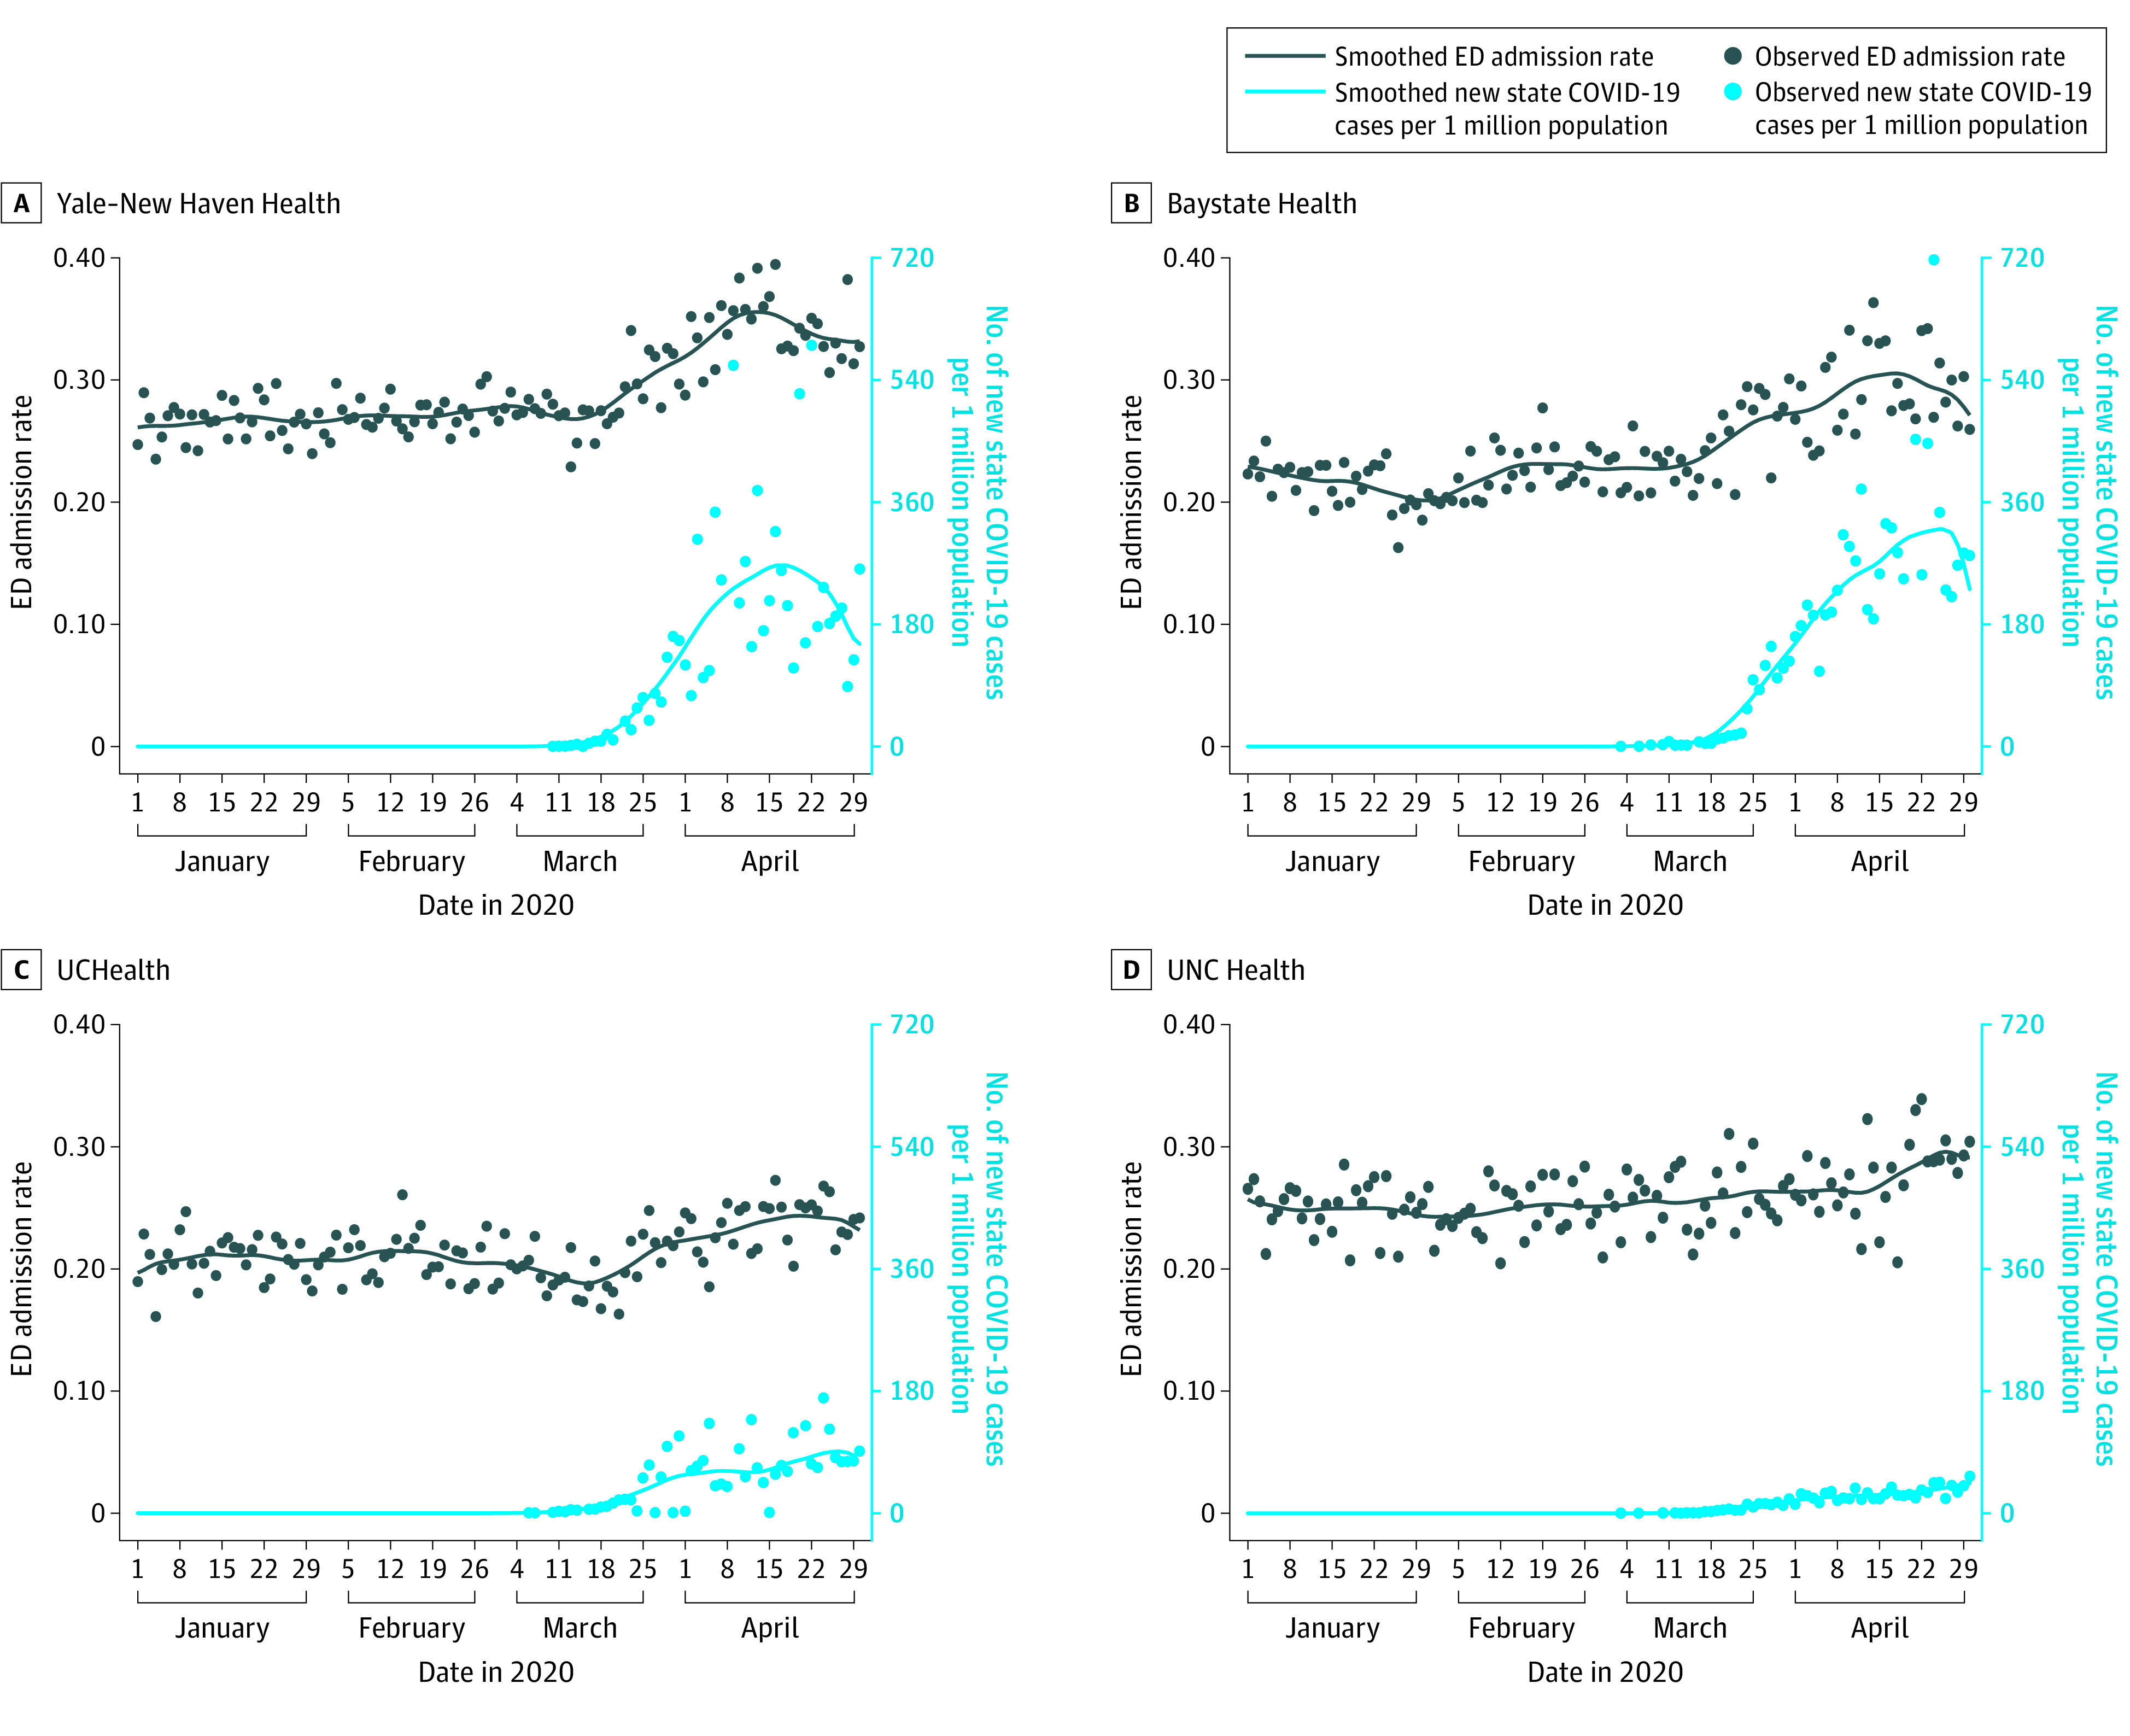
Results: A total of 24 EDs were studied. The annual ED volume before the COVID-19 pandemic ranged from 13 000 to 115 000 visits per year; the decrease in ED visits ranged from 41.5% in Colorado to 63.5% in New York. The weeks with the most rapid rates of decrease in visits were in March 2020, which corresponded with national public health messaging about COVID-19. Hospital admission rates from the ED were stable until new COVID-19 case rates began to increase locally; the largest relative increase in admission rates was 149.0% in New York, followed by 51.7% in Massachusetts, 36.2% in Connecticut, 29.4% in Colorado, and 22.0% in North Carolina.
Conclusions and relevance: From January through April 2020, as the COVID-19 pandemic intensified in the US, temporal associations were observed with a decrease in ED visits and an increase in hospital admission rates in 5 health care systems in 5 states. These findings suggest that practitioners and public health officials should emphasize the importance of visiting the ED during the COVID-19 pandemic for serious symptoms, illnesses, and injuries that cannot be managed in other settings.
Conflict of interest statement
Figures
Comment in
-
Learning From the Decrease in US Emergency Department Visits in Response to the Coronavirus Disease 2019 Pandemic.JAMA Intern Med. 2020 Oct 1;180(10):1334-1335. doi: 10.1001/jamainternmed.2020.3265. JAMA Intern Med. 2020. PMID: 32744611 No abstract available.
References
-
- Melnick ER, Jeffery MM, Dziura JD, et al. . User-centred clinical decision support to implement emergency department-initiated buprenorphine for opioid use disorder: protocol for the pragmatic group randomised EMBED trial. BMJ Open. 2019;9(5):e028488. doi:10.1136/bmjopen-2018-028488 - DOI - PMC - PubMed
Publication types
MeSH terms
Grants and funding
LinkOut - more resources
Full Text Sources
Medical
Research Materials
Miscellaneous
