. 2021 Jan 1;148(1):238-251.
doi: 10.1002/ijc.33242. Epub 2020 Aug 12.

A gene expression-based single sample predictor of lung adenocarcinoma molecular subtype and prognosis

Affiliations

A gene expression-based single sample predictor of lung adenocarcinoma molecular subtype and prognosis

Helena Liljedahl et al. Int J Cancer. .

Abstract

Disease recurrence in surgically treated lung adenocarcinoma (AC) remains high. New approaches for risk stratification beyond tumor stage are needed. Gene expression-based AC subtypes such as the Cancer Genome Atlas Network (TCGA) terminal-respiratory unit (TRU), proximal-inflammatory (PI) and proximal-proliferative (PP) subtypes have been associated with prognosis, but show methodological limitations for robust clinical use. We aimed to derive a platform independent single sample predictor (SSP) for molecular subtype assignment and risk stratification that could function in a clinical setting. Two-class (TRU/nonTRU=SSP2) and three-class (TRU/PP/PI=SSP3) SSPs using the AIMS algorithm were trained in 1655 ACs (n = 9659 genes) from public repositories vs TCGA centroid subtypes. Validation and survival analysis were performed in 977 patients using overall survival (OS) and distant metastasis-free survival (DMFS) as endpoints. In the validation cohort, SSP2 and SSP3 showed accuracies of 0.85 and 0.81, respectively. SSPs captured relevant biology previously associated with the TCGA subtypes and were associated with prognosis. In survival analysis, OS and DMFS for cases discordantly classified between TCGA and SSP2 favored the SSP2 classification. In resected Stage I patients, SSP2 identified TRU-cases with better OS (hazard ratio [HR] = 0.30; 95% confidence interval [CI] = 0.18-0.49) and DMFS (TRU HR = 0.52; 95% CI = 0.33-0.83) independent of age, Stage IA/IB and gender. SSP2 was transformed into a NanoString nCounter assay and tested in 44 Stage I patients using RNA from formalin-fixed tissue, providing prognostic stratification (relapse-free interval, HR = 3.2; 95% CI = 1.2-8.8). In conclusion, gene expression-based SSPs can provide molecular subtype and independent prognostic information in early-stage lung ACs. SSPs may overcome critical limitations in the applicability of gene signatures in lung cancer.

Keywords: gene expression; lung adenocarcinoma; molecular subtypes; prognosis; single sample predictor.


Conflict of interest statement

The authors declared no potential conflicts of interest.

Figures

FIGURE 1
FIGURE 1
Flow‐chart of study. A, Approach to derive molecular subtype training class through nearest centroid classification (NCC) of all datasets individually using the scheme reported by Wilkerson et al. 9 For the two‐class subtype approach, PP and PI subtypes were combined to a single nonTRU class. B, Training and validation scheme for deriving a two‐class SSP for TRU/nonTRU (SSP2) and a three‐class SSP for TRU/PI/PP subtypes (SSP3) based on the AIMS single sample method. Of the total 22 datasets included, 5 were reserved as independent validation datasets and were also used for evaluation of prognostic performance of the SSP models in both surgically treated only and adjuvantly treated patients. A patient overlap existed for the Shedden et al and Zhu et al cohorts. Patients overlapping were excluded from one cohort in survival analyses. An additional external validation of the SSP2 model was also performed in archival RNA from 44 Stage‐I patients treated with surgery only, by pairing the SSP2 model with the NanoString nCounter XT technology
FIGURE 2
FIGURE 2
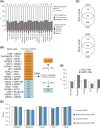
Training and validation of SSPs for prediction of molecular subtypes in lung adenocarcinoma. A, Proportion of TRU and nonTRU cases predicted by the NCC method 9 per dataset in the study. For each dataset, assignment to training or validation cohort and technical gene expression platform is shown. Top‐axis indicates dataset size. B, Schematic overview of the SSP2 classifier for TRU/nonTRU status based on training vs NCC subtype classes in the training cohort. The SSP2 classifier comprises 18 gene rules (pairs), that is, 36 genes. Gene rules are shown with indication of their highest posterior probability in the AIMS model. Based on all individual gene rule probabilities a final prediction is made. C, Overlap of genes in the SSP2 (top) and SSP3 classifiers vs the original NCC centroid genes from Wilkerson et al. 9 D, Proportions of TRU classified cases in the five validation datasets for the NCC and SSP2 models, showing differences across datasets. E, Classification performance (accuracy and balanced accuracy) in the validation cohort for the SSP2 model vs TRU/nonTRU NCC classifier, and the SSP3 model vs the TRU/PI/PP NCC classifications
FIGURE 3
FIGURE 3
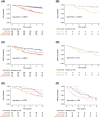
Comparison of classification methods and implication on survival outcome in lung adenocarcinoma. For details about the groups used in the Kaplan‐Meier plots, see the Results section. A, Kaplan‐Meier plot of OS for 590 surgically treated lung adenocarcinoma patients combined from the five validation datasets stratified by concordant or discordant NCC and SSP2 classifications. B, OS for 94 of 104 patients with discrepant SSP2/NCC classification from (A). C, DMFS for 454 surgically treated lung adenocarcinoma patients combined from the five validation datasets stratified by concordant or discordant NCC and SSP2 classifications. D, Kaplan‐Meier plot of DMFS for 86 patients with discrepant SSP2/NCC classification from (C). E, Kaplan‐Meier plot of OS for 176 lung adenocarcinoma patients treated with adjuvant chemotherapy combined from the five validation datasets. F, DMFS for 105 adjuvant treated lung adenocarcinoma patients combined from the five validation datasets. In all plots, P‐values were calculated using the log‐rank test
FIGURE 4
FIGURE 4
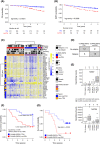
SSP2 performance on surgically treated Stage‐I lung adenocarcinomas. A, Kaplan‐Meier plot of OS for surgically treated Stage‐I patients in the validation datasets (only patients with outcome data), stratified by SSP2 classification. B, DMFS for surgically treated Stage‐I patients in the validation datasets, stratified by SSP2 classification. C, Hierarchical clustering (Pearson correlation and ward.D linkage) of log2 count NanoString data for 44 FFPE Stage‐I tumors using the 36 genes present in the SSP2 model through the CLAMS package. D, Confusion matrix of CLAMS prediction vs clinical status of relapse (loc‐regional/distant) yes/no. E, Gene expression of MKI67 (Ki67) and NAPSA (Napsin A) across the 44 NanoString cases stratified by CLAMS prediction and clinical relapse status. Groups in gray represents agreement between TRU/no relapse and nonTRU/relapse. F, Kaplan‐Meier plot of recurrence‐free (loco‐regional/distant) interval for the 44 NanoString cases stratified by CLAMS prediction. G, Kaplan‐Meier plot of OS for 30 Stage‐I tumors from GSE143486 stratified by CLAMS prediction. FFPE RNA for these samples were analyzed by RNA sequencing. In all Kaplan‐Meier plots, P‐values were calculated using the log‐rank test

References

    1. Travis WD, Brambilla E, Nicholson AG, et al. The 2015 World Health Organization classification of lung tumors: impact of genetic, clinical and radiologic advances since the 2004 classification. J Thorac Oncol. 2015;10:1243‐1260. - PubMed
    1. Herbst RS, Heymach JV, Lippman SM. Lung cancer. New Engl J Med. 2008;359:1367‐1380. - PMC - PubMed
    1. Hammerman PS, Lawrence MS, Voet D, et al. Comprehensive genomic characterization of squamous cell lung cancers. Nature. 2012;489:519‐525. - PMC - PubMed
    1. Cancer Genome Atlas Research Network . Comprehensive molecular profiling of lung adenocarcinoma. Nature. 2014;511:543‐550. - PMC - PubMed
    1. Swanton C, Govindan R. Clinical implications of genomic discoveries in lung cancer. N Engl J Med. 2016;374:1864‐1873. - PubMed

Publication types

MeSH terms

Substances