. 2020 Jul 17;125(3):033902.
doi: 10.1103/PhysRevLett.125.033902.

Stretched-Pulse Soliton Kerr Resonators

Affiliations

Stretched-Pulse Soliton Kerr Resonators

Xue Dong et al. Phys Rev Lett. .

Abstract

Kerr resonators support novel nonlinear wave phenomena including technologically important optical solitons. Fiber Kerr resonator solitons enable wavelength and repetition-rate versatile femtosecond-pulse and frequency-comb generation. However, key performance parameters, such as pulse duration, lag behind those from traditional mode-locked laser-based sources. Here we present new pulse generation in dispersion-managed Kerr resonators based on stretched-pulse solitons, which support the shortest pulses to date from a fiber Kerr resonator. In contrast to established Kerr resonator solitons, stretched-pulse solitons feature Gaussian temporal profiles that stretch and compress each round trip. Experimental results are in excellent agreement with numerical simulations. The dependence on dispersion and drive power are detailed theoretically and experimentally and design guidelines are presented for optimizing performance. Kerr resonator stretched-pulse solitons represent a new stable nonlinear waveform and a promising technique for femtosecond pulse generation.


Figures

FIG. 1.
FIG. 1.
Numerical simulations of stretched-pulse solitons. (a) Steady-state evolution of the pulse duration (black) and spectral bandwidth (red) in the -GVD and +GVD segments of one cavity round trip. Note that while the total dispersion of each fiber is nearly the same, the GVD and lengths differ (see supplemental information). (b) Pulse convergence represented by the energy difference between pulses of successive round trips. (c) The log-scale simulated temporal intensity of the pulse when it is shortest with Gaussian (red) and hyperbolic secant (blue) fits. The linear-scale pulse is inset. (d) The corresponding log-scale simulated spectral intensity and Gaussian (red) and hyperbolic secant (blue) fits. The linear-scale spectrum is inset.
FIG. 2.
FIG. 2.
Schematic of the experimental setup. IM, intensity modulator; EDFA, Erbium-doped fiber amplifier; FBG, fiber Bragg grating; OSA, optical spectrum analyzer; DCF, dispersion compensating fiber; PC, polarization controller; ISO, isolator; CIR, circulator; and BS, beam splitter.
FIG. 3.
FIG. 3.
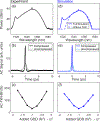
Experimental (a) spectrum, (b) uncompressed output (gray) and compressed output (black) autocorrelation, and (c) autocorrelation duration as a function of the grating-pair group delay dispersion (GDD). Corresponding simulated (d) spectrum (solid), (e) uncompressed output (light blue) and compressed output (blue) autocorrelation, and (f) autocorrelation duration as a function of the grating-pair dispersion applied. The spectrum from simulations without TOD is plotted with a blue dashed line in (d) for comparison. AC, autocorrelation and FWHM, full width at half the maximum.
FIG. 4.
FIG. 4.
Stretched-pulse soliton dependence on dispersion and drive power. (a) Broadest measured spectrum as a function of net group delay dispersion of the cavity. The drive laser frequency is plotted in black. (b) The broadest spectral bandwidth vs. net dispersion from experiments (points) and simulations with (red line) and without (blue line) TOD. The black dashed line indicates the approximate minumim stretching ratio (2) corresponding to stetched pulse solitons. More complicated behavior is found in the grey shaded region. (c) Broadest measured spectrum as a function of drive power. The drive laser frequency is plotted in black. (d) The broadest spectral bandwidth vs. drive power from experiments (points) and corresponding simulations (blue line).

References

    1. Diddams SA, J. Opt. Soc. Am. B 27, B51 (2010).
    1. Kippenberg TJ, Holzwarth R, and Diddams SA, Science 332, 555 (2011). - PubMed
    1. Suh MG, Yang QF, Yang KY, Yi X, and Vahala KJ, Science 354, 600 (2016). - PubMed
    1. Spencer DT, Lee SH, Oh DY, Suh M-G, Yang KY, and Vahala K, Nature 557, 81 (2018). - PubMed
    1. Udem T, Holzwarth R, and Hänsch TW, Nature 416, 233 (2002). - PubMed