. 2020 Oct:65:101785.
doi: 10.1016/j.media.2020.101785. Epub 2020 Jul 18.

Time-distanced gates in long short-term memory networks

Affiliations

Time-distanced gates in long short-term memory networks

Riqiang Gao et al. Med Image Anal. 2020 Oct.

Abstract

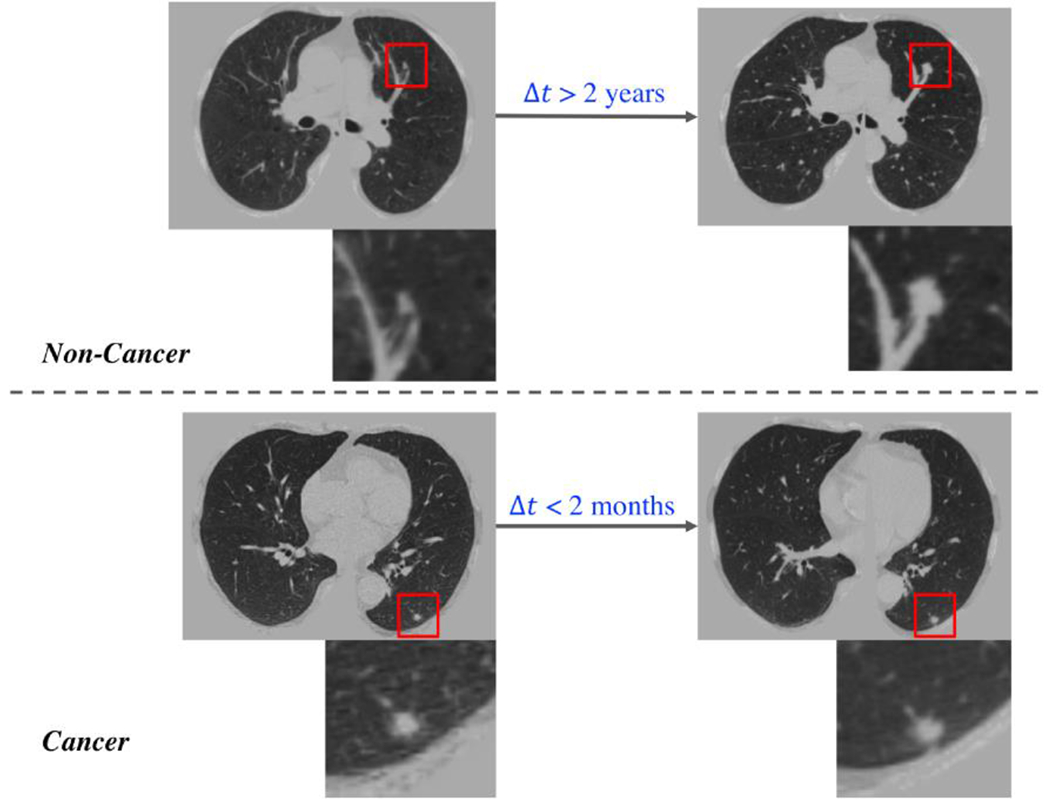
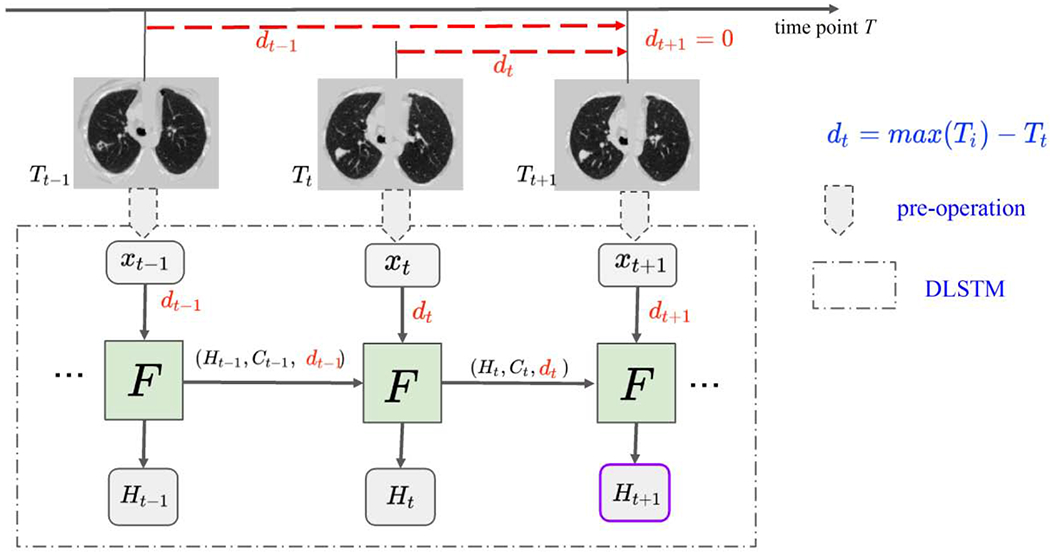
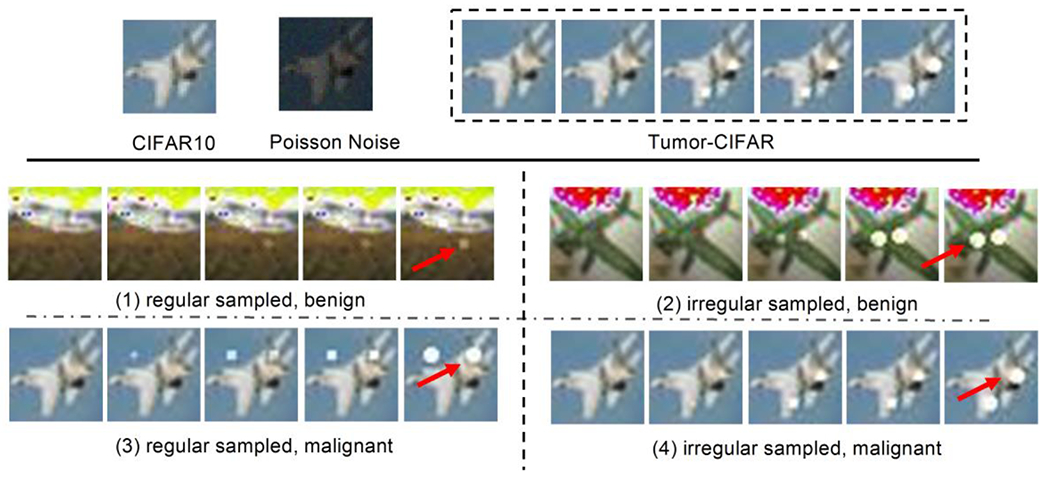
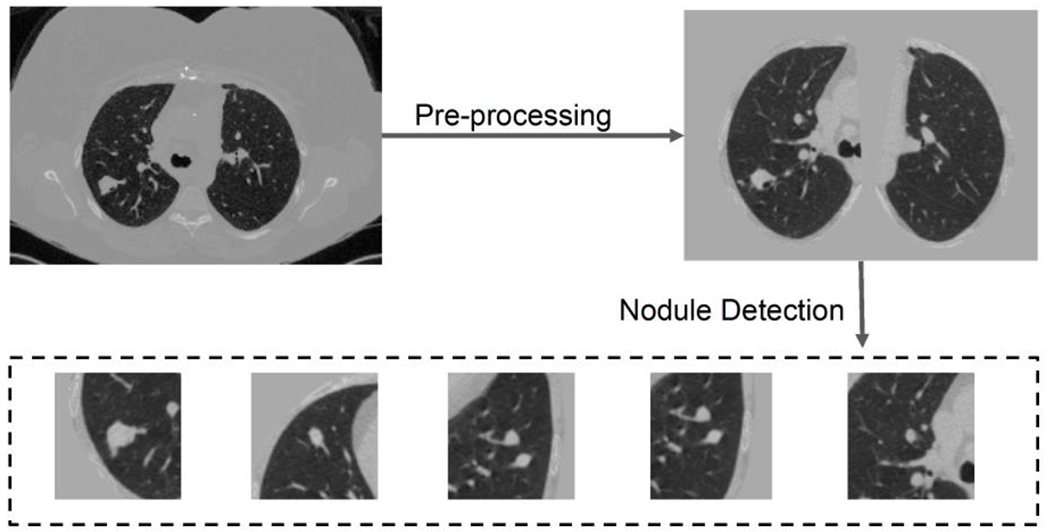
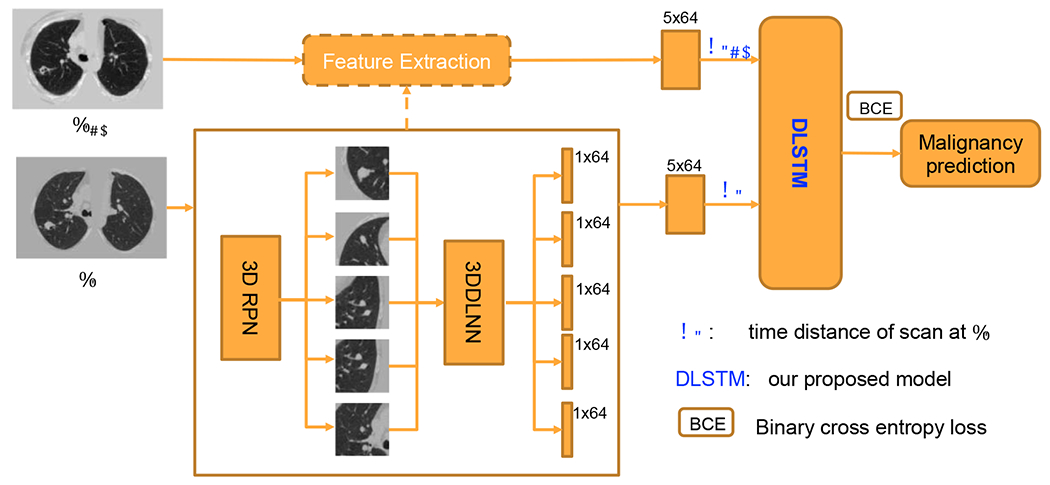
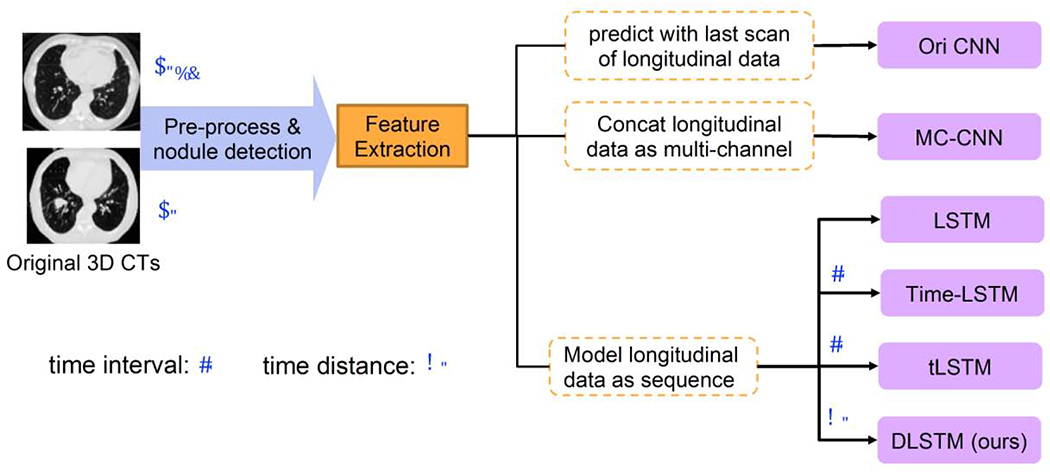
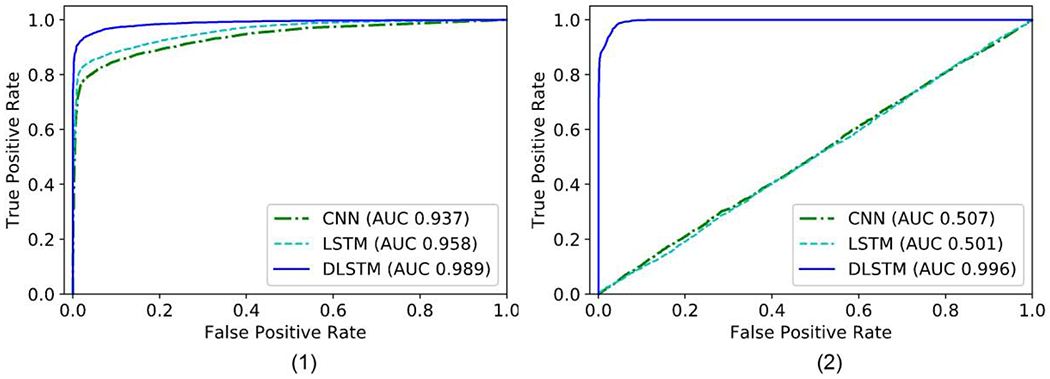
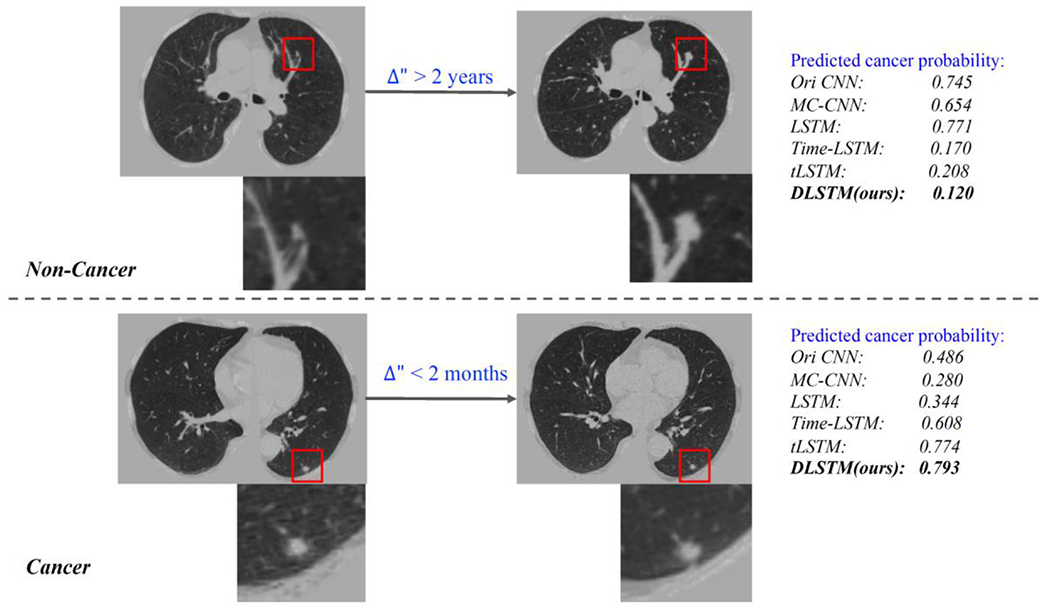
The Long Short-Term Memory (LSTM) network is widely used in modeling sequential observations in fields ranging from natural language processing to medical imaging. The LSTM has shown promise for interpreting computed tomography (CT) in lung screening protocols. Yet, traditional image-based LSTM models ignore interval differences, while recently proposed interval-modeled LSTM variants are limited in their ability to interpret temporal proximity. Meanwhile, clinical imaging acquisition may be irregularly sampled, and such sampling patterns may be commingled with clinical usages. In this paper, we propose the Distanced LSTM (DLSTM) by introducing time-distanced (i.e., time distance to the last scan) gates with a temporal emphasis model (TEM) targeting at lung cancer diagnosis (i.e., evaluating the malignancy of pulmonary nodules). Briefly, (1) the time distance of every scan to the last scan is modeled explicitly, (2) time-distanced input and forget gates in DLSTM are introduced across regular and irregular sampling sequences, and (3) the newer scan in serial data is emphasized by the TEM. The DLSTM algorithm is evaluated with both simulated data and real CT images (from 1794 National Lung Screening Trial (NLST) patients with longitudinal scans and 1420 clinical studied patients). Experimental results on simulated data indicate the DLSTM can capture families of temporal relationships that cannot be detected with traditional LSTM. Cross-validation on empirical CT datasets demonstrates that DLSTM achieves leading performance on both regularly and irregularly sampled data (e.g., improving LSTM from 0.6785 to 0.7085 on F1 score in NLST). In external-validation on irregularly acquired data, the benchmarks achieved 0.8350 (CNN feature) and 0.8380 (with LSTM) on AUC score, while the proposed DLSTM achieves 0.8905. In conclusion, the DLSTM approach is shown to be compatible with families of linear, quadratic, exponential, and log-exponential temporal models. The DLSTM can be readily extended with other temporal dependence interactions while hardly increasing overall model complexity.

Keywords: Distanced LSTM; Longitudinal; Lung cancer diagnosis; Temporal Emphasis Model.


Conflict of interest statement

Declaration of Competing Interest The authors declare that they have no known competing financial interests or personal relationships that could have appeared to influence the work reported in this paper.

Figures

Fig. 1.
Fig. 1.
Challenging examples for conventional LSTM. One high-risk region per image is enlarged. The upper CT images are from a cancer-free patient, where the clear changes can be seen in nodule over 2 years. The lower CT images come from a cancer patient, where a clear difference is hard to be visualized within a short time interval.
Fig. 2.
Fig. 2.
The framework of DLSTM (three “steps” in the example). The pre-operation can be image preprocessing or a feature extraction network. xt is the input data at time point t, and dt is the time distance from the time point t to the latest time point. “F” represents the learnable DLSTM component (convolutional version in this paper). Ht and Ct are the hidden state and cell state, respectively. The input data, xt, could be ID, 2D, or 3D. The last step’s output (e.g., Ht+1) is the output of DLSTM.
Fig. 3.
Fig. 3.
Illustration of the Tumor-CIFAR. The upper panel shows the differences between CIFAR10 and Tumor-CIFAR. Each image in CIFAR10 will be transformed into a five-step longitudinal sample by adding growing nodules and Poisson noise (the intensities of noise map in the figure are magnified ten times for better visualization). The bottom panel show more examples in the two version datasets we simulated (e.g., nodules are added to ‘airplane’). The bottom-left panel is from version 1, which has the same time interval distribution, different nodule sizes between benign and malignant. The bottom-right panel is from version 2, which has the same nodule size distribution, different time intenvals between benign and malignant, the dummy nodules are shown as white blobs (some are indicated by red arrows).
Fig. 4.
Fig. 4.
Preprocessing and nodule detection. Both steps follow the open-source code of Liao et al. (Liao et al.. 2019). Briefly, the preprocessing segments the lung and get rid of the background in chest CT, and nodule detection detects five highest risk regions. If the number of detected nodules is less than five, patches of all zeros are added to create the five patches.
Fig. 5.
Fig. 5.
The pipeline for chest CTs. The serial CT images are from the same person at Tt−1 and Tt. The The details of DLSTM and time distance definition dt are illustrated in Figure 2 and Section 2.
Fig. 6.
Fig. 6.
The experimental design of CT images. The 3DDLNN is the network structure from (Liao et al., 2019). Six different methods are compared in our experiments, including two newly time-modeled LSTM algorithms (Time-LSTM (Zhu et al., 2017) and tLSTM (Santeramo et al., 2018)). Those two integrate the time interval lt in the model, while our method introduces the new concept of time distance dt. Please refer to Section 2.1 for the definitions of lt and dt.
Fig. 7.
Fig. 7.
The receiver operating characteristic (ROC) curves of the results on Tumor-CIFAR. The right bottom of the figures shows the Area Under the Curve (AUC) values of different methods. (1) version 1: rough regularly sampled data. The CNN and LSTM achieve reasonable performance, and the proposed DLSTM performs better. (2) version 2: extremely irregularly sampled data. The CNN and LSTM achieve minimal
Fig. 8.
Fig. 8.
Qualitative results related to Figure 1. The upper part is from a non-cancer patient, which with large time interval between two scans. The bottom part is from a cancer, and the two scans is close at time distance. The DLSTM is the exponential version.

References

    1. Aberle et al., 2011. Aberle DR, Adams AM, Berg CD, Black WC, Clapp JD, Fagerstrom RM, Gareen IF, Gatsonis C, Marcus PM, Sicks JRD Reduced lung-cancer mortality with low-dose computed tomographic screening. N. Engl. J. Med. 365, (2011) 395–409. 10.1056/NEJMoa1102873 - DOI - PMC - PubMed
    1. Ardila et al., 2019. Ardila D, Kiraly AP, Bharadwaj S, Choi B, Reicher JJ, Peng L, Tse D, Etemadi M, Ye W, Corrado G, Naidich DP, Shetty S End-to-end lung cancer screening with three-dimensional deep learning on low-dose chest computed tomography. Nat. Med. (2019) 10.1038/s41591-019-0447-x - DOI - PubMed
    1. Bayer and Osendorfer, 2014. Bayer J, Osendorfer C Learning stochastic recurrent networks. arXiv preprint arXiv:1411.7610. (2014).
    1. Boas and Fleischmann, 2012. Boas FE and Fleischmann D CT artifacts: causes and redaction techniques. Imaging in medicine, 4(2), pp. 229–240. (2012).
    1. Cai et al., 2017. Cai J, Lu L, Xie Y, Xing F, Yang L Improving Deep Pancreas Segmentation in CT and MRI Images via Recurrent Neural Contextual Learning and Direct Loss Function. arXiv preprint arXiv:1707.04912 (2017).

Publication types