

Physiology-Informed Real-Time Mean Arterial Blood Pressure Learning and Prediction for Septic Patients Receiving Norepinephrine
- PMID: 32746013
- PMCID: PMC7790161
- DOI: 10.1109/TBME.2020.2997929
Physiology-Informed Real-Time Mean Arterial Blood Pressure Learning and Prediction for Septic Patients Receiving Norepinephrine
Abstract
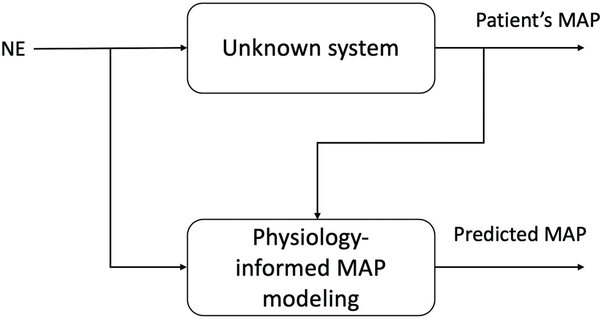
Objective: Septic shock is a life-threatening manifestation of infection with a mortality of 20-50% [1]. A catecholamine vasopressor, norepinephrine (NE), is widely used to treat septic shock primarily by increasing blood pressure. For this reason, future blood pressure knowledge is invaluable for properly controlling NE infusion rates in septic patients. However, recent machine learning and data-driven methods often treat the physiological effects of NE as a black box. In this paper, a real-time, physiology-informed human mean arterial blood pressure model for septic shock patients undergoing NE infusion is studied.
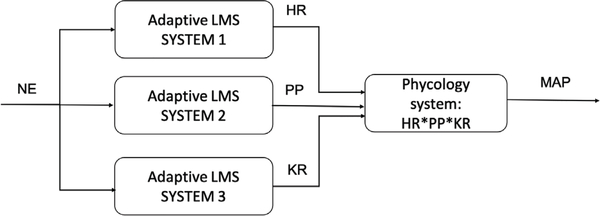
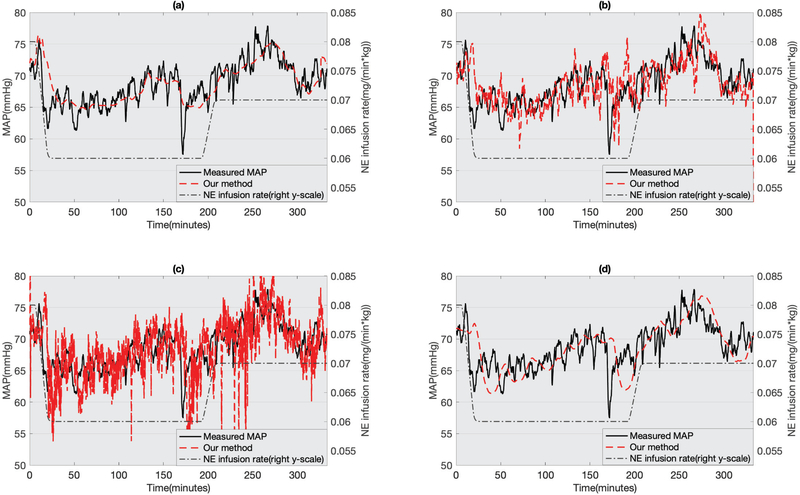
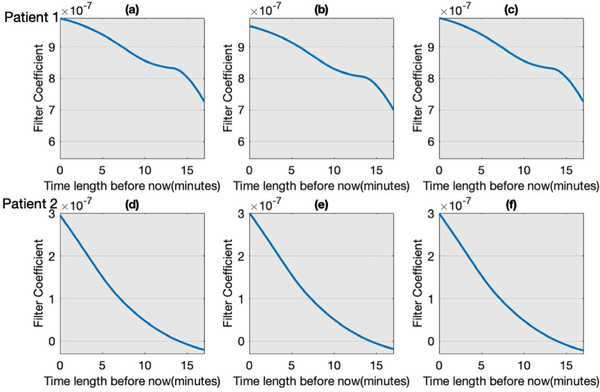
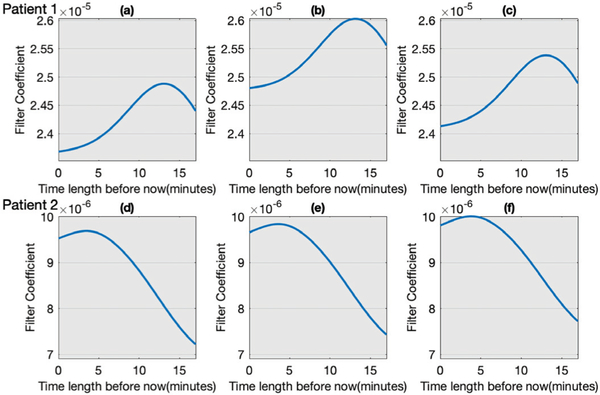
Methods: Our methods combine learning theory, adaptive filter theory, and physiology. We learn least mean square adaptive filters to predict three physiological parameters (heart rate, pulse pressure, and the product of total arterial compliance and arterial resistance) from previous data and previous NE infusion rate. These predictions are combined according to a physiology model to predict future mean arterial blood pressure.
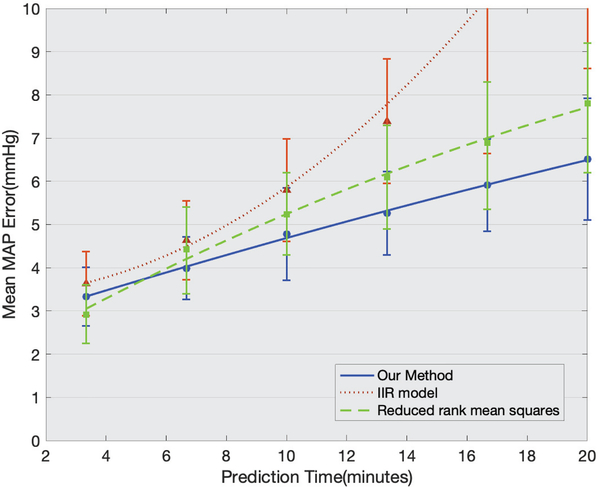
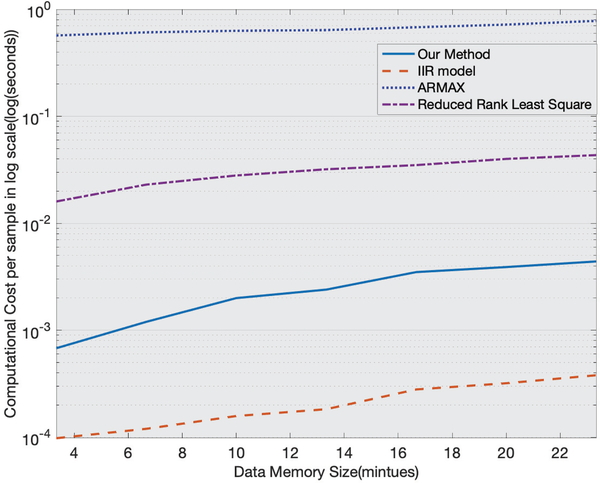
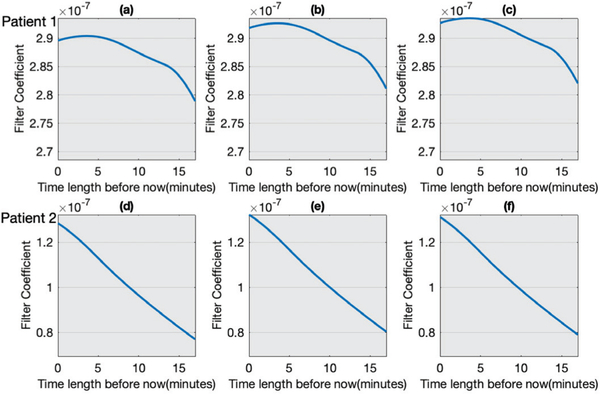
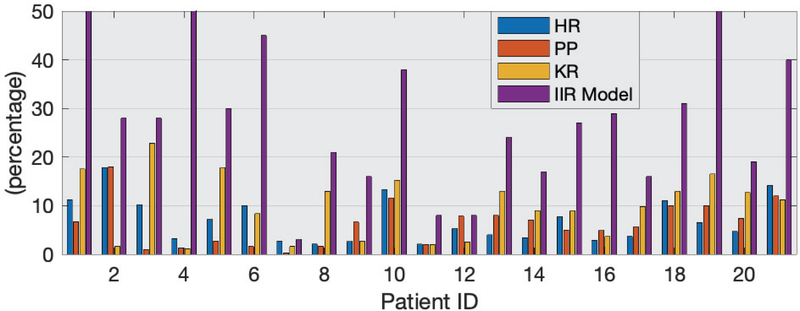
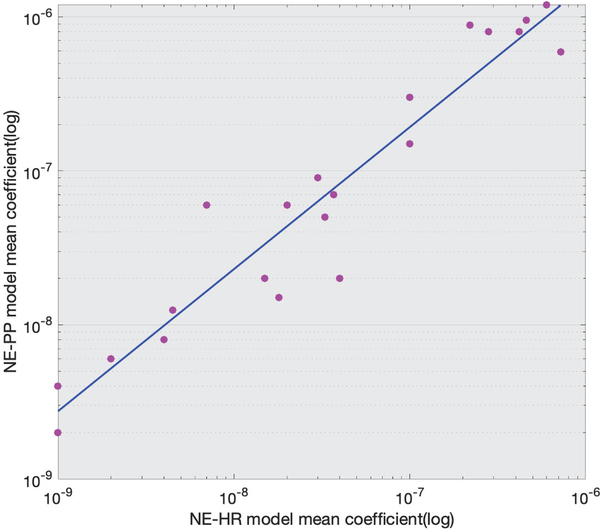
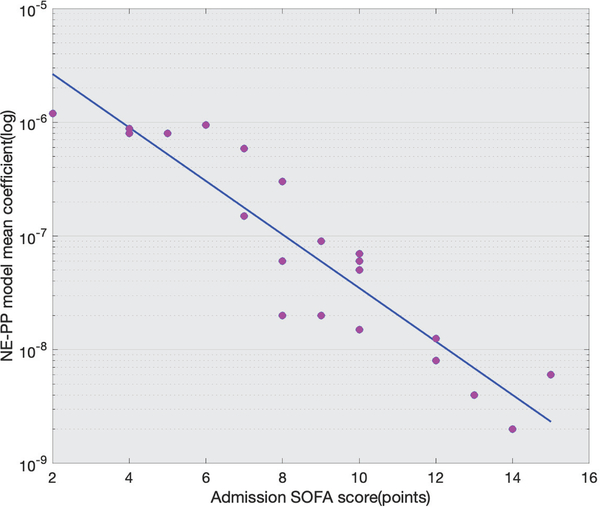
Results: Our model successfully forecasts mean arterial blood pressure on 30 septic patients from two databases. Specifically, we predict mean arterial blood pressure 3.33 minutes to 20 minutes into the future with a root mean square error from 3.56 mmHg to 6.22 mmHg. Additionally, we compare the computational cost of different models and discover a correlation between learned NE response models and a patient's SOFA score.
Conclusion: Our approach advances our capability to predict the effects of changing NE infusion rates in septic patients.
Significance: More accurately predicted MAP can lessen clinicians' workload and reduce error in NE titration.
Figures
References
-
- Dombrovskiy VY, Martin AA, Sunderram J, and Paz HL, “Rapid increase in hospitalization and mortality rates for severe sepsis in the united states: a trend analysis from 1993 to 2003,” Critical care medicine, vol. 35, no. 5, pp. 1244–1250, 2007. - PubMed
-
- Marik PE and Mohedin M, “The contrasting effects of dopamine and norepinephrine on systemic and splanchnic oxygen utilization in hyperdynamic sepsis,” Jama, vol. 272, no. 17, pp. 1354–1357, 1994. - PubMed
-
- Rhodes A, Evans LE, Alhazzani W, Levy MM, Antonelli M, Ferrer R, Kumar A, Sevransky JE, Sprung CL, Nunnally ME et al. , “Surviving sepsis campaign: international guidelines for management of sepsis and septic shock: 2016,” Intensive Care Medicine, vol. 43, no. 3, pp. 304–377, 2017. - PubMed
-
- Beloeil H, Mazoit J-X, Benhamou D, and Duranteau J, “Norepinephrine kinetics and dynamics in septic shock and trauma patients,” British Journal of Anaesthesia, vol. 95, no. 6, pp. 782–788, 2005. - PubMed
Publication types
MeSH terms
Substances
Grants and funding
LinkOut - more resources
Full Text Sources
Other Literature Sources
