Review
. 2020 Oct 1;136(14):1590-1598.
doi: 10.1182/blood.2020006510.

Clonal hematopoiesis: mechanisms driving dominance of stem cell clones

Affiliations
Review

Clonal hematopoiesis: mechanisms driving dominance of stem cell clones

Grant A Challen et al. Blood. .

Abstract

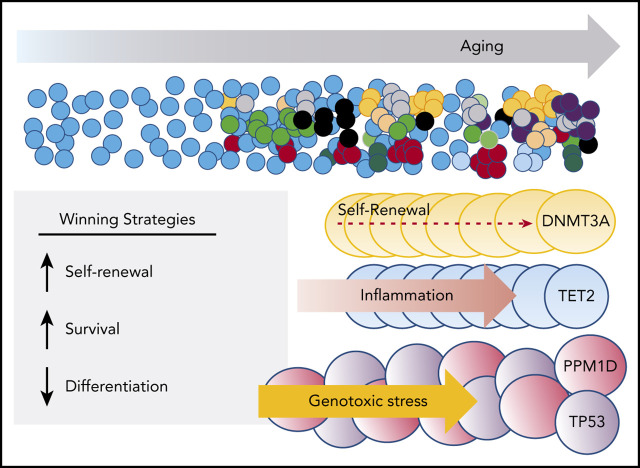
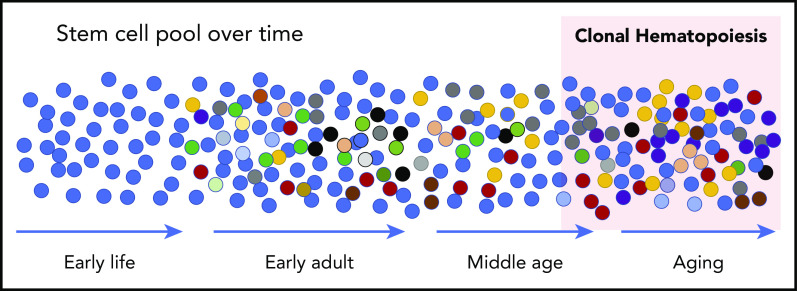
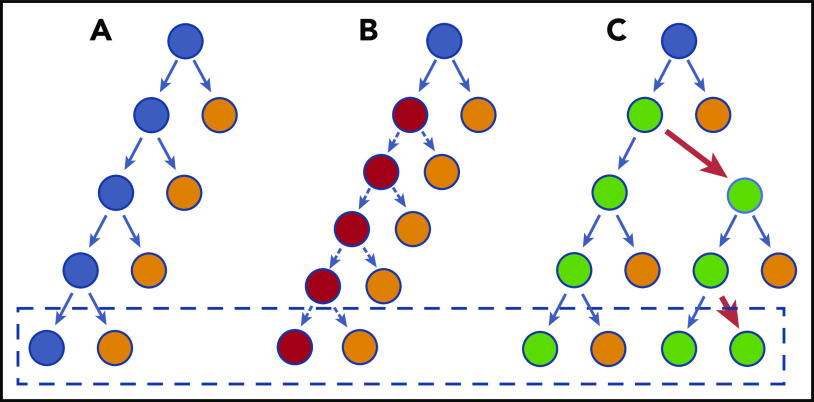
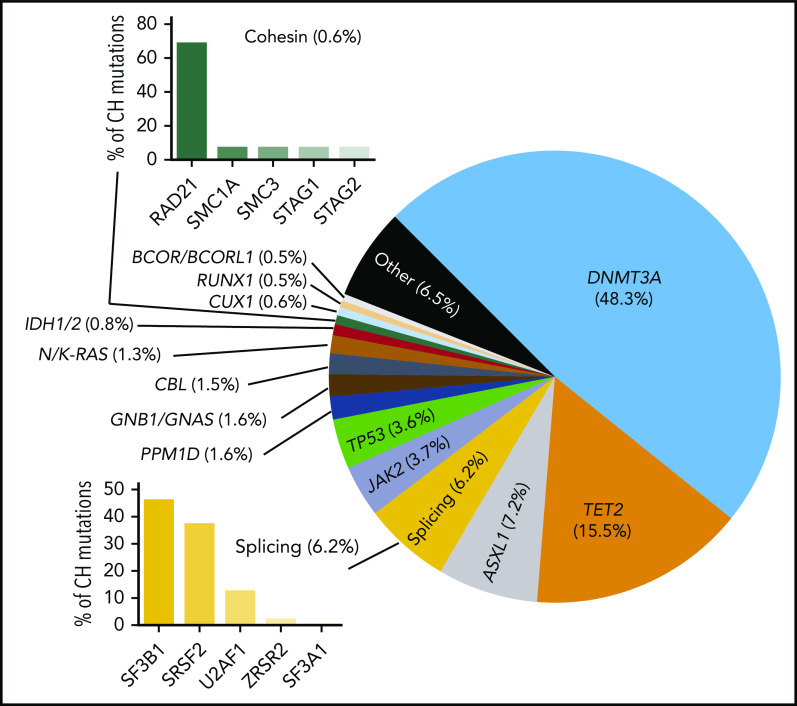
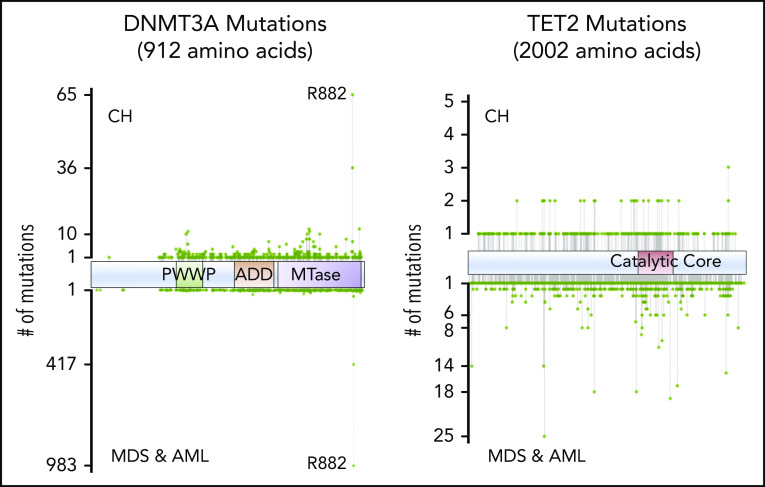
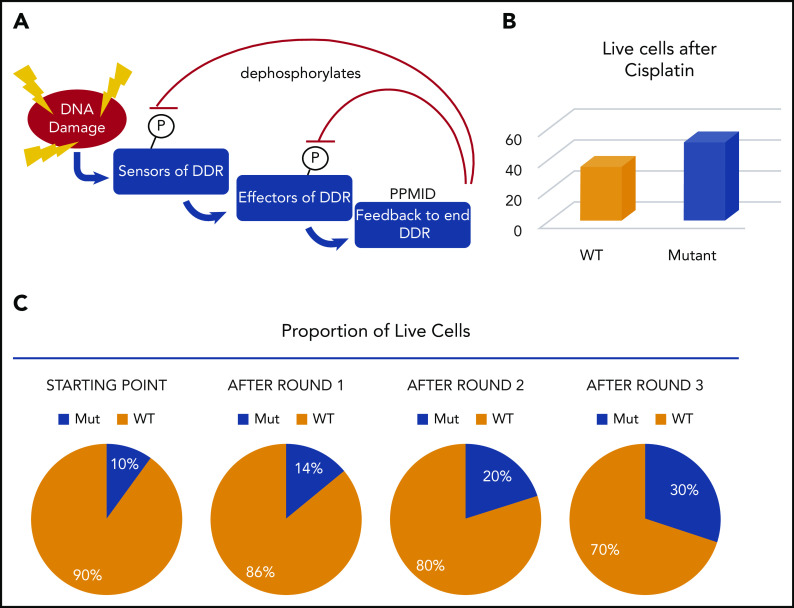
The discovery of clonal hematopoiesis (CH) in older individuals has changed the way hematologists and stem cell biologists view aging. Somatic mutations accumulate in stem cells over time. While most mutations have no impact, some result in subtle functional differences that ultimately manifest in distinct stem cell behaviors. With a large pool of stem cells and many decades to compete, some of these differences confer advantages under specific contexts. Approximately 20 genes are recurrently found as mutated in CH, indicating they confer some advantage. The impact of these mutations has begun to be analyzed at a molecular level by modeling in cell lines and in mice. Mutations in epigenetic regulators such as DNMT3A and TET2 confer an advantage by enhancing self-renewal of stem and progenitor cells and inhibiting their differentiation. Mutations in other genes involved in the DNA damage response may simply enhance cell survival. Here, we review proposed mechanisms that lead to CH, specifically in the context of stem cell biology, based on our current understanding of the function of some of the CH-associated genes.


Conflict of interest statement

Conflicts-of-interest disclosure: M.A.G. and G.A.C. declare no competing financial interests.

Figures

None
Graphical abstract
Figure 1.
Figure 1.
Schematic of development of CH. At birth, the HSC pool is relatively uniform. Over time, somatic mutations accumulate at a rate of ∼10 per year such that all HSCs are slightly different in early adults. These differences manifest in disadvantages and advantages for survival and contribution to peripheral blood production, resulting in some HSCs that “win” with advanced age (red cells at the far right). While expanded clones can be detected in middle age with sensitive sequencing techniques, the current accepted definition is when a clone reaches a proportion of ∼4% of cells measured in the peripheral blood. This equates to a variant allele frequency (VAF) of 2% when the variants (mutations) are heterozygous.
Figure 2.
Figure 2.
Model of HSC divisions that can result in CH. (A) There is a balance between regeneration of stem cells (blue) and differentiated cells (orange). This schematic does not necessarily imply an asymmetric division, but depicts the net result of the stem cell decisions (dashed box). (B) A stem cell divides faster, but each decision has the same net outcome as in panel A. Therefore, the net, after more cell divisions, does not increase the stem cell pool and does not outcompete normal HSCs. (C) The HSC has a slight bias toward self-renewal. Every few divisions (red arrows), it generates an imbalance such that the net, over time, is generation of more stem cells. The speed with which it results in truly biased outputs will depend on the frequency of imbalanced decisions. For most CH genes, this is probably a very subtle bias initially, explaining the very long time lag for CH to become apparent.
Figure 3.
Figure 3.
Proportion of common CH mutations in individuals in which a driver can be identified. These vary from study to study, but the general proportions are indicated.
Figure 4.
Figure 4.
Positions of common variants in DNMT3A and TET2, comparing CH and AML/myelodysplastic syndrome (MDS).
Figure 5.
Figure 5.
PPM1D mutations contribute to CH by suppressing the DDR and enhancing cell survival. (A) Schematic of the DDR and the role of PPM1D in dephosphorylating the positive regulators of DDR. (B) After 1 round of cisplatin treatment, 16% more PPM1D-mutant cells were alive. (C) If mutant cells start as 10% of the population, after each round of cisplatin, 16% more cells are surviving. This compounds in each round such that the proportion climbs to ∼30% after only 3 rounds. In patients, the mutant cells would be represented as 1 or a few HSCs but would still increase dramatically over time.

References

    1. Catlin SN, Guttorp P, Abkowitz JL. The kinetics of clonal dominance in myeloproliferative disorders. Blood. 2005;106(8):2688-2692. - PMC - PubMed
    1. Xu J, Wang Y, Guttorp P, Abkowitz JL. Visualizing hematopoiesis as a stochastic process. Blood Adv. 2018;2(20):2637-2645. - PMC - PubMed
    1. Lee-Six H, Øbro NF, Shepherd MS, et al. . Population dynamics of normal human blood inferred from somatic mutations. Nature. 2018;561(7724):473-478. - PMC - PubMed
    1. Watson CJ, Papula AL, Poon GYP, et al. . The evolutionary dynamics and fitness landscape of clonal hematopoiesis. Science. 2020;367(6485):1449-1454. - PubMed
    1. Welch JS, Ley TJ, Link DC, et al. . The origin and evolution of mutations in acute myeloid leukemia. Cell. 2012;150(2):264-278. - PMC - PubMed

MeSH terms