. 2021 Aug;17(8):1962-1977.
doi: 10.1080/15548627.2020.1804683. Epub 2020 Aug 18.

HFE inhibits type I IFNs signaling by targeting the SQSTM1-mediated MAVS autophagic degradation

Affiliations

HFE inhibits type I IFNs signaling by targeting the SQSTM1-mediated MAVS autophagic degradation

Juan Liu et al. Autophagy. 2021 Aug.

Erratum in

  • Correction.
    [No authors listed] [No authors listed] Autophagy. 2025 Jun;21(6):ii-iii. doi: 10.1080/15548627.2022.2122346. Epub 2022 Oct 12. Autophagy. 2025. PMID: 36224706 Free PMC article. No abstract available.

Abstract

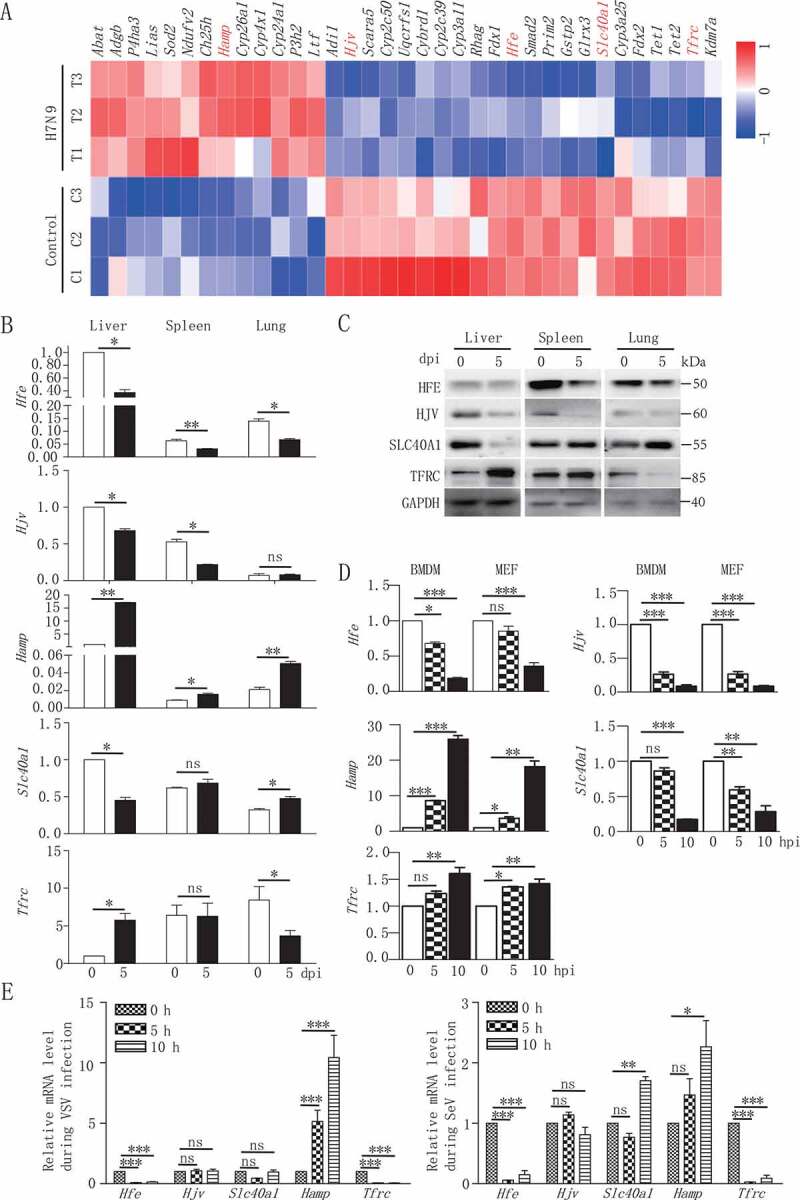
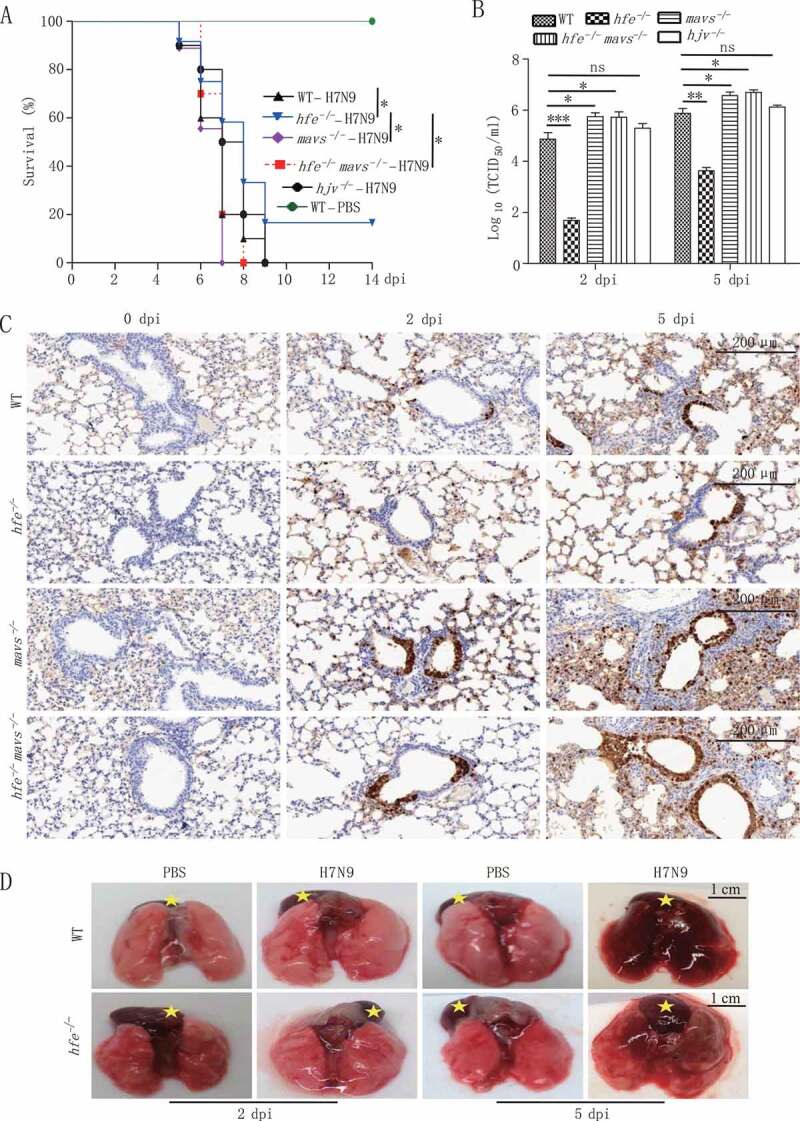
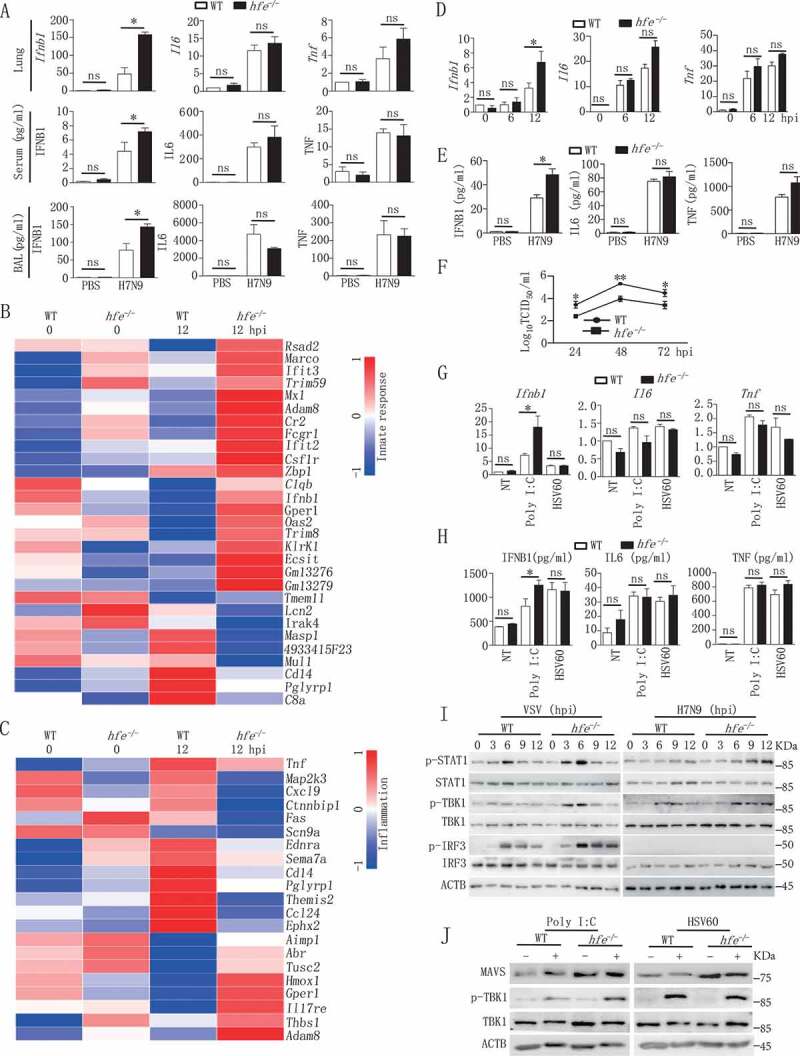
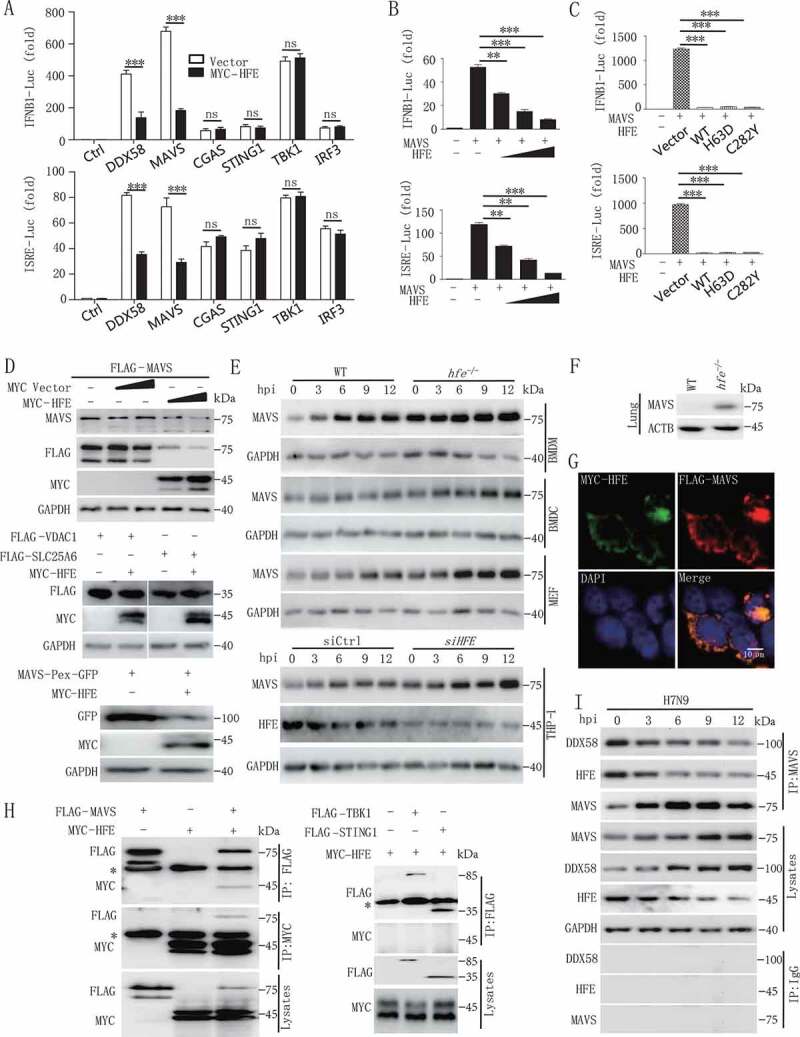
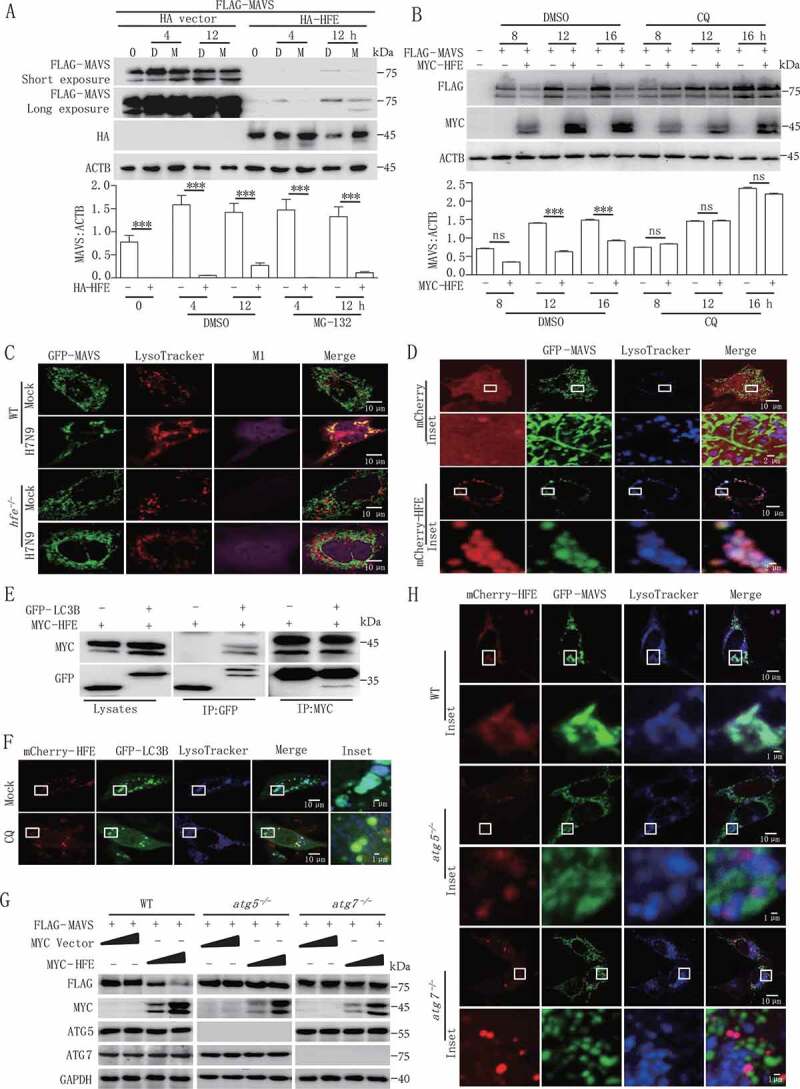
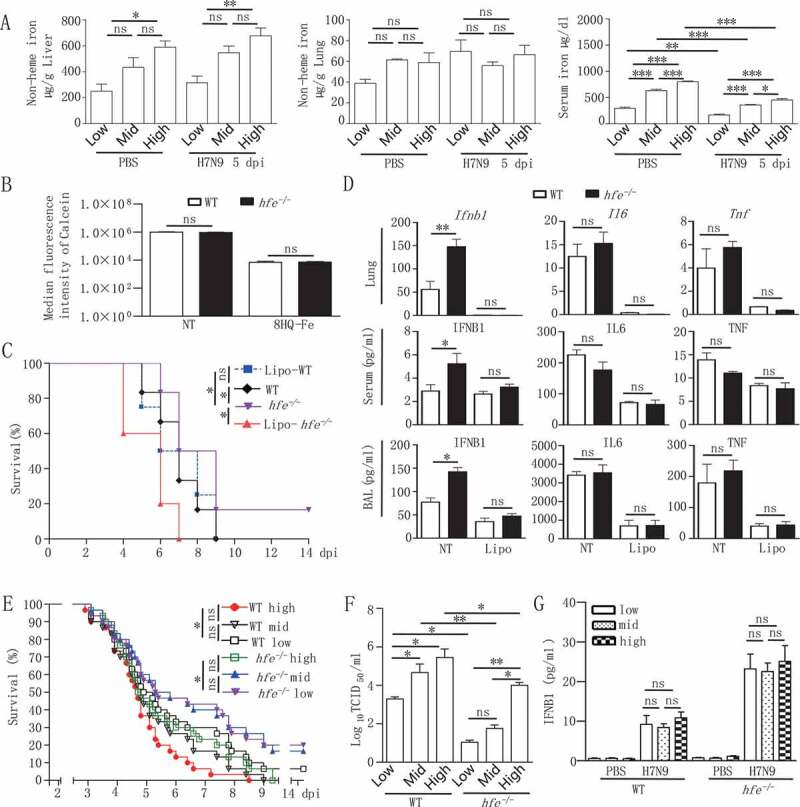
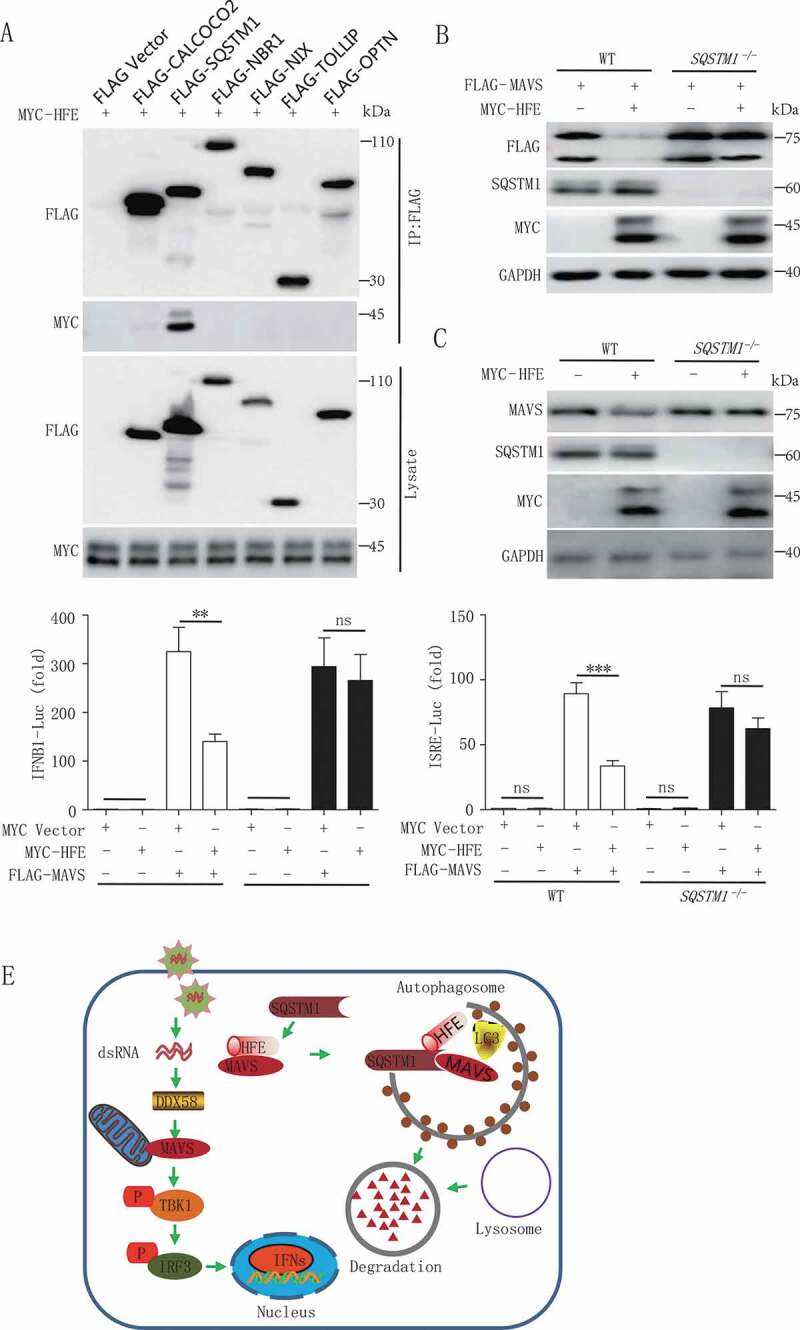
Iron metabolism is involved in numerous physiological processes such as erythropoiesis, oxidative metabolism. However, the in vivo physiological functions of the iron metabolism-related gene Hfe in immune response during viral infection remain poorly understood. Here, we identified 5 iron metabolism-associated genes specifically affected during RNA virus infection by a high-throughput assay and further found that HFE was a key negative regulator of RIG-I-like receptors (RLR)-mediated type I interferons (IFNs) signaling. RNA virus infection inhibited the binding of HFE to MAVS (mitochondrial antiviral signaling protein) and blocked MAVS degradation via selective autophagy. HFE mediated MAVS autophagic degradation by binding to SQSTM1/p62. Depletion of Hfe abrogated the autophagic degradation of MAVS, leading to the stronger antiviral immune response. These findings established a novel regulatory role of selective autophagy in innate antiviral immune response by the iron metabolism-related gene Hfe. These data further provided insights into the crosstalk among iron metabolism, autophagy, and innate immune response.Abbreviations: ATG: autophagy-related; BAL: bronchoalveolar lavage fluid; BMDMs: bone marrow-derived macrophages; CGAS: cyclic GMP-AMP synthase; CQ: chloroquine; Dpi: days post-infection; ELISA: enzyme-linked immunosorbent assay; GFP: green fluorescent protein; HAMP: hepcidin antimicrobial peptide; Hpi: hours post-infection; HJV: hemojuvelin BMP co-receptor; IFNs: interferons; IL6: interleukin 6; IRF3: interferon regulatory factor 3; ISRE: interferon-stimulated response element; Lipo: clodronate liposomes; MAP1LC3B/LC3B: microtubule-associated protein 1 light chain 3 beta; MAVS: mitochondrial antiviral signaling protein; MEFs: mouse embryonic fibroblasts; SLC40A1/FPN1: solute carrier family 40 (iron-regulated transporter), member 1; flatiron; SQSTM1/p62: sequestosome 1; STAT1: signal transducer and activator of transcription 1; STING1/STING: stimulator of interferon response cGAMP interactor 1; TBK1: TANK-binding kinase 1; TFRC/TfR1: transferrin receptor; TNF/TNFα: tumor necrosis factor; WT: wild type.

Keywords: Autophagy; HFE; MAVS degradation; RNA virus; innate immune; iron metabolism.


Conflict of interest statement

No potential conflict of interest was reported by the authors.

Figures

Figure 1.
Figure 1.
Reduced expression of Hfe is associated with H7N9 virus infection. (A) Microarray analysis of differentially expressed genes at 12 hpi in mouse BMDMs infected with H7N9 virus. The heatmap showed the abundance of iron homeostasis-regulating genes following H7N9 virus infection. Untreated macrophages were used as controls. Data are representative of three independent experiments. (B and D) qRT-PCR was performed at the indicated time points to measure the mRNA levels of Hfe, Slc40a1, Hamp, Hjv and Tfrc in various tissues in mice infected with H7N9 virus (B) and in mouse BMDMs and MEFs infected with H7N9 virus (D). (C) Immunoblot analysis of the indicated proteins in lysates of various tissues in mice infected with H7N9 virus. (E) Mice alveolar epithelial cells were infected with VSV, SeV for the indicated times, and qRT-PCR was used to measure the Hfe, Hjv, Slc40a1, Hamp, Tfrc mRNA level. All qRT-PCR data are normalized to the Actb gene and are representative of three independent experiments. Control group is used as a reference. The error bars represent the standard deviation, and differences between the experimental and control groups were determined by one-way ANOVA (*p < 0.05, **p < 0.01, and ***p < 0.001)
Figure 2.
Figure 2.
Hfe deficiency protects mice from influenza virus H7N9 infection. (A) The survival of H7N9 virus-infected WT, hfe−/-, mavs−/-, hfe−/- mavs−/- and hjv−/- mice were monitored for 14 d (n = 12 per group). (B) Viral titers in the lung were quantified at 2 or 5 dpi by TCID50 assay (n = 3 per group). (C) Immunohistochemical analysis of the influenza virus proteins NP at 2 or 5 dpi in the lungs of WT, hfe−/-, mavs−/-, hfe−/- mavs−/- mice infected with H7N9 virus. Scale bars: 200 μm. (D) WT and hfe−/- mice were infected with H7N9 for the indicated number of days, and their lung pathology was observed by the indicate of stars (scale bars: 1 cm). The error bars represent standard deviations, and differences between the experimental and control groups are determined by 2-way ANOVA and the mouse survival study, Kaplan-Meier survival curves are generated and analyzed by Log-Rank test (*p < 0.05, **p < 0.01 and ***p < 0.001)
Figure 3.
Figure 3.
Hfe deficiency enhances type I IFNs induction in response to H7N9 virus infection. (A) The mRNA transcription of the genes Ifnb1, Il6 and Tnf in the lungs of H7N9 virus-infected WT and hfe−/- mice were analyzed by qRT-PCR at 2 dpi. The concentrations of IFNB1, IL6 and TNF were evaluated in the serum and BAL at 2 dpi (n = 5). (B and C) The heatmaps showed 30 genes that were differentially expressed in the BMDMs of H7N9 virus-infected WT and hfe−/- mice and that were involved in the innate response (B) and inflammation (C). (D and E) qRT-PCR and ELISA analysis of the mRNA and expression of the genes Ifnb1, Il6 and Tnf in BMDMs infected with H7N9 virus at the indicated time points. (F) TCID50 was used to measure the H7N9 virus titers in the supernatants of WT and hfe−/- BMDMs infected with H7N9 virus. (G and H) qRT-PCR and ELISA analyzed the mRNA and expression of the genes Ifnb1, Il6 and Tnf in BMDMs of WT or hfe−/- mice transfected with poly (I:C) (1 μg/ml) or HSV60 (1 μg/ml) for 4 h. (I) Immunoblot analysis of the indicated proteins in lysates of WT and hfe−/- BMDMs infected with VSV or H7N9 virus. (J) Immunoblot analysis of the indicated proteins in lysates of WT and hfe−/- BMDMs transfected with poly (I:C) (1 μg/ml) or HSV60 (1 μg/ml) for 4 h. All qRT-PCR data are normalized to the Actb gene and used the control group as a reference. Data are representative of at least three independent experiments, and differences between the experimental and control groups are determined by 2-way ANOVA (*p < 0.05, **p < 0.01, and ***p < 0.001)
Figure 4.
Figure 4.
HFE inhibits type I IFNs signaling by promoting the degradation of MAVS. (A) Luciferase assay of HEK293T cells transfected with the IFNB1 or ISRE reporter plasmids together with DDX58, MAVS, CGAS, STING1, TBK1, or IRF3 and with or without the HFE plasmid. (B) The promoter activity of IFNB1 and ISRE was evaluated in HEK293T cells co-transfected with plasmids expressing MAVS and different doses of HFE. (C) The effect of HFE-WT, HFEH63D, and HFEC282Y on the activity of MAVS was measured by luciferase assay in HEK293T cells. (D) Immunoblot analysis of MAVS or MAVS-Pex (indicating MAVS on peroxisomes) or VDAC1 or SLC25A6 probed with anti-MAVS or GFP or FLAG antibody in lysates of HEK293T cells transfected with different doses of HFE. (E) Immunoblot analysis of MAVS in lysates of WT and hfe−/- BMDMs, BMDCs, and MEF and HFE knockdown THP-1 cells. THP-1 cells were transfected with small interfering RNA (siRNA) targeting HFE for 36 h. These tested cells were infected with H7N9 virus. (F) Immunoblot analysis of MAVS in lysates of lung from WT and hfe−/- mice. (G) Confocal microscopy of HEK293T cells transfected for 24 h with FLAG-MAVS and MYC-HFE. Immunofluorescence was performed using anti-MYC (green) and anti-FLAG (red) antibodies and DAPI (blue). Scale bars: 10 μm. (H) Immunoblot analysis of lysates of HEK293T cells transfected with plasmids encoding FLAG-MAVS, FLAG-TBK1, FLAG-STING1 and MYC-HFE for 24 h followed by immunoprecipitation with anti-FLAG or anti-MYC antibodies. The asterisk indicated the heavy chains. (I) Immunoprecipitation analysis of the interaction between endogenous MAVS and HFE in H7N9-infected BMDMs for the indicated times. Data are representative of three independent experiments, and differences between the experimental and control groups are determined by 2-way ANOVA in (A) and One-way ANOVA in (B and C) (***p < 0.001)
Figure 5.
Figure 5.
HFE acts as a novel suppressor of MAVS stability through the autophagy-lysosome pathway. (A and B) HEK293T cells were transfected with FLAG-MAVS and HA-HFE plasmids for 24 h and then treated with 20 μM MG132 (M) (A) or 50 µM CQ (B) for the indicated times. The total cell lysates were immunoblotted with the indicated antibodies. (C) Confocal microscopy of WT and hfe−/- BMDMs transfected with GFP-Mavs (green) and stained with LysoTracker Red DND-99 (red) after H7N9 virus infection for 18 h. Scale bars, 10 μm. (D) Confocal microscopyof hfe−/- BMDMs transfected with mCherry-Hfe (red) and GFP-Mavs (green) for 24 h and then stained with LysoTracker Deep Red (blue) for 2 h. Scale bars: 10 μm (1 μm in the inset). (E) MYC-HFE and GFP-LC3B were co-transfected into HEK293T cells. Immunoprecipitation and immunoblotting analysis of the lysates were performed with various combinations of anti-MYC anti-FLAG and anti-GFP antibodies. (F) hfe−/- BMDMs transfected with the mCherry-Hfe (red) expression vector and GFP-Lc3b (green). These BMDMs were stained with LysoTracker Deep Red (blue) for 2 h after treated with 50 μM CQ for another 12 h. Scale bars: 10 μm (1 μm in the inset). (G) Immunoblotting analysis of FLAG-MAVS in lysates of WT, atg5−/- and atg7 −/- cells transfected with different doses of MYC-Hfe. The total cell lysates were immunoblotted with the indicated antibodies. (H) WT, atg5−/- and atg7 −/- MEFs were co-transfected with GFP-Mavs (green) and mCherry-Hfe (red). Cells were stained 24 h later with LysoTracker Deep Red (blue) for 2 h and subjected to confocal microscopy. Scale bars: 10 μm (1 μm in inset). Data are representative of at least three independent experiments, and differences between the experimental and control groups are determined by 2-way ANOVA (***p < 0.001)
Figure 6.
Figure 6.
Hfe deficiency resistance to virus infection is macrophage-dependent and not affected by dietary iron. (A) The hfe−/- mice were fed low, medium and high dietary iron for 14 d, and infected with H7N9 virus. Iron levels in serum, liver and lung were measured with ELISA (n = 5 per group). (B) Flow cytometry analysis of the median fluorescence intensity of calcein in peritoneal macrophages from WT and hfe−/- mice. (C) The survival of H7N9 virus-infected WT and hfe−/- mice with or without Lipo treatment for 48 h was monitored for 14 d (n = 10 per group). (D) The mRNA levels of the indicated genes in the lungs of WT and hfe−/- mice with or without Lipo treatment for 48 h were analyzed by qRT-PCR at 2 dpi. ELISA was used for evaluating the concentrations of the indicated cytokines in the serum and BAL at 2 dpi (n = 5). (E) The survival of H7N9 virus-infected WT and hfe−/- mice fed low, medium and high dietary iron was monitored for 14 d (n = 10 per group). (F) Viral titers in lung were quantified at 5 dpi by TCID50 assay (n = 3 per group). (G) The concentrations of the IFNB1 in the serum of WT mice fed with low, medium and high iron when infected with H7N9 virus for 5 d (n = 3 per group). Data are representative of at least three independent experiments, and the error bars represent the standard deviation. Differences between the experimental and control groups are determined by 2-way ANOVA and the mouse survival study, Kaplan-Meier survival curves are generated and analyzed by Log-Rank test (*p < 0.05, **p < 0.01 and ***p < 0.001)
Figure 7.
Figure 7.
HFE interaction with SQSTM1 facilitates MAVS autophagic degradation. (A) HFE interaction with SQSTM1 but not CALCOCO2, NBR1, NIX, TOLLIP and OPTN. HEK293T cells were transfected with vectors encoding MYC-HFE and indicated Flag-tagged cargo receptors, followed by co-immunoprecipitation with anti-FLAG antibody and immunoblot analysis with anti-MYC antibody. (B and C) MAVS degradation via SQSTM1. WT and SQSTM1 KO (−/-) 293 T cells were transfected with only MYC-HFE or FLAG-MAVS and MYC-HFE plasmids. Cell lysates were subjected to immunoblot analysis. (D) Luciferase assay of IFNB1 or ISRE. HEK293T WT and SQSTM1 KO cells were co-transfected with the IFNB1 or ISRE reporter plasmid together with MAVS in the presence or absence of HFE plasmid. Data are representative of at least three independent experiments, and differences between the experimental and control groups are determined by 2-way ANOVA (**p < 0.01, ***p < 0.001). (E) A proposed working model to illustrate how HFE negatively regulates type I IFNs signaling during RNA virus infection

References

    1. Cassat JE, Skaar EP.. Iron in infection and immunity. Cell Host Microbe. 2013;13(5):509–519. - PMC - PubMed
    1. Ramalingam TS, West AP Jr., Lebron JA, et al. Binding to the transferrin receptor is required for endocytosis of HFE and regulation of iron homeostasis. Nat Cell Biol. 2000;2(12):953–957. - PubMed
    1. Roy CN, Carlson EJ, Anderson EL, et al. Interactions of the ectodomain of HFE with the transferrin receptor are critical for iron homeostasis in cells. FEBS Lett. 2000;484(3):271–274.. - PubMed
    1. Salter-Cid L, Peterson PA, Yang Y. The major histocompatibility complex-encoded HFE in iron homeostasis and immune function. Immunol Res. 2000;22(1):43–59. - PubMed
    1. Wu XG, Wang Y, Wu Q, et al. HFE interacts with the BMP type I receptor ALK3 to regulate hepcidin expression. Blood. 2014;124(8):1335–1343. - PMC - PubMed

Publication types

MeSH terms