. 2020 Aug 3;39(1):147.
doi: 10.1186/s13046-020-01632-9.

PDCD6 cooperates with C-Raf to facilitate colorectal cancer progression via Raf/MEK/ERK activation

Affiliations

PDCD6 cooperates with C-Raf to facilitate colorectal cancer progression via Raf/MEK/ERK activation

Xiaojuan Wang et al. J Exp Clin Cancer Res. .

Abstract

Background: Colorectal cancer (CRC) is one of the most common malignancies, and it's expected that the CRC burden will substantially increase in the next two decades. New biomarkers for targeted treatment and associated molecular mechanism of tumorigenesis remain to be explored. In this study, we investigated whether PDCD6 plays an oncogenic role in colorectal cancer and its underlying mechanism.

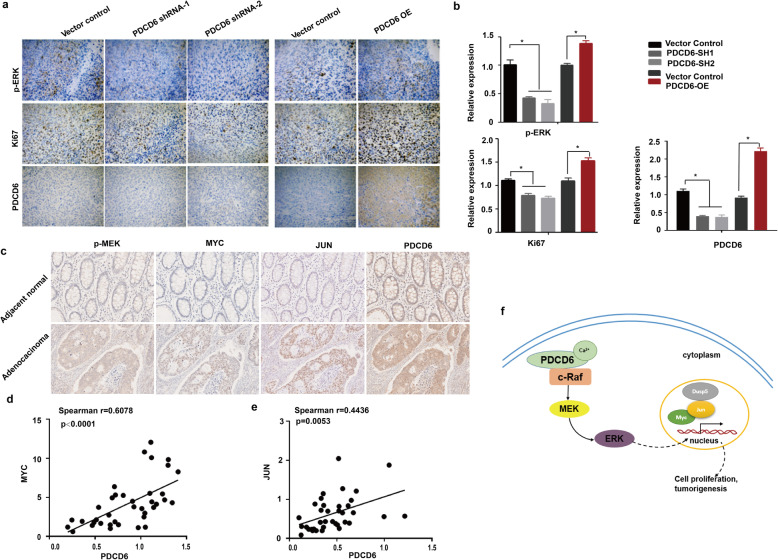
Methods: Programmed cell death protein 6 (PDCD6) expression in CRC samples were analyzed by immunohistochemistry and immunofluorescence. The prognosis between PDCD6 and clinical features were analyzed. The roles of PDCD6 in cellular proliferation and tumor growth were measured by using CCK8, colony formation, and tumor xenograft in nude mice. RNA-sequence (RNA-seq), Mass Spectrum (MS), Co-Immunoprecipitation (Co-IP) and Western blot were utilized to investigate the mechanism of tumor progression. Immunohistochemistry (IHC) and quantitative real-time PCR (qRT-PCR) were performed to determine the correlation of PDCD6 and MAPK pathway.

Results: Higher expression levels of PDCD6 in tumor tissues were associated with a poorer prognosis in patients with CRC. Furthermore, PDCD6 increased cell proliferation in vitro and tumor growth in vivo. Mechanistically, RNA-seq showed that PDCD6 could affect the activation of the MAPK signaling pathway. PDCD6 interacted with c-Raf, resulting in the activation of downstream c-Raf/MEK/ERK pathway and the upregulation of core cell proliferation genes such as MYC and JUN.

Conclusions: These findings reveal the oncogenic effect of PDCD6 in CRC by activating c-Raf/MEK/ERK pathway and indicate that PDCD6 might be a potential prognostic indicator and therapeutic target for patients with colorectal cancer.

Keywords: Colorectal cancer; Growth; MAPK signaling pathway; PDCD6.


Conflict of interest statement

The authors declare that they have no competing interests.

Figures

Fig. 1
Fig. 1
PDCD6 is overexpressed in colorectal tumors and its overexpression is associated with poor prognosis in patients with colorectal tumors. a. GEPIA database analysis of PDCD6 expression in 623 patients with CORD and 410 patients with READ. b. Relative mRNA levels of PDCD6 in CRC patients was analyzed by qRT-PCR. The data are presented as means ±SDs; N = 22, and ***, P < 0.001. c. Representative immunohistochemical staining of PDCD6 on tissue microarrays containing CRC tissues and adjacent normal tissues. d. Tissue microarray data analysis of PDCD6 expression in 93 patients with CRC. The data are presented as the means ±SDs; N = 93; and ***, P < 0.001. e. Immunofluorescence staining of PDCD6 in patients with CRC tissues and adjacent normal tissues. f. Kaplan-Meier survival analysis of the correlation between PDCD6 expression and disease-free survival (DFS) in 423 patients with CRC. N = 423; DFS: P = 0.0103
Fig. 2
Fig. 2
PDCD6 inactivation decreases tumor cell growth in vitro and in vivo.a. RT-PCR expression analysis of PDCD6 mRNA in HCT116 and HCT15 cell lines. The data are presented as the means ± SDs, N = 3; and ***, P < 0.0001. b. Immunoblotting of PDCD6 protein expression in HCT116 and HCT15 cell lines. c. Cell proliferation assays. The samples were assayed in triplicate. Each datapoint is the mean value of three independent samples. d. Colony formation assays. The representative images and bar graphs are from three independent experiments. The data are presented as the means ± SDs, N = 3; *P < 0.05; and **, P < 0.01. e. Images of xenograft tumors. The tumors were removed and photographed. N = 6. f. Growth curves of xenograft tumors. Tumor volumes were monitored every 3 days by measuring tumor diameters. The data are presented as the means ± SDs; N = 6. g. Weights of xenograft tumors. The tumors were removed, photographed, and weighed. The bar graphs show the means ± SDs; N = 6; ***, P < 0.001; and ****, P < 0.0001
Fig. 3
Fig. 3
PDCD6 overexpression promotes colorectal cancer growth. a. RT-PCR expression analysis of PDCD6 mRNA in HCT116 and HCT15 cell lines. The data are presented as the means ± SDs; N = 3; and ***, P < 0.0001. b. Immunoblotting of PDCD6 protein expression in HCT116 and HCT15 cell lines. c. Cell proliferation assays. The samples were assayed in triplicate. Each datapoint is the mean value of three independent samples. d. Colony formation assays. The representative images and bar graphs are from three independent experiments. The data are presented as the means ± SDs; N = 3; *, P < 0.05; and **, P < 0.01. e. Images of xenograft tumors. The tumors were removed and photographed. f. Growth curves of xenograft tumors. Tumor volumes were monitored every 3 days by measuring tumor diameters. The data are presented as the means ± SDs; N = 6. g. Weights of xenograft tumors. The tumors were removed, photographed, and weighed the bar graphs show the means ± SDs; N = 6; and **, P < 0.01
Fig. 4
Fig. 4
Suppression of PDCD6 expression attenuates MAPK signaling pathway activity. a. A heatmap of differentially expressed genes in PDCD6-knockdown and control HCT15 cells that were generated using R software. The log2 values were calculated for each sample by normalizing the data to the number of reads alone (P < 0.05). b. The functional category based on gene ontology (GO) term enrichment. c. The signaling pathway based on KEGG enrichment analysis of signal transduction pathway sub-categories. d. Functionally grouped networks based on KEGG pathway analysis. The genes are presented for the PDCD6-KD and control cells. e. Gene set enrichment analysis (GSEA) of genes involved in cell proliferation in HCT15 PDCD6 knock-down cells with the gene sets corresponding to the MAPK signaling pathway in the KEGG database (NES Score = 0.05 and FDR = 0.10). f. A heatmap, which was generated using R software, of MAPK signaling pathway-related genes that were differentially expressed in HCT15 vector control and PDCD6 knock-down cells using R software. The log2 values were calculated for each sample by normalizing the data to the number of reads alone (p < 0.05 and FDR < 0.05). g. Quantitative real-time PCR analysis of the relative mRNA expression of MYC, JUN, DUSP5, GADD45B, PTPN7, NFATC1, RASGFR2, PLA2G4A, MECOM and PDCD6 in control and PDCD6-knockdown HCT15 cells normalized to actin expression (means± SDs, t-test, and *, p < 0.05). The experiments were repeated three times
Fig. 5
Fig. 5
PDCD6 is physically associated with c-Raf and activates the MAPK/ERK signaling pathways in CRC cells. a. Coimmunoprecipitation assays using anti-PDCD6 antibody and anti-c-Raf antibodies showed that PDCD6 interacts with c-Raf in HCT116 cells. b. Confocal IF staining of PDCD6(green) and c-Raf (red) in HCT116 cells. The nuclei were stained by DAPI (blue). The results from one of two comparable experiments are shown. c. HCT116 cell lysate was immunoprecipitated with anti-PDCD6 and anti-c-Raf antibodies in the presence, and absence of EDTA. d. Immunoblot analysis of the expression of PDCD6 and the total and phosphorylated levels of c-Raf/MEK/ERK in HCT116 cells with PDCD6 knocked down and overexpression. Tubulin was used as a loading control. Bands were quantified with ImageJ software. e. Immunoblot analysis of PDCD6 the total and phosphorylated level of c-Raf/MEK/ERK in HCT116 cells overexpressing PDCD6 in the presence of the Ca2+ chelator BAPTM. f. Immunoblot analysis of PDCD6, total MEK/ERK and phosphorylated MEK/ERK in cells with PDCD6-OE, PDCD6-OE + RAF709 (R) and PDCD6-OE + Trametinib (Tr), respectively. Tubulin was used as a loading control
Fig. 6
Fig. 6
The positive correlation between PDCD6 and c-Raf/MEK/ERK signaling pathway in tumor tissues from xenografts and patients with CRC. a. Representative immunohistochemistry images of the expression of PDCD6, Ki67, and p-ERK in xenograft tumors from nude mice subcutaneously injected with HCT116 cells. *, P < 0.05. b. Statistical analysis of protein relative expression in A. c. Representative immunohistochemical staining of p-MEK, MYC, JUN, and PDCD6 from CRC tissues and adjacent normal tissues. d and e. Correlation analysis for the expression of PDCD6, MYC and JUN in 38 tissues of patients with CRC. f. A model showing the mechanisms of PDCD6-mediated colorectal cancer cell proliferation

References

    1. Guo Y, Bao Y, Yang W. Regulatory miRNAs in Colorectal Carcinogenesis and Metastasis. Int J Mol Sci. 2017;18:4. - PMC - PubMed
    1. Arnold M, Sierra MS, Laversanne M, Soerjomataram I, Jemal A, Bray F. Global patterns and trends in colorectal cancer incidence and mortality. Gut. 2017;66(4):683–691. - PubMed
    1. Siegel RL, Miller KD, Fedewa SA, Ahnen DJ, Meester RGS, Barzi A, Jemal A. Colorectal cancer statistics, 2017. CA Cancer J Clin. 2017;67(3):177–193. - PubMed
    1. Kim EK, Choi EJ. Compromised MAPK signaling in human diseases: an update. Arch Toxicol. 2015;89(6):867–882. - PubMed
    1. Eleveld TF, Schild L, Koster J, Zwijnenburg DA, Alles LK, Ebus ME, Volckmann R, Tijtgat GA, van Sluis P, Versteeg R, et al. RAS-MAPK pathway-driven tumor progression is associated with loss of CIC and other genomic aberrations in neuroblastoma. Cancer Res. 2018;78(21):6297–6307. - PubMed

MeSH terms