. 2020 Aug 3;3(10):e202000762.
doi: 10.26508/lsa.202000762. Print 2020 Oct.

Genome-wide R-loop analysis defines unique roles for DDX5, XRN2, and PRMT5 in DNA/RNA hybrid resolution

Affiliations

Genome-wide R-loop analysis defines unique roles for DDX5, XRN2, and PRMT5 in DNA/RNA hybrid resolution

Oscar D Villarreal et al. Life Sci Alliance. .

Abstract

DDX5, XRN2, and PRMT5 have been shown to resolve DNA/RNA hybrids (R-loops) at RNA polymerase II transcription termination sites at few genomic loci. Herein, we perform genome-wide R-loop mapping using classical DNA/RNA immunoprecipitation and high-throughput sequencing (DRIP-seq) of loci regulated by DDX5, XRN2, and PRMT5. We observed hundreds to thousands of R-loop gains and losses at transcribed loci in DDX5-, XRN2-, and PRMT5-deficient U2OS cells. R-loop gains were characteristic of highly transcribed genes located at gene-rich regions, whereas R-loop losses were observed in low-density gene areas. DDX5, XRN2, and PRMT5 shared many R-loop gain loci at transcription termination sites, consistent with their coordinated role in RNA polymerase II transcription termination. DDX5-depleted cells had unique R-loop gain peaks near the transcription start site that did not overlap with those of siXRN2 and siPRMT5 cells, suggesting a role for DDX5 in transcription initiation independent of XRN2 and PRMT5. Moreover, we observed that the accumulated R-loops at certain loci in siDDX5, siXRN2, and siPRMT5 cells near the transcription start site of genes led to antisense intergenic transcription. Our findings define unique and shared roles of DDX5, XRN2, and PRMT5 in DNA/RNA hybrid regulation.


Conflict of interest statement

The authors declare that they have no conflict of interest.

Figures

Figure 1.
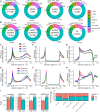
Figure 1.. Genome-wide R-loops in DDX5, XRN2, and PRMT5 knockdown cells.
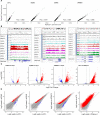
(A) U2OS cells were transfected with siRNAs for control (CTL), DDX5, XRN2, and PRMT5 and cell lysates were separated by SDS–PAGE and immunoblotted with the indicated antibodies to confirm successful knockdowns. β-Actin was used as a loading control. (B) Total read counts within R-loop peaks in each knockdown condition, normalized to library size, and averaged for the two biological replicates. Peaks called by the MACS algorithm v2.2.6 in broad mode (q-value < 0.1) for each replicate were merged into a consensus list across all treatments through DiffBind v2.14.0. Error bars denote SD of the replicates. (C) Read coverage of a representative peak profile with a gain in R-loop signal relative to siCTL at the RFNG-GPS1-DUS1L gene loci for all cells, generated by Integrative Genomic Viewer v2.8.0. DNA extracted the control DNA treated with RNase-H (black); siCTL cells (cyan); siDDX5 (red); siPRMT5 (magenta); and siXRN2 (green).
Figure S1.
Figure S1.
R-loop signal reproducibility and comparison within consensus and representative peaks. (A) Scatter plots of read counts normalized to library size within the R-loop consensus peaks showing the reproducibility and Pearson correlation coefficient between the biological replicates (termed “A” and “B”) of siCTL, siDDX5, siXRN2, and siPRMT5 U2OS cells. (B) Read coverage of representative peak profiles with R-loop signal gain, showing the FOS (left), SSTR5 (center), and SPIB-MYBPC2 (right) gene loci, generated by Integrative Genomic Viewer v2.8.0. Control cells are cyan; cells were treated with RNase H (black), siDDX5 (red), siPRMT5 (magenta), or siXRN2 (green). (C) Volcano plots of differential R-loop signal relative to siCTL in the consensus list of peaks, highlighting significant gains or losses upon knockdown treatment as reported by DESeq2 v1.26.0 (absolute log2 fold change > 1 and false discovery rate < 0.1, Wald test). (D) Scatter plot of log2 normalized mean read concentration within R-loop consensus peaks for each comparison, highlighting significant gains or losses in signal upon the treatment.
Figure S2.
Figure S2.
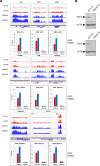
DRIP-qPCR analysis of gain R-loops identified in the DRIP-seq screen. (A) Validation of the hybrid signal (R-loop) obtained in the DRIP-seq analysis using DRIP-qPCR at the indicated loci in siCTL (red) and siDDX5 (blue) U2OS. Upper panels show R-loop signals at each locus obtained by sequencing (Integrative Genomic Viewer) and lower panels indicated the R-loop signals relative to input obtained by DRIP-qPCR at the indicated locus. The bar graphs show the average and SEM from three independent experiments. Statistical significance was assessed using t test. *P < 0.05, **P < 0.01, and ****P < 0.0001. (A, B) Western blotting of protein extract of siCTL and siDDX5 transfected U2OS used for panel (A) for experiment #1 and #2. The migration of DDX5 and β-ACTIN (ACTB, loading control) is shown with an arrowhead.
Figure 2.
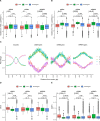
Figure 2.. R-loop gains and losses in siDDX5, siXRN2, and siPRMT5 cells.
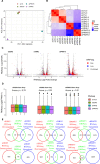
(A) Total amount of R-loop gain and loss consensus peaks called for each knockdown condition relative to siCTL by DESeq2 v1.26.0 (absolute log2 fold change > 1 and false discovery rate < 0.1, Wald test). (B) Venn diagrams showing the overlaps among consensus peaks with gain (top) or loss (bottom) in R-loop signal upon each knockdown condition. (C) Distribution of log2 normalized read concentration within R-loop gain, loss or unchanged consensus peaks at the control (red) and treated (siDDX5, green; siXRN2, cyan; and siPRMT5, purple) cells. Peaks are split into three panels for each knockdown treatment.
Figure S3.
Figure S3.
RNA-seq gene expression analysis in the knockdown treatments. (A) Principal component analysis plot showing the first two principal components of the RNA-seq gene expression results for each knockdown treatment in biological triplicates, quantified through HOMER v4.11.1 and normalized through the regularized logarithm (rlog) transformation of DESeq2 v1.26.0. (B) Same as (A) but displayed as a heat map of the Pearson correlation coefficients between the normalized gene expression of the samples. (C) Volcano plot of the RNA-seq differential expression for the genes lying nearest to the DRIP-seq consensus peaks, highlighting genes that lie near peaks with a gain (red) or loss (blue) in R-loop signal upon the corresponding knockdown treatment. Dashed lines indicate an false discovery rate of 0.05 and absolute log fold change of one. (D) The RNA-seq gene expression for the peaks with a gain in R-loop signal upon knockdown shows no significant difference in distribution among treatments. (E) Venn diagrams for the overlaps between genes lying nearest the R-loop gain peaks and the genes whose RNA-seq expression is up-regulated or down-regulated upon the knockdown treatment relative to the control, as reported by DESeq2 v1.26.0 (absolute log2 fold change > 1 and false discovery rate < 0.05, Wald test).
Figure 3.
Figure 3.. R-loop gains are elevated close to neighboring genes on chromosomes with high gene density.
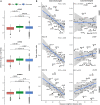
(A) Distribution of distance to the neighboring gene from the DRIP-seq consensus peaks with a gain (red), loss (green), or unchanged (blue) R-loop signal upon each siRNA condition, measured through Bedtools v2.26.0 with Ensembl gene annotation. Definition of neighboring gene is the second nearest gene to the peak. (B) Ratio between the total amount of R-loop gain or loss peaks and the amount of unchanged peaks upon knockdown treatment, as a function of the mean distance from all consensus peaks to their corresponding neighboring (i.e., second nearest) genes, measured separately for each chromosome.
Figure 4.
Figure 4.. Distribution and coverage of DRIP-seq peaks across genomic locations.
(A) Distribution of the peaks with no change in R-loop signal upon any of the knockdown treatments (left; Unchanged) and of the gain peaks upon each of the siDDX5, siXRN2, and siPRMT5 cells. The percentage of the R-loop gain peaks are distributed as 5′-UTR and 3′-UTR; promoter and transcription start site (promoter-TSS); transcription termination site (TTS), and noncoding, intronic, and intergenic peaks. (B) Distribution in percentage of the gain peaks in the intersection of two of three of the knockdown treatments (left) or in all of the knockdown treatments simultaneously (right). (C, D, E, F, G, H) Genome-wide R-loop signal profile for each treatment compared with control (C, E, G) and normalized to siCTL (D, F, H). (C, D, E, F, G, H) DRIP-seq coverage was measured using all reads (C, D), reads overlapping with intergenic regions (E, F), and reads overlapping with introns (G, H) through NGS.PLOT v2.63. (I) Histogram of peaks lying nearer to the TSS or to the TTS of the nearest gene using the full list of consensus peaks (left) or the gain peaks relative to the control (right) measured through HOMER v4.11.1. (J) Percentage of peaks lying nearer to the TSS or to the TTS of the nearest gene. From left to right: full list of consensus peaks; peaks with a gain in siDDX5 only; peaks with a gain in both siDDX5 and siXRN2; peaks with a gain in both siDDX5 and PRMT5; and peaks with a gain in siDDX5, siXRN2, and siPRMT5 cells.
Figure S4.
Figure S4.
R-loop peak enrichment near TSS/TTS or GC-rich areas. (A, B) Distribution of the distances nearest transcription start site or transcription termination site for the R-loop peaks with a gain, loss, or no change upon the knockdown treatments. (C) Histogram of position-dependent nucleotide frequencies for the 4 kb relative to the center of DRIP-seq peaks using the full list of consensus peaks (left) or the gain peaks relative to the control (right) measured through HOMER v4.11.1. (D, E) Distribution of GC-rich (D) or CpG (E) percentage for the genomic regions covering R-loop peak gains, losses, or no change for each of the knockdown treatments.
Figure 5.
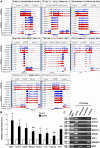
Figure 5.. R-loops in siDDX5 induce antisense transcription.
(A) Read coverage of DRIP-seq and RNA-seq signal centered at the R-loop gain peak associated to the EGR1, ACTG1, RHOB, RB1CC1, SOGA1, STIL, and UBALD1 genes and the downstream of IER2 gene loci in siCTL and siDDX5 (absolute log2 fold change > 1 and false discovery rate < 0.1, Wald test). The bottom two tracks show the intergenic RNA-seq coverage of the pooled replicates. Whereas the gene expression decreased upon the knockdown treatment, the read coverage at the intergenic region adjacent to the transcription start site increased, thus indicating possible antisense transcription. Control cells are blue, siDDX5 cells are red. (B) Antisense expression was quantified by reverse transcription quantitative PCR (RT-qPCR) using cDNAs transcribed with random primers. The amplified fragments are located at the peak regions upstream of EGR1, ACTG1, RHOB, RB1CC1, SOGA1, STIL, and UBALD1 genes and the downstream of IER2 gene. The relative expression was normalized with GAPDH. The graph shows the average and SEM from four independent experiments. Statistical significance was assessed using t test. *P < 0.05, ** P < 0.01, and ***P < 0.001. (C) Agarose gel image of the RT-PCR products amplified at the promoter region of the EGR1, ACTG1, RHOB, RB1CC1, SOGA1, STIL1, and UBALD1 genes and downstream of IER2 gene. The RT primers used are sense primers, which hybrid with the antisense strand corresponding to the gene; antisense primer, annealing to the sense strand; random primers; and no primer. DNA markers are shown on the left are in base pairs.
Figure S5.
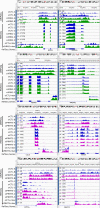
Figure S5.. R-loops in siXRN2 and siPRMT5 induce antisense transcription. Read coverage of DRIP-seq and RNA-seq signal centered at the R-loop gain peak associated to the RPLP1, RPP25L, FBXW5, and PMEPA1 gene loci in siCTL and siXRN2 (absolute log2 fold change > 1 and false discovery rate < 0.1, Wald test) as well as to CUL3, NYAP1, CPT1A, and NACC2 gene loci in siCTL and siPRMT5 (absolute log2 fold change > 1 and false discovery rate < 0.1, Wald test).
The bottom two tracks show the intergenic RNA-seq coverage of the pooled replicates. Whereas the gene expression decreased upon in the knockdowns, the read coverage at the intergenic region adjacent to the transcription start site increased, thus indicating possible antisense transcription. Control cells are blue, siXRN2 cells are green, and siPRMT5 cells are magenta.

Similar articles

Cited by

References

    1. Aguilera A, Gomez-Gonzalez B (2017) DNA-RNA hybrids: The risks of DNA breakage during transcription. Nat Struct Mol Biol 24: 439–443. 10.1038/nsmb.3395 - DOI - PubMed
    1. Argaud D, Boulanger MC, Chignon A, Mkannez G, Mathieu P (2019) Enhancer-mediated enrichment of interacting JMJD3-DDX21 to ENPP2 locus prevents R-loop formation and promotes transcription. Nucleic Acids Res 47: 8424–8438. 10.1093/nar/gkz560 - DOI - PMC - PubMed
    1. Aronesty E. (2013) Comparison of sequencing utility programs. Open Bioinforma J 7: 1–8. 10.2174/1875036201307010001 - DOI
    1. Bedford MT, Clarke SG (2009) Protein arginine methylation in mammals: Who, what, and why. Mol Cell 33: 1–13. 10.1016/j.molcel.2008.12.013 - DOI - PMC - PubMed
    1. Bhatia V, Barroso SI, García-Rubio ML, Tumini E, Herrera-Moyano E, Aguilera A (2014) BRCA2 prevents R-loop accumulation and associates with TREX-2 mRNA export factor PCID2. Nature 511: 362–365. 10.1038/nature13374 - DOI - PubMed

Publication types

MeSH terms