. 2020 Nov;69(11):2490-2502.
doi: 10.2337/db20-0382. Epub 2020 Aug 3.

Integrative Omics Analyses Reveal Epigenetic Memory in Diabetic Renal Cells Regulating Genes Associated With Kidney Dysfunction

Affiliations

Integrative Omics Analyses Reveal Epigenetic Memory in Diabetic Renal Cells Regulating Genes Associated With Kidney Dysfunction

Anita Bansal et al. Diabetes. 2020 Nov.

Abstract

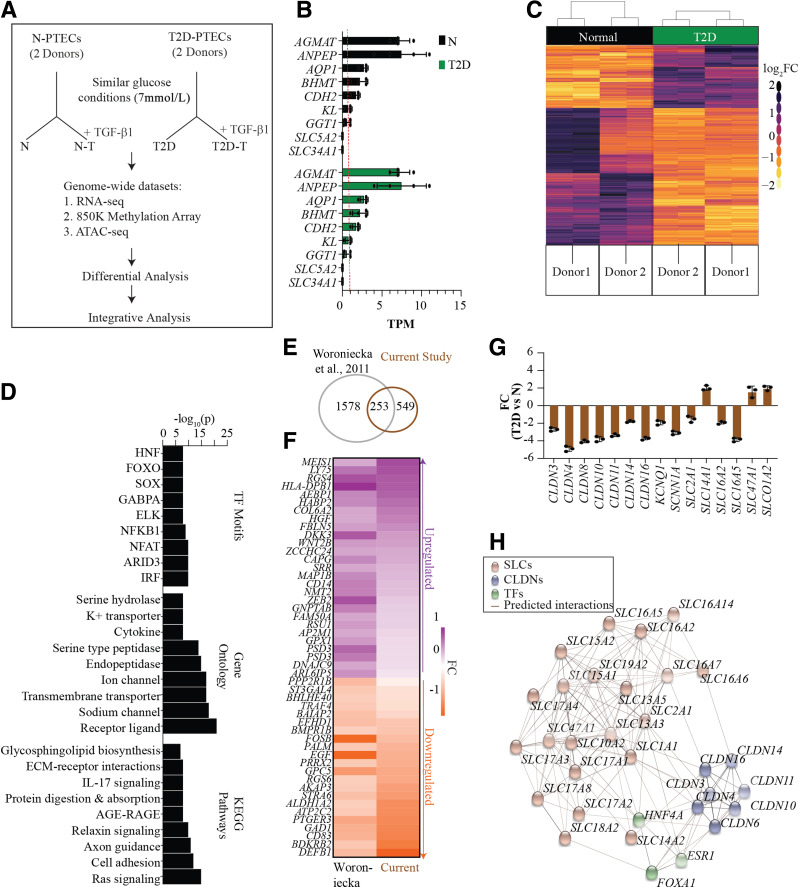
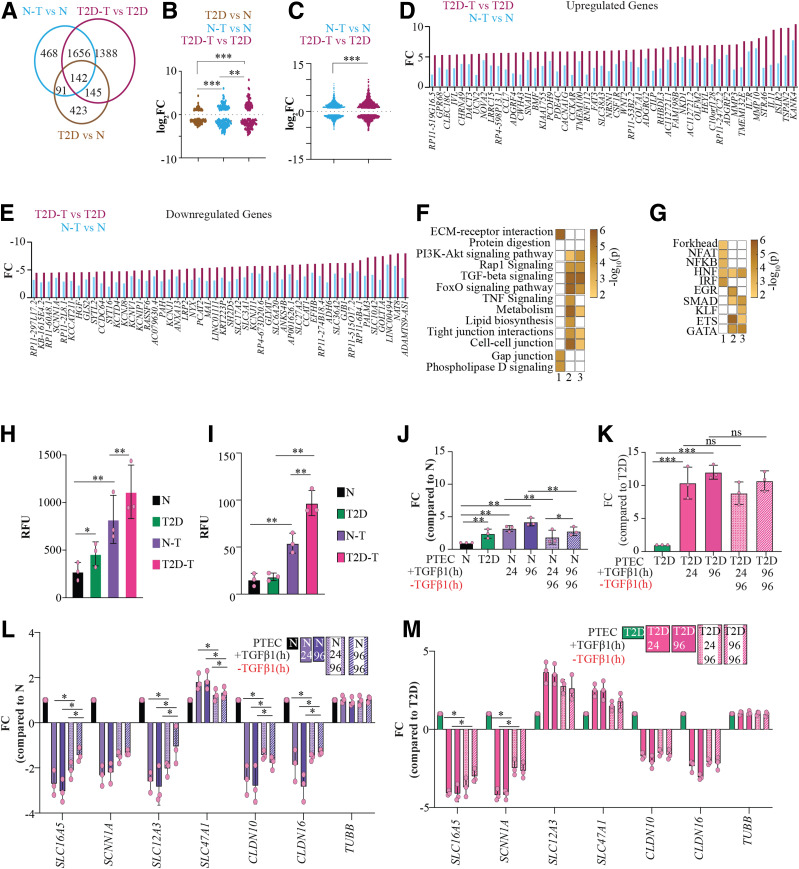
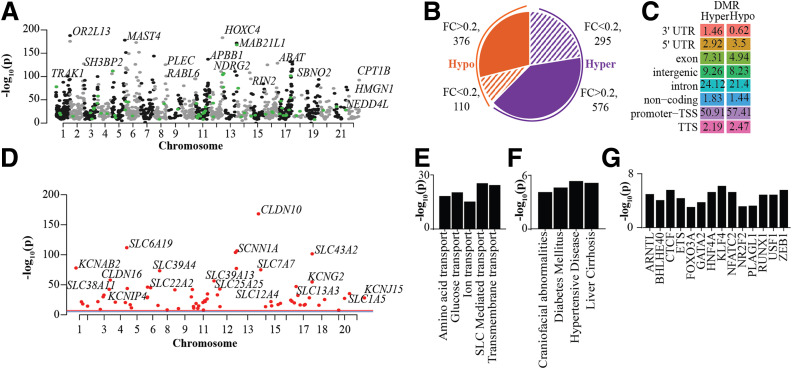
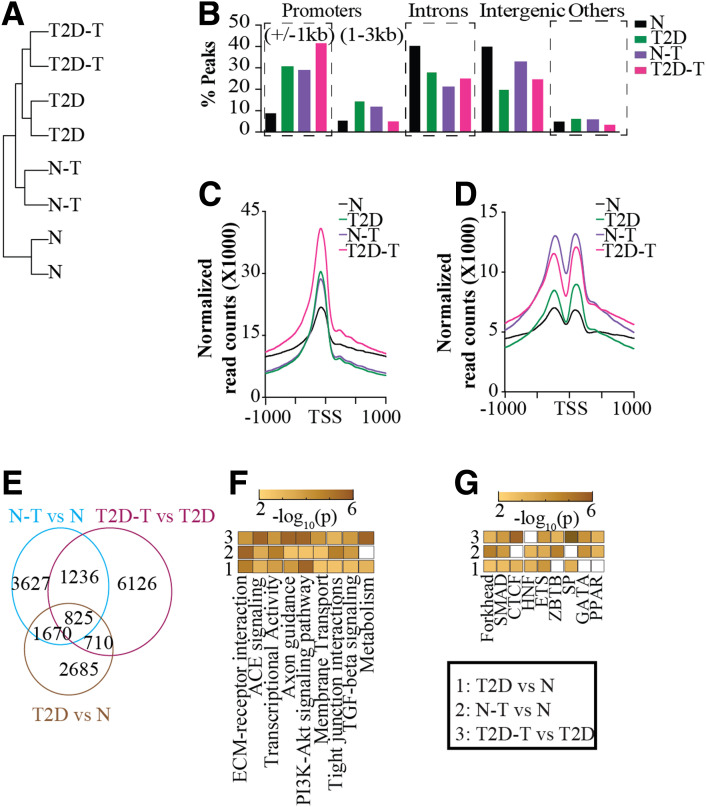
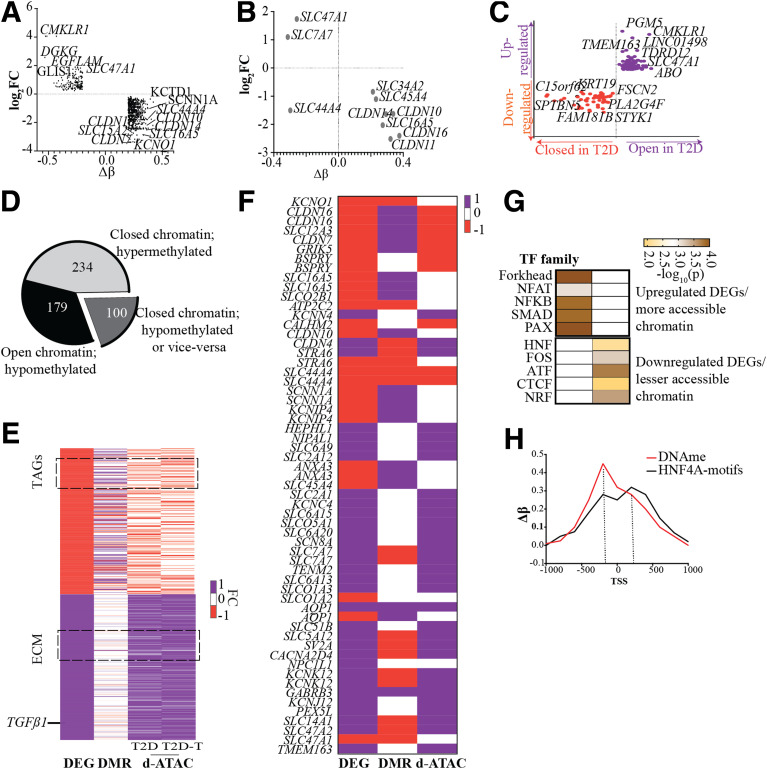
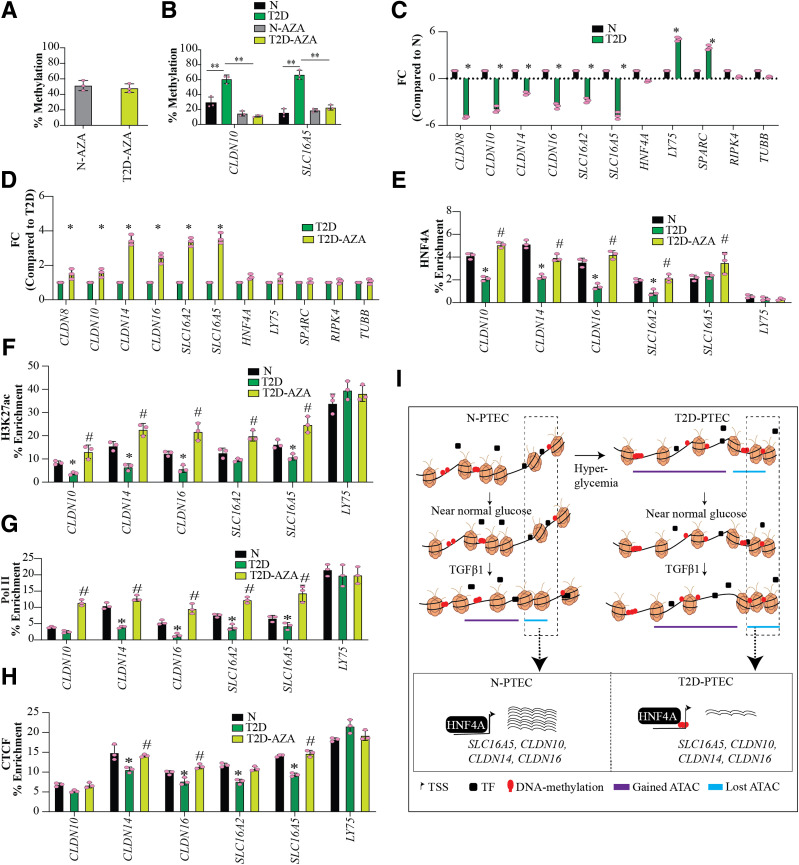
Diabetic kidney disease (DKD) is a major complication of diabetes and the leading cause of end-stage renal failure. Epigenetics has been associated with metabolic memory in which prior periods of hyperglycemia enhance the future risk of developing DKD despite subsequent glycemic control. To understand the mechanistic role of such epigenetic memory in human DKD and to identify new therapeutic targets, we profiled gene expression, DNA methylation, and chromatin accessibility in kidney proximal tubule epithelial cells (PTECs) derived from subjects with and without type 2 diabetes (T2D). T2D-PTECs displayed persistent gene expression and epigenetic changes with and without transforming growth factor-β1 treatment, even after culturing in vitro under similar conditions as nondiabetic PTECs, signified by deregulation of fibrotic and transport-associated genes (TAGs). Motif analysis of differential DNA methylation and chromatin accessibility regions associated with genes differentially regulated in T2D revealed enrichment for SMAD3, HNF4A, and CTCF transcription factor binding sites. Furthermore, the downregulation of several TAGs in T2D (including CLDN10, CLDN14, CLDN16, SLC16A2, and SLC16A5) was associated with promoter hypermethylation, decreased chromatin accessibility, and reduced enrichment of HNF4A, histone H3-lysine-27-acetylation, and CTCF. Together, these integrative analyses reveal epigenetic memory underlying the deregulation of key target genes in T2D-PTECs that may contribute to sustained renal dysfunction in DKD.


Figures

Figure 1
Figure 1
Transcriptome profiling of cultured N-PTECs and T2D-PTECs. A: Schematic of the experimental design showing PTEC samples and conditions used to study epigenetic memory. PTECs from two control donors without diabetes (N-PTECs) and donors with T2D (T2D-PTECs) were cultured under similar glucose conditions (7 mmol/L) and subsequently treated with or without TGF-β1 (10 ng/mL) for 24 h. Cells were processed for profiling as shown. B: Bar chart showing expression of kidney proximal tubule-specific genes in TPM. Each bar represents the average TPM for replicates, and the red line represents 1 TPM. Individual data points are shown as dots. Error bars = SD. C: Heat map of hierarchical clustering of normalized count data for DEGs in N and T2D; pseudocolor normalization ranges from light yellow (downregulation) to dark purple (upregulation) on a log2 fold change (log2FC) (T2D vs. N) scale. Donor 1 and donor 2 represent the two donors each for N and T2D. Two columns for each donor represent independent RNA-seq replicates. The heat map of scaled log2FC is based on normalized read counts from RNA-seq for N- and T2D-PTECs and generated using DESeq2 (see research design and methods). Each row represents scaled values for a gene across all the samples on a pseudoscale to highlight the variations across the samples. D: Bar plot representing the top nine enriched KEGG pathways, GO terms, and TF motifs for N vs. T2D DEGs. Bar = −log10(p). E: Venn diagram of number of DEGs common between the current study and a published DKD study by Woroniecka et al. (38). F: Pseudocolor heat map displaying expression of selected genes common to both the current study and by Woroniecka et al. The downregulated or upregulated genes are down- or upregulated in T2D compared with N in both these studies. G: RT-qPCR validation of candidate TAGs. Bar = average FC in T2D vs. N (n = 3); P < 0.05, ANOVA with Tukey post hoc testing. FC is calculated as 2−ΔΔCt, and individual data points are shown as dots. H: Interaction map displaying representative TAGs as predicted targets for HNF4A, ESR1, and FOXA1 TFs on the basis of the presence of respective TF binding sites in their promoters (±2 kb). AGE-RAGE, advanced glycosylation end product-receptor of advanced glycosylation end product.
Figure 2
Figure 2
Transcriptome and phenotypic changes in PTECs after TGF-β1 treatment. A: Venn diagram showing overlapping DEGs observed in three groups: N-T vs. N, T2D-T vs. T2D, and T2D vs. N. B and C: Violin plot for distribution of the change in expression levels of 142 DEGs common to the three groups (B) and expression levels of DEGs common to N-T vs. N and T2D-T vs. T2D cells (C). D and E: Bar plots depicting differential response to TGF-β1 treatment in T2D and N for candidate upregulated (D) and downregulated (E) DEGs in N-T vs. N and T2D-T vs. T2D. F and G: Pseudocolor representation of KEGG pathways (F) and TF families (G) enriched for DEGs in Venn diagram shown in panel A. 1) T2D vs. N only, 2) T2D-T vs. T2D, 3) N-T vs. N. Color in each box for panels F and G represent −log10(p). H and I: Measurement of OS in PTECs using CellROX Orange assay (H) and collagen using Col-F fluorescent assay (I). Bar = average relative fluorescent units (RFUs) (n = 3). JM: Measurement of change in Col6A2 (J and K), SLC16A5, SCNN1A, SLC12A3, SLC47A1, CLDN10, CLDN16, and TUBB (L and M) expression observed in N and T2D samples with TGF-β1 treatment and subsequent removal of TGF-β1 using RT-qPCR. Bars = average fold change (FC) (n = 3). Error bars = SD. Black, N; green, T2D; purple, N-T (24-h TGF-β1 treatment); dark purple, N-T (96-h TGF-β1 treatment); pink, T2D-T (24-h TGF-β1 treatment); dark pink, T2D-T (96-h TGF-β1 treatment). Shaded bars represent change in expression for indicated genes 96 h after removal of TGF-β1. Error bars = SD. Individual data points are shown as dots. *P < 0.05, **P < 0.005, ***P < 0.0005. ns, not significant.
Figure 3
Figure 3
DNAme profiles of PTECs showing differential patterns in N- and T2D-PTECs. A: Manhattan plot of DMRs in T2D-PTECs compared with N-PTECs. Top DMR-associated genes are highlighted. Each dot depicts a DMR; black and gray dots are for DMRs in even and odd chromosomes, and green dots highlight DMRs associated with TAGs. B: Pie chart showing number of DMRs on the basis of fold change (FC) (T2D vs. N) and that have an adjusted P < 0.05. Orange indicates hypomethylated DMRs and purple, hypermethylated DMRs. Shaded areas show DMRs with <20% FC, whereas solid colors represent DMRs with >20% FC. C: Percent genomic distribution of hyper- and hypomethylated DMRs. D: Manhattan plot highlighting candidate TAGs with a DMR within 20 kb of their TSS. EG: Enriched GO pathways (E), disease ontology terms (F), and TF motifs (G) for genes within 50 kb of DMRs. Bar = −log10(p). TTS, transcription termination site.
Figure 4
Figure 4
ATAC-seq profiles of PTECs show more chromatin accessibility in T2D and after TGF-β1 treatment. A: Dendrogram showing hierarchical clustering of d-ATACs of various PTECs, two replicates each, one from each donor for both N and T2D. B: Bar plots showing genomic distribution of ATAC peaks in PTECs. C and D: Profile plots showing ATAC-seq peaks in PTECs, centered on TSS for nucleosome-free reads (C) and mononucleosome reads (D). E: Venn diagram showing overlapping and unique d-ATACs in PTECs. F and G: Pseudocolor representation of top enriched pathways (F) and TF motifs (G) for genes associated with d-ATACs (within 50 kb) in 1) T2D vs. N, 2) N-T vs. N, and 3) T2D-T vs. T2D. Color in each box of panels F and G represents −log10(p).
Figure 5
Figure 5
Integrative analysis of RNA-seq, DNAme profile, and ATAC-seq data sets. A: Scatter plot showing correlation between DEGs (log2 fold change [FC]) and DMRs (Δβ) for T2D- vs. N-PTECs. Top genes associated (within 50 kb) with DEGs and DMRs are highlighted. B: Scatter plot showing correlation between candidate TAGs and associated DMRs within 50 kb. C: Quadrant plot showing correlation between DEGs and d-ATAC peaks in T2D- vs. N-PTECs. Top genes associated within 50 kb of d-ATAC are highlighted. D: Pie chart showing variation in ATAC-seq peaks (more closed or open chromatin) within hyper- or hypo-DMRs. E: Pseudocolor heat map showing T2D-associated key DEGs and corresponding DMRs and d-ATAC peaks. F: Pseudocolor heat map showing T2D-associated differential TAGs, DMRs, and d- ATAC. E and F: Heat maps are scaled from −1 to 1, where −1 indicates downregulation of gene expression, hypomethylation, and decreased ATAC peaks and 1 represents upregulation of gene expression, hypermethylation, and increased ATAC peaks. Orange indicates downregulation and purple, upregulation in panels C, E, and F. G: Enriched TF families for overlapping DMR and d-ATAC associated with DEGs. Color in each box represents −log10(p). H: Line plot of in silico analysis showing DNAme and HNF4A (TF binding site) motifs around DEGs in T2D vs. N.
Figure 6
Figure 6
HNF4A, a potential regulator of candidate SLCs and CLDNs. A: Bar plot showing percent reduction in global DNAme as measured using ELISA after 5-AZA treatment (500 nmol/L for 72 h) in N and T2D. B: Percent methylation measured in the promoters of CLDN10 and SLC16A5 in N, T2D, N-AZA, and T2D-AZA using QIAGEN EpiTect Methyl II PCR Assay. C and D: Fold change (FC) in expression of candidate TAGs (SLC, CLDN), HNF4A, and control genes as measured by RT-qPCR (n = 3). Bar = average FC compared with N (C) and T2D (D). EH: ChIP-qPCR assays showing enrichment of HNF4A (E), H3K27ac (F), Pol II (G), and CTCF (H) in PTECs at gene promoters and overlapping DMRs. Error bars = SD. Individual data points are shown as dots. Bar = average FC (n = 3). Significance was calculated using ANOVA followed by Tukey post hoc test. *P < 0.05, **P < 0.005 for T2D vs. N; #P < 0.05 for T2D-AZA vs. T2D. I: Proposed schematic model for epigenetic memory in the persistent deregulation of candidate TAGs in T2D and the role of HNF4A TF. Hyperglycemia associated with diabetic conditions induces persistent epigenetic changes (i.e., epigenetic memory) in PTECs, which is represented by changes in DNAme or chromatin states (obtained by ATAC-seq). Our study shows that these epigenetic changes persist even when diabetic PTECs are cultured under normal glucose conditions in vitro. In addition, the persistent epigenetic changes render the diabetic PTECs more sensitive to secondary DKD-related stimuli like TGF-β1. Our data suggest that epigenetic changes associated with diabetes reduce the binding/enrichment of HNF4A upstream of key TAGs along with increased DNAme and reduced chromatin accessibility, hence reducing their transcription/expression in T2D. The purple line depicts the open or more accessible chromatin regions with DNA hypomethylation and greater chromatin accessibility in the promoters. The blue line depicts the closed regions with DNA hypermethylation and lower chromatin accessibility in the promoters.

References

    1. Alicic RZ, Rooney MT, Tuttle KR. Diabetic kidney disease: challenges, progress, and possibilities. Clin J Am Soc Nephrol 2017;12:2032–2045 - PMC - PubMed
    1. Forbes JM, Cooper ME. Mechanisms of diabetic complications. Physiol Rev 2013;93:137–188 - PubMed
    1. Kanwar YS, Sun L, Xie P, Liu FY, Chen S. A glimpse of various pathogenetic mechanisms of diabetic nephropathy. Annu Rev Pathol 2011;6:395–423 - PMC - PubMed
    1. Nathan DM; DCCT/EDIC Research Group . The diabetes control and complications trial/epidemiology of diabetes interventions and complications study at 30 years: overview. Diabetes Care 2014;37:9–16 - PMC - PubMed
    1. Holman RR, Paul SK, Bethel MA, Matthews DR, Neil HA. 10-year follow-up of intensive glucose control in type 2 diabetes. N Engl J Med 2008;359:1577–1589 - PubMed

Publication types

MeSH terms