. 2020 Aug 18;117(33):20117-20126.
doi: 10.1073/pnas.2003900117. Epub 2020 Aug 3.

Multidimensional study of the heterogeneity of leukemia cells in t(8;21) acute myelogenous leukemia identifies the subtype with poor outcome

Affiliations

Multidimensional study of the heterogeneity of leukemia cells in t(8;21) acute myelogenous leukemia identifies the subtype with poor outcome

Lu Jiang et al. Proc Natl Acad Sci U S A. .

Abstract

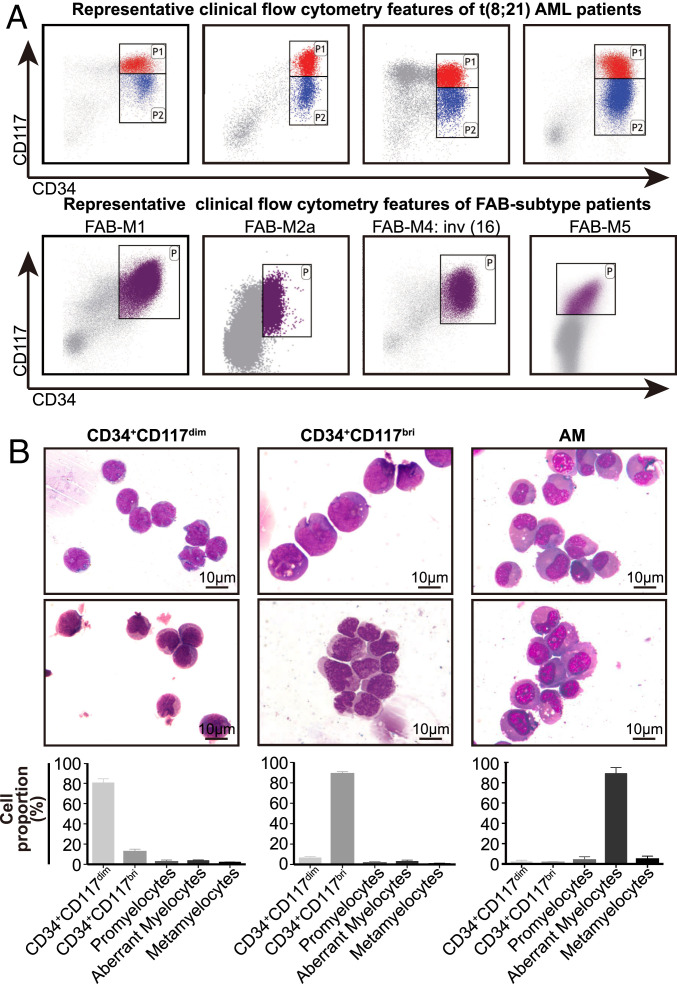
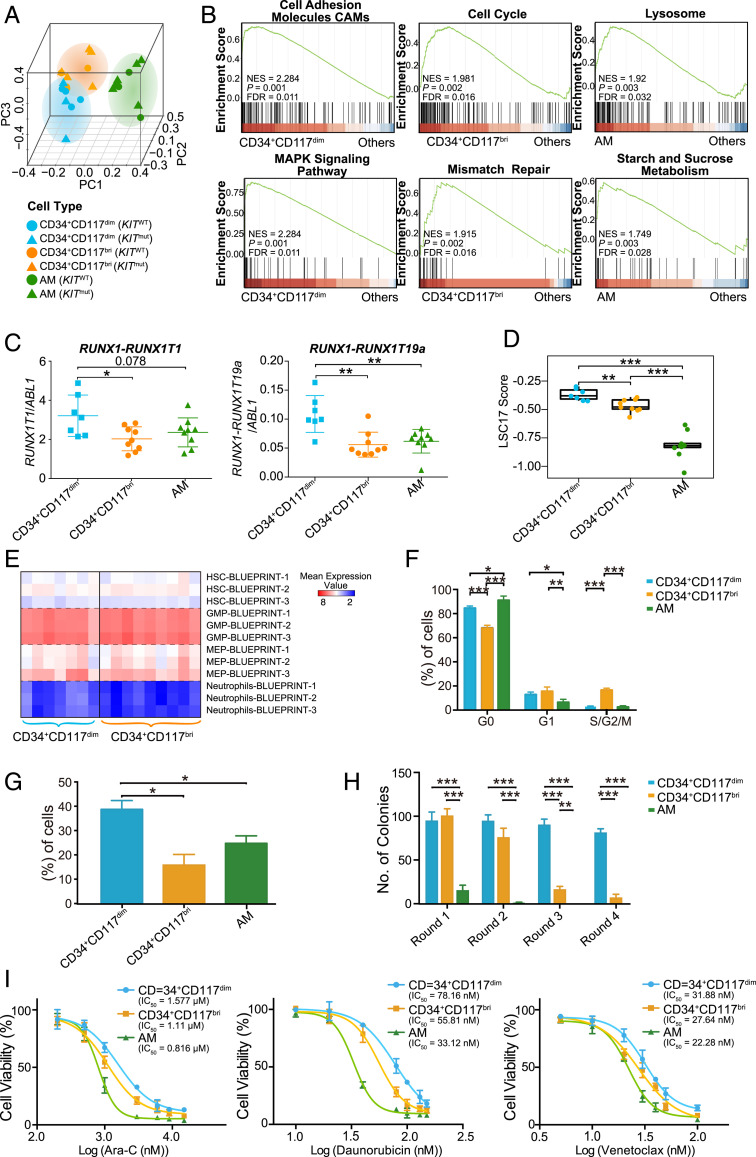
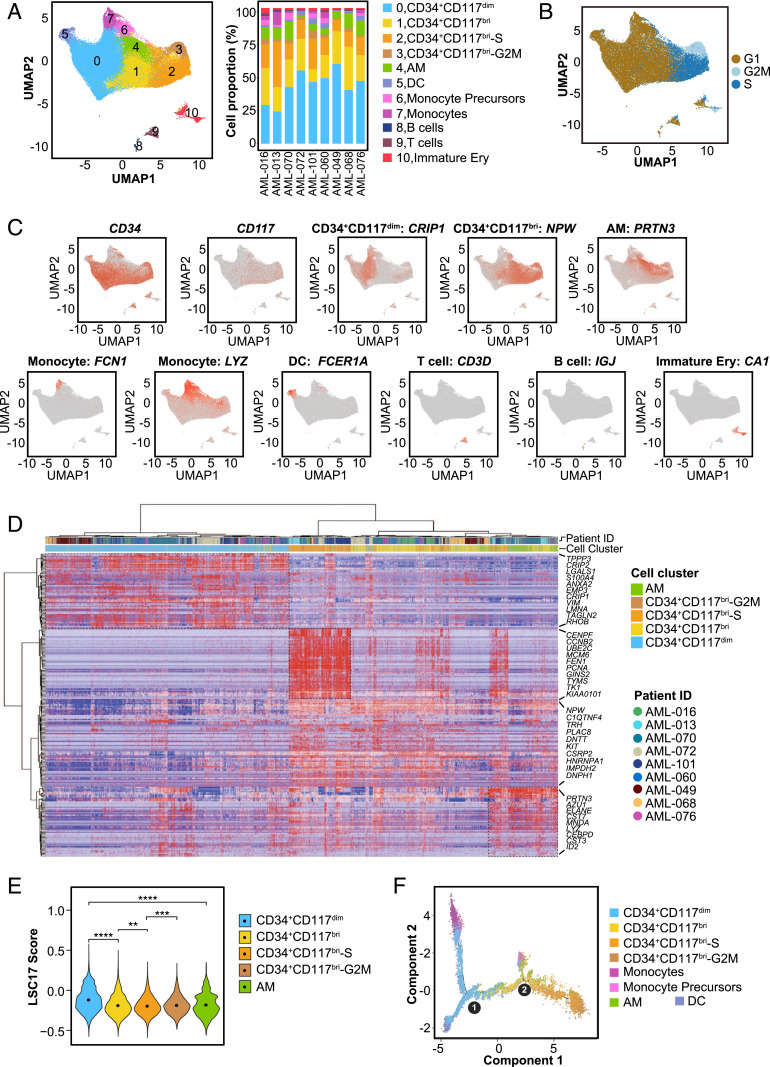
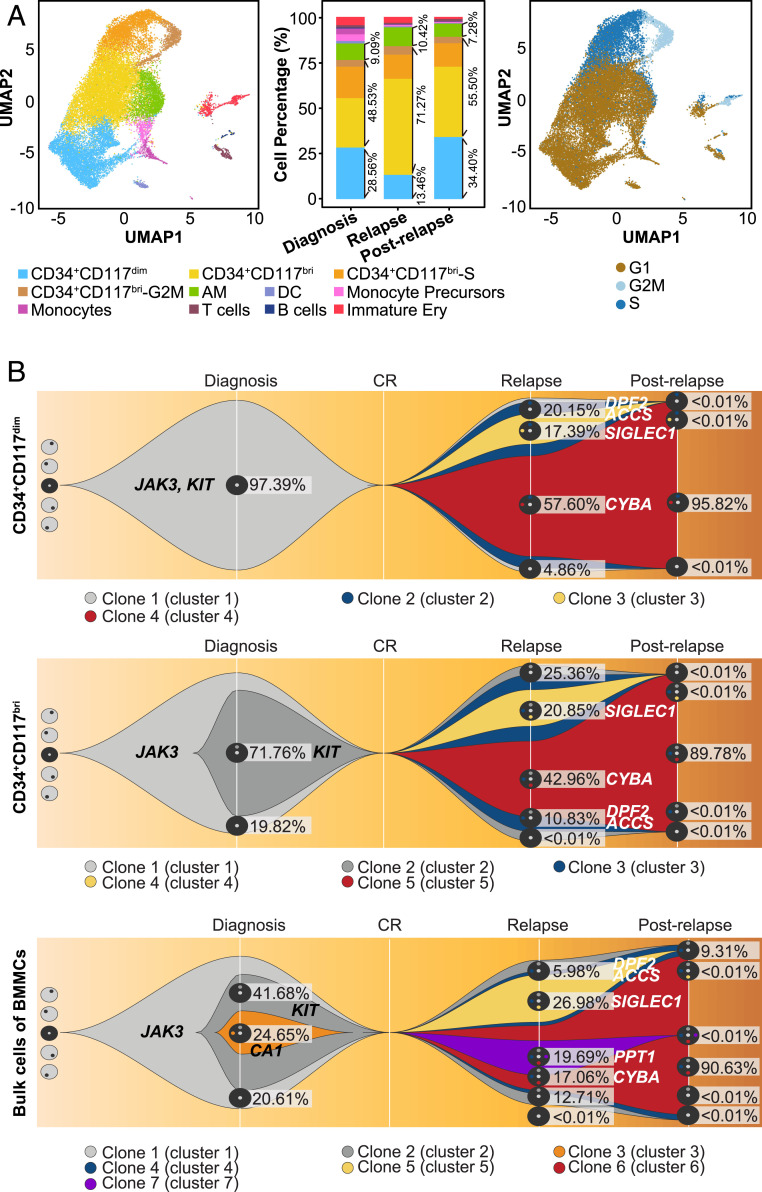
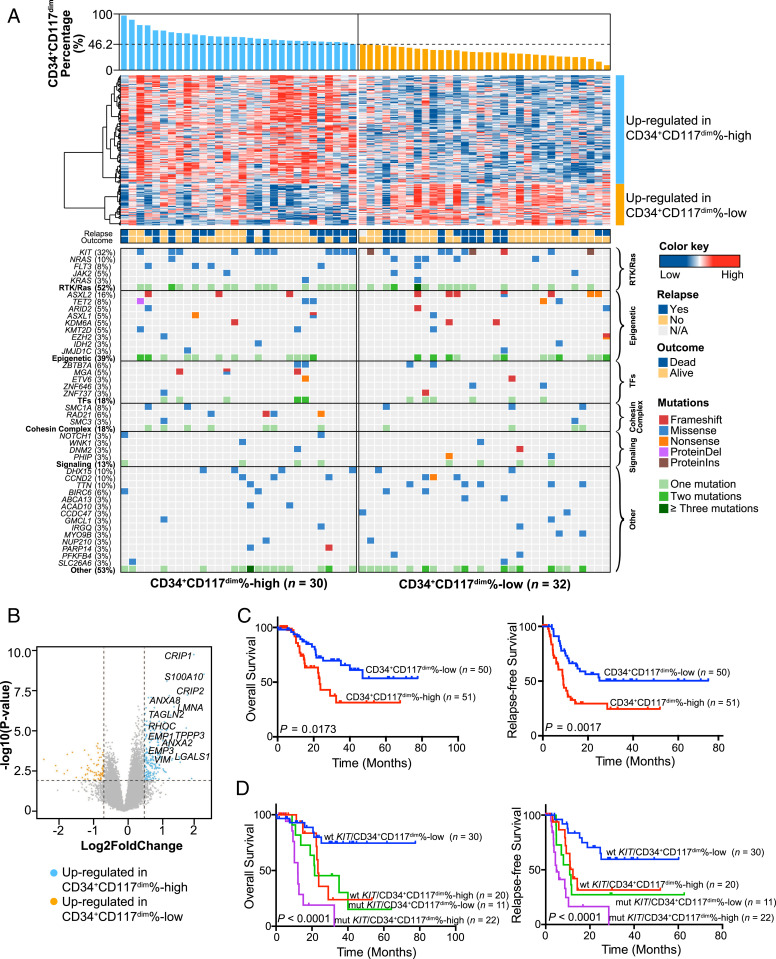
t(8;21)(q22;q22) acute myelogenous leukemia (AML) is morphologically characterized by a continuum of heterogeneous leukemia cells from myeloblasts to differentiated myeloid elements. Thus, t(8;21) AML is an excellent model for studying heterogeneous cell populations and cellular evolution during disease progression. Using integrative analyses of immunophenotype, RNA-sequencing (RNA-seq), and single-cell RNA-sequencing (scRNA-seq), we identified three distinct intrapatient leukemic cell populations that were arrested at different stages of myeloid differentiation: CD34+CD117dim blasts, CD34+CD117bri blasts, and abnormal myeloid cells with partial maturation (AM). CD117 is also known as c-KIT protein. CD34+CD117dim cells were blocked in the G0/G1 phase at disease onset, presenting with the regular morphology of myeloblasts showing features of granulocyte-monocyte progenitors (GMP), and were drug-resistant to chemotherapy. Genes associated with cell migration and adhesion (LGALS1, EMP3, and ANXA2) were highly expressed in the CD34+CD117dim population. CD34+CD117bri blasts were blocked a bit later than the CD34+CD117dim population in the hematopoietic differentiation stage and displayed high proliferation ability. AM cells, which bear abnormal myelocyte morphology, especially overexpressed granule genes AZU1, ELANE, and PRTN3 and were sensitive to chemotherapy. scRNA-seq at different time points identified CD34+CD117dim blasts as an important leukemic cluster that expanded at postrelapse refractory stage after several cycles of chemotherapy. Patients with t(8;21) AML with a higher proportion of CD34+CD117dim cells had significantly worse clinical outcomes than those with a lower CD34+CD117dim proportion. Univariate and multivariate analyses identified CD34+CD117dim proportion as an independent factor for poor disease outcome. Our study provides evidence for the multidimensional heterogeneity of t(8;21)AML and may offer new tools for future disease stratification.

Keywords: cellular heterogeneity; cellular/clonal evolution; gene expression profiling; single-cell RNA sequencing; t(8;21)(q22;q22) AML.


Conflict of interest statement

The authors declare no competing interest.

Figures

Fig. 1.
Fig. 1.
Clinical immunophenotypic characteristics and morphological features of distinct leukemic cell populations in t(8;21) AML patients. (A) Representative clinical flow cytometry data showing the distribution of CD34+ myeloblasts by antigen CD34 and CD117 in four t(8;21) AML patients at diagnosis (Upper) and four AML patients with other FAB subtypes (except for M3) at diagnosis (Lower). (B, Upper) Representative Wright Giemsa-stained cytospin preparations of isolated CD34+CD117dim, CD34+CD117bri, and AM cell populations from the BM of t(8;21) AML patients. The AM population was isolated using the marker combination of CD34CD117HLA-DRCD15+CD11b. (B, Lower) Differential counts of the isolated cell populations (mean ± SD; n = 4), including CD34+CD117dim, CD34+CD117bri, and AM populations.
Fig. 2.
Fig. 2.
Gene expression profiles and biological characteristics of CD34+CD117dim, CD34+CD117bri, and AM cell populations. (A) PCA plot of isolated CD34+CD117dim, CD34+CD117bri, and AM populations. Triangles and circles represent cells with KIT mutation (KITmut) and KIT wild-type (KITWT) status, respectively. (B) Representative GSEA plots showing the activated pathways in CD34+CD117dim, CD34+CD117bri, and AM cell populations. Normalized enrichment score (NES) values, nominal P values, and false discovery rate (FDR) values are given. (C) Relative expression levels of RUNX1-RUNX1T1 and RUNX1-RUNX1T19a transcripts in isolated CD34+CD117dim, CD34+CD117bri, and AM cell populations based on the RNA-seq data after normalization to the ABL1 read counts (internal reference). (D) LSC17 score of the CD34+CD117dim, CD34+CD117bri, and AM populations. Statistical significance was determined using a two-sided Wilcoxon test. (E) Comparison of the overexpressed gene sets of CD34+CD117dim and CD34+CD117bri myeloblasts with the Blueprint project gene sets. (F) Cell cycle analysis of the isolated CD34+CD117dim, CD34+CD117bri, and AM cell populations. Cell frequencies in G0, G1, and S/G2/M are shown (mean ± SD; n = 3 with duplicates). (G) Transwell migration of isolated CD34+CD117dim, CD34+CD117bri, and AM populations (mean ± SD; n = 3 with duplicates). (H) Colony-forming unit (CFU) assay of isolated CD34+CD117dim, CD34+CD117bri, and AM populations (mean ± SD; n = 3 with duplicates). (I) Cell viability of isolated CD34+CD117dim, CD34+CD117bri, and AM populations on exposure to cytarabine, daunorubicin, and venetoclax (n = 3 with triplicate). *P < 0.05; **P < 0.01; ***P < 0.001, two-sided Student’s t test.
Fig. 3.
Fig. 3.
Single-cell transcriptomic analysis of t(8;21) AML at diagnosis. (A) UMAP analysis of BMMCs from nine primary t(8;21) AML patients after removing batch effects. Each dot represents a cell, and the colors represent different cell clusters. The right stacked column chart shows the percentage of each cell cluster in each patient. DC, dendritic cells; Immature Ery, immature erythroid cells. (B) UMAP plot of cell cycle state of cells in each cell cluster according to the expression level of cell cycle-specific gene sets. (C) UMAP plots displaying the expression patterns of CD34, CD117, and the representative markers for CD34+CD117dim, CD34+CD117bri, AM, monocytes, DCs, T cells, B cells, and immature erythroid cells. (D) Heatmap of the highly expressed genes in CD34+CD117dim, CD34+CD117bri, CD34+CD117bri-S, CD34+CD117bri-G2M, and AM cell populations from nine t(8;21) AML patients. The relative expression level of genes (rows) across cells (columns) is shown. (E) Violin plot showing the LSC17 score of CD34+CD117dim, CD34+CD117bri, CD34+CD117bri-S, CD34+CD117bri-G2M, and AM clusters. **P < 0.01; ***P < 0.001; ****P < 0.0001, two-sided Wilcoxon test. (F) Trajectory analysis using Monocle 2, with each dot representing an individual cell and colors representing different cell types. Circle 1 represents the beginning (the root), and circle 2 represents the branch point of the trajectory.
Fig. 4.
Fig. 4.
Single-cell transcriptomic analysis and clonal evolution analysis of t(8;21) AML in disease progression. (A) UMAP analysis of BMMCs from three different time points (diagnosis, relapse, and postrelapse) of patient AML-016 during disease progression. Cells are colored by cell cluster (Left). The stacked column chart (Middle) shows the percentage of each cell cluster across different time points. The proportion of the leukemic blast cells for each immunophenotypic myeloblasts populations was >90%, consistent with the actual proportion of the leukemic blast cells in each population. (Right) UMAP plot showing the cell cycle states of cells in each cell cluster according to the expression level of cell cycle-specific gene sets. (B) Fish plots showing the clonal evolution landscapes for CD34+CD117dim cells (Upper), CD34+CD117bri cells (Middle), and bulk BMMCs (Lower) based on the median value of variant allele frequencies in patient AML-016.
Fig. 5.
Fig. 5.
Gene expression profiles and clinical features of t(8;21) AML patients with different CD34+CD117dim cell proportions. (A) Integrated molecular pattern of 62 t(8;21) AML patients subjected to RNA-seq. (Upper) The CD34+CD117dim proportion arranged from high to low according to the clinical flow cytometry data (Dataset S1), a heatmap showing the gene expression patterns in the CD34+CD117dim%-high and CD34+CD117dim%-low groups, and the outcomes and relapse status of the patients. (Lower) Mutations identified based on the RNA-seq data. Different colors represent distinct mutation types. (B) Volcano plot showing differentially expressed genes. The vertical axis shows the −log10 (P value), and the horizontal axis shows the log2 fold change. Up-regulated genes in the CD34+CD117dim%-high group are shown in blue (fold change >1.5; P < 0.01). (C) OS and RFS in 101 patients with t(8;21) AML according to the proportion of CD34+CD117dim cells among CD34+ myeloblasts. Survival curves were estimated with the Kaplan–Meier method and compared using a log-rank test. (D) Risk stratification combining KIT mutation status and CD34+CD117dim proportion. Survival curves were estimated with the Kaplan–Meier method and compared using a log-rank test.

References

    1. Döhner H. et al. ., Diagnosis and management of AML in adults: 2017 ELN recommendations from an international expert panel. Blood 129, 424–447 (2017). - PMC - PubMed
    1. Papaemmanuil E. et al. ., Genomic classification and prognosis in acute myeloid leukemia. N. Engl. J. Med. 374, 2209–2221 (2016). - PMC - PubMed
    1. Faber Z. J. et al. ., The genomic landscape of core-binding factor acute myeloid leukemias. Nat. Genet. 48, 1551–1556 (2016). - PMC - PubMed
    1. Yushu H., Shougeng B., Zhijian X., Yingchang M., Chao H. Z., Acute myeloid leukemia M2b. Haematologica 84, 193–194 (1999). - PubMed
    1. Xiao Z., Hao Y., Bian S., Acute myeloid leukemia M2B (subacute myeloid leukemia) in China. Leuk. Res. 21, 351–352 (1997). - PubMed

Publication types

MeSH terms