. 2020 Aug 3;3(1):422.
doi: 10.1038/s42003-020-01146-2.

MethylResolver-a method for deconvoluting bulk DNA methylation profiles into known and unknown cell contents

Affiliations

MethylResolver-a method for deconvoluting bulk DNA methylation profiles into known and unknown cell contents

Douglas Arneson et al. Commun Biol. .

Abstract

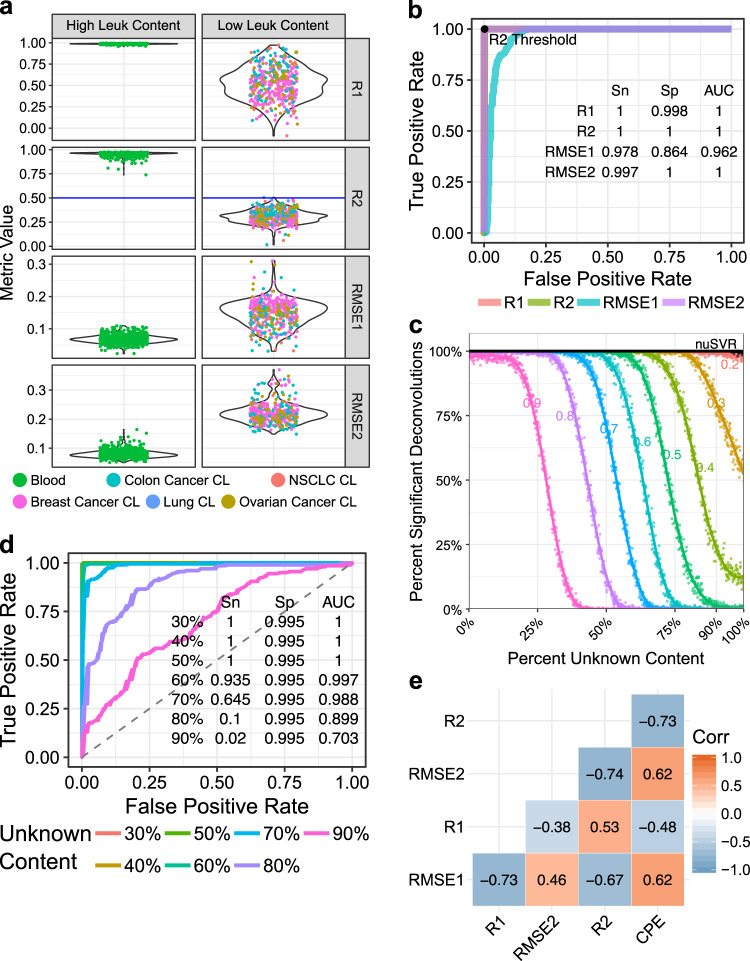
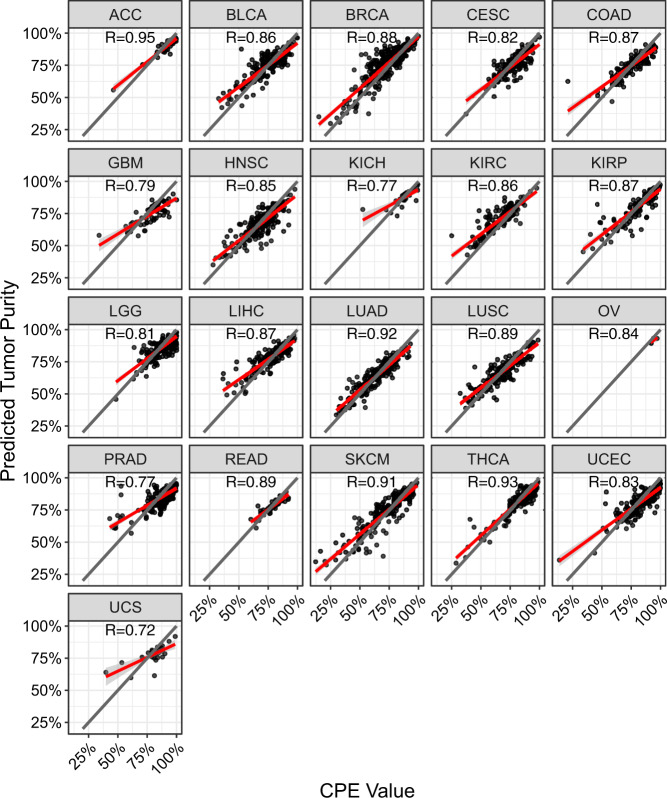
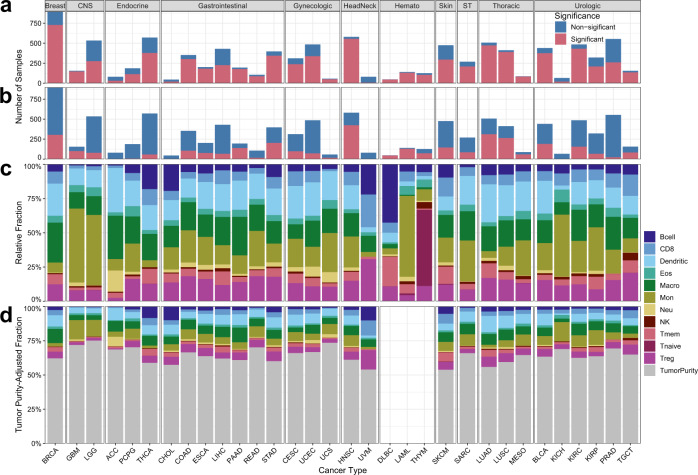
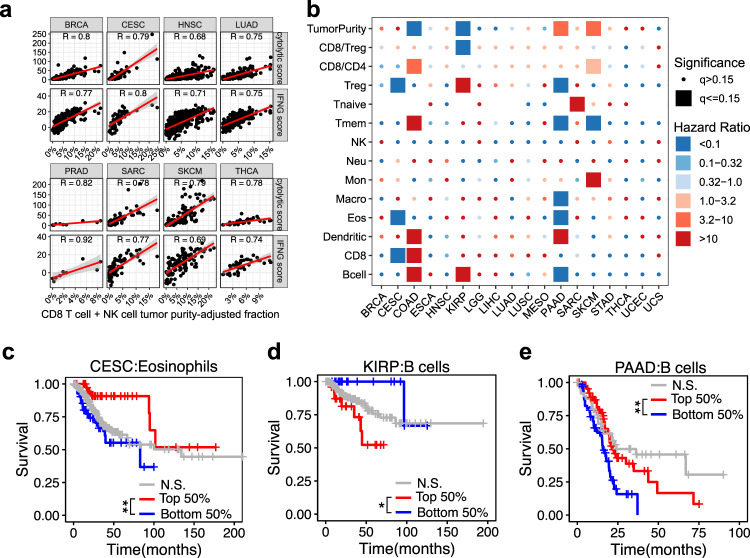
Bulk tissue DNA methylation profiling has been used to examine epigenetic mechanisms and biomarkers of complex diseases such as cancer. However, heterogeneity of cellular content in tissues complicates result interpretation and utility. In silico deconvolution of cellular fractions from bulk tissue data offers a fast and inexpensive alternative to experimentally measuring such fractions. In this study, we report the design, implementation, and benchmarking of MethylResolver, a Least Trimmed Squares regression-based method for inferring leukocyte subset fractions from methylation profiles of tumor admixtures. Compared to previous approaches MethylResolver is more accurate as unknown cellular content in the mixture increases and is able to resolve tumor purity-scaled immune cell-type fractions without a cancer-specific signature. We also present a pan-cancer deconvolution of TCGA, recapitulating that high eosinophil fraction predicts improved cervical carcinoma survival and identifying elevated B cell fraction as a previously unreported predictor of poor survival for papillary renal cell carcinoma.


Conflict of interest statement

K.W. is an employee and shareholder of Bristol-Myers Squibb.

Figures

Fig. 1
Fig. 1. Benchmarking MethylResolver.
a Benchmarking five different deconvolution methods using in silico spike-in experiment. Line color corresponds to the deconvolution method, y-axis is the square of the Pearson correlation coefficient (R2) between the inferred cell-type fractions and the ground truth, x-axis is the amount of unknown/tumor content in the mixture, error bars represent SEM. Each panel corresponds to estimates for a specific cell type or the aggregate across all cell types. Statistical significance of the performance of MethylResolver (LTS) over other models was determined using post hoc pairwise comparisons of two-way ANOVA. Adjusted p-values from the ANOVA test are indicated with the color of the text matching the respective model (n = 90 per point). b Benchmarking four different deconvolution methods versus MethylResolver using the in vitro spike-in experiment. The color in the heatmap corresponds to the difference in the Pearson correlation between MethylResolver and the ground truth and the correlation between the other methods and the ground truth. The y-axis corresponds to the amount of noise that is added, and the x-axis corresponds to the amount of unknown/tumor content in the mixture (n = 10,800). c MethylResolver predicted relative leukocyte subset fractions (y-axis) of 12 samples from reconstructed mixtures of purified human leukocytes and 6 samples from adult human whole blood with corresponding FACS fractions (x-axis). Cell type is denoted by the color of each point and Pearson Correlation is indicated.
Fig. 2
Fig. 2. Determining a threshold for significant deconvolutions and identifying tumor purity to resolve tumor purity-scaled leukocyte subset fractions.
a Four goodness-of-fit metrics considered for determining significant deconvolutions (rows) are benchmarked for their abilities to stratify samples with putative high and low leukocyte content. The score for each metric is given on the y-axis and different sample types are indicated by color. The R2 threshold used to determine significance of deconvolution in this work (blue line) is indicated. b ROC curves demonstrating the of the ability of the four goodness-of-fit metrics to stratify positive and negative cohorts. The sensitivity and specificity of these metrics at the point which gives the highest Youden’s J statistic is indicated along with the location of the R2 significance threshold. c A range of R2 thresholds from 0.2 to 0.9 (colored numbers) are tested for their ability to call significant deconvolutions (y-axis) of synthetic mixtures of varying fractions of unknown content from 0 to 100% in increments of 0.1% with 200 random synthetic mixtures at each increment (x-axis). The performance of CIBERSORT (nuSVR) on the same mixtures using p-values obtained from 2500 permutations is also indicated (black line). d ROC curves demonstrating the performance of the R2 threshold to significantly deconvolve mixtures at different percentages of unknown content. Sensitivity and specificity shown for R2 = 0.5 (n = 200,200). e Correlations between CPE tumor purity estimates and the four goodness-of-fit metrics for 7001 samples from TCGA.
Fig. 3
Fig. 3. Performance of MethylResolver tumor purity estimation.
Correlation between MethylResolver predicted tumor purity from our RF regression model (y-axis) and the ground truth CPE tumor purity value (x-axis) for 21 different cancer types from TCGA (panels) with the Pearson correlation indicated. The gray line is y=x and the red line is a linear regression of the data points. The RF regression model was trained on half the samples from each cancer type and the cancer samples displayed here were held out from the training of the model (n = 3497).
Fig. 4
Fig. 4. Pan-cancer deconvolution of TCGA.
ad MethylResolver was applied to 9,756 samples from 33 cancer types from TCGA group into 11 broad categories. The total number of samples profiled per cancer and the fraction of samples which had a significant deconvolution (red) with a loose (a) and stringent (b) statistical threshold. c Relative and (d) tumor purity-scaled leukocyte subset fractions for the significantly deconvoluted TCGA samples with cell type indicated by color. Tumor purity-scaled leukocyte subset fractions are not inferred for hematologic cancers.
Fig. 5
Fig. 5. Prognostic potential of tumor purity-scaled leukocyte subset fractions.
a Spearman correlation of the MethylResolver-derived tumor purity-scaled fraction of CD8 T cells + NK cells with genes and scores known to correlate with these cell types profiled across eight cancer types. The y-axis is the score or gene expression (in FPKM) and the x-axis is the tumor purity-scaled fraction of the CD8 T cells + NK cells. The red line is the linear regression fit of the points. b Cox regression was applied to the MethylResolver pan-cancer deconvolution of TCGA to infer prognostic leukocyte subsets using tumor purity-scaled fractions from significant deconvolutions. Heatmap colors correspond to the hazard ratio values and shapes correspond to the significance, rows correspond to cancer type and columns correspond to cell-type, tumor purity, CD8-to-Treg ratio (CD8/Treg) or CD8-to-CD4 ratio (CD8/CD4). Only samples with significant deconvolutions were used in the Cox regression. ce Kaplan–Meier plots showing patients’ overall survival stratified by median tumor purity-scaled fraction of eosinophils in CESC (c), median tumor purity-scaled fraction of B cells in KIRP (d), median tumor purity-scaled fraction of B cells in PAAD (e). Red lines show survival of the top 50% tumor purity-scaled fractions of the indicated cell-type/feature from significant deconvolutions, blue lines show the survival from the bottom 50% from significant deconvolutions, and gray lines show the survival from non-significant deconvolutions. *q < 0.05 and **q < 0.01.

References

    1. Coussens LM, Zitvogel L, Palucka AK. Neutralizing tumor-promoting chronic inflammation: a magic bullet? Science. 2013;339:286–291. - PMC - PubMed
    1. Hanahan D, Weinberg RA. Hallmarks of cancer: the next generation. Cell. 2011;144:646–674. - PubMed
    1. Macosko EZ, et al. Highly parallel genome-wide expression profiling of individual cells using nanoliter droplets. Cell. 2015;161:1202–1214. - PMC - PubMed
    1. Cao J, et al. Comprehensive single-cell transcriptional profiling of a multicellular organism. Science. 2017;357:661–667. - PMC - PubMed
    1. Newman AM, et al. Robust enumeration of cell subsets from tissue expression profiles. Nat. Methods. 2015;12:453–457. - PMC - PubMed

Publication types