. 2020 Oct;12(10):929-938.
doi: 10.1038/s41557-020-0513-5. Epub 2020 Aug 3.

CD44 regulates epigenetic plasticity by mediating iron endocytosis

Affiliations

CD44 regulates epigenetic plasticity by mediating iron endocytosis

Sebastian Müller et al. Nat Chem. 2020 Oct.

Abstract

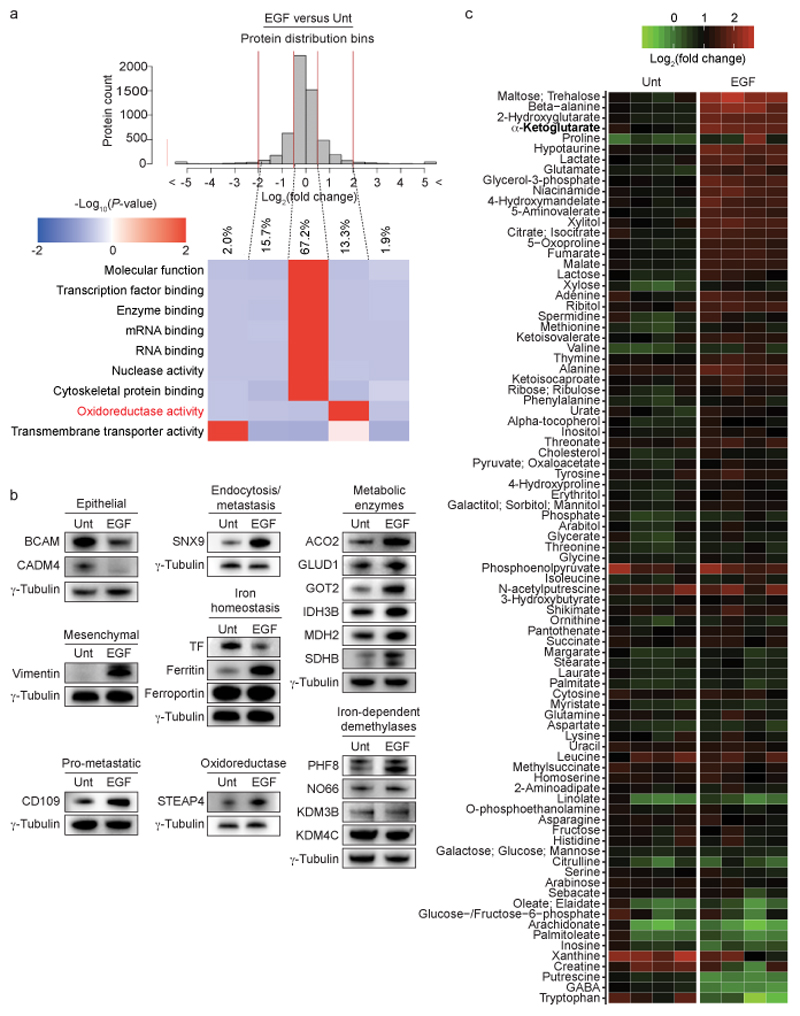
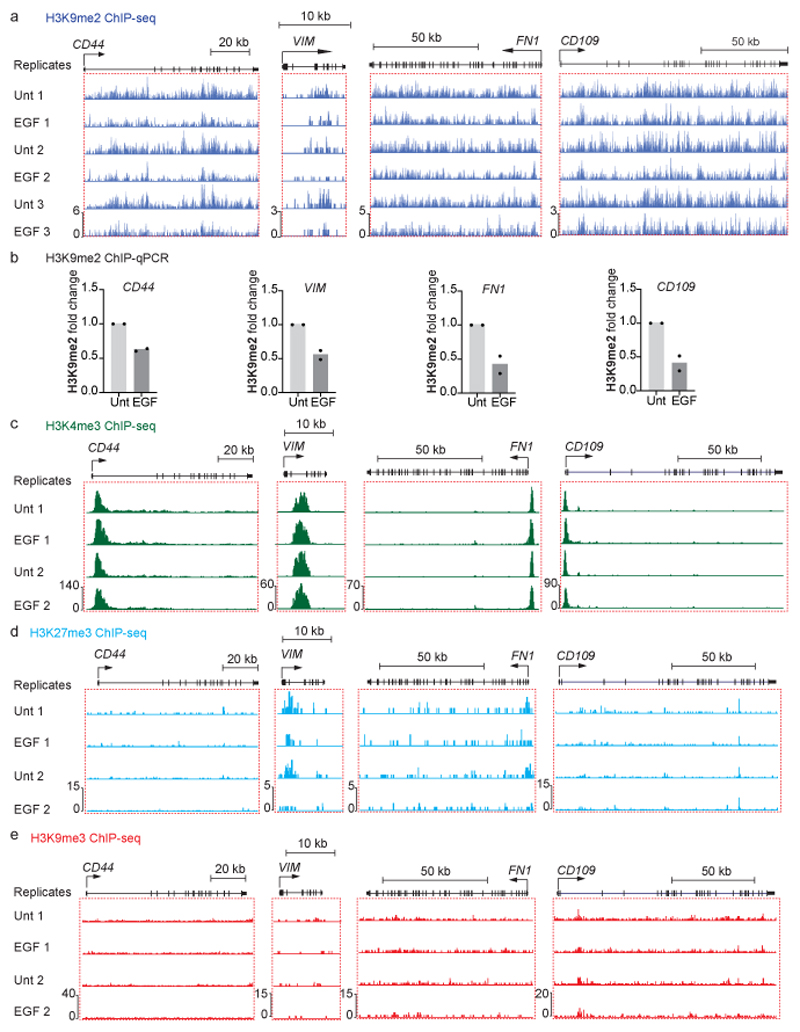
CD44 is a transmembrane glycoprotein linked to various biological processes reliant on epigenetic plasticity, which include development, inflammation, immune responses, wound healing and cancer progression. Although it is often referred to as a cell surface marker, the functional regulatory roles of CD44 remain elusive. Here we report the discovery that CD44 mediates the endocytosis of iron-bound hyaluronates in tumorigenic cell lines, primary cancer cells and tumours. This glycan-mediated iron endocytosis mechanism is enhanced during epithelial-mesenchymal transitions, in which iron operates as a metal catalyst to demethylate repressive histone marks that govern the expression of mesenchymal genes. CD44 itself is transcriptionally regulated by nuclear iron through a positive feedback loop, which is in contrast to the negative regulation of the transferrin receptor by excess iron. Finally, we show that epigenetic plasticity can be altered by interfering with iron homeostasis using small molecules. This study reveals an alternative iron-uptake mechanism that prevails in the mesenchymal state of cells, which illuminates a central role of iron as a rate-limiting regulator of epigenetic plasticity.


Conflict of interest statement

Competing financial interests

The authors declare no competing interests.

Figures

Extended data figure 1
Extended data figure 2
Extended data figure 3
Extended data figure 4
Extended data figure 5
Extended data figure 6
Figure 1|
Figure 1|. CD44 mediates hyaluronate-dependent iron endocytosis.
a, Molecular structure (top) and 1H NMR spectra of LMM-Hyal (bottom). Functional groups susceptible to reversibly interact with iron are highlighted in red. TFA, trifluoroacetic acid. b, Western blot analysis of CD44 and TfR1 levels in CD44 and TFRC ko clones generated using CRISPR-Cas9. c, Fluorescence microscopy analysis of internalized Hyal-FITC. N = 3 biologically independent experiments. d, Fluorescence microscopy analysis of RhoNox-M-positive vesicles colocalizing with internalized Hyal-FITC or TF-647. Dotted lines delineate the cell contours. N = 3 biologically independent experiments. e, Fluorescence microscopy analysis of RhoNox-M-positive vesicles colocalizing with Hyal-FITC in a CD44 ko clone complemented with CD44. N = 3 biologically independent experiments. f, SIMS imaging of cellular iron in TFRC ko cells. Yellow lines delineate the cell contours. N = 1. At least 50 cells were quantified per condition. FAC, ferric ammonium citrate. g, ICP-MS measurements of cellular iron. N = 5 biologically independent experiments. h, Western blot analysis of ferritin levels representative of 8 biologically independent experiments. i, Schematic illustration of CD44high/low cell sorting from a PDX by flow cytometry. Western blot analysis of iron homeostasis proteins in CD44high/low cells sorted from breast cancer tumors. N = 1. Parental HMLER CD44high and corresponding ko cell lines were used throughout panels b-h. Scale bars, 10 μm. DAPI, 4',6-diamidino-2-phenylindole; Unt., untreated. HMM-Hyal (0.6-1 MDa) was used in f-h. Data representative of three independent experiments unless stated otherwise. Bars and error bars, mean values +/− SD. One-way ANOVA with Bonferroni correction for c, d, e. Unpaired t-test for g, h. Statistical tests throughout the figure two-sided. Full western blots see Supplementary Information.
Figure 2|
Figure 2|. CD44-mediated iron endocytosis prevails in the mesenchymal state of cells.
a, Fluorescence microscopy analysis of EMT markers (scale bar, 10 μm) and bright field microscopy analysis of cell morphology (scale bar, 100 μm). b, Time course western blot analysis of levels of iron homeostasis and EMT markers. c, Time course flow cytometry analysis of CD44 and TfR1 loading at the plasma membrane. d, Fluorescence microscopy analysis of RhoNox-M-positive vesicles colocalizing with internalized Hyal-FITC or TF-647. Scale bar, 10 μm. N = 3 biologically independent experiments. e, ICP-MS measurements of cellular iron. N = 11 biologically independent experiments. f, Western blot analysis of ferritin levels in CD44 knock down conditions. g, Time course RT-qPCR analysis of CD44, TFRC and FTH1 mRNA levels. N = 3 biologically independent experiments. MDA-MB-468 cells were used throughout the figure and were treated with EGF for 72 h, unless stated otherwise. Data representative of three independent experiments unless stated otherwise. Bars and error bars, mean values +/− SD. Unpaired t-test for d, e. One-way ANOVA with Bonferroni correction for g. Statistical tests throughout the figure two-sided. Full western blots see Supplementary Information.
Figure 3|
Figure 3|. EMT is characterized by a redox signature implicating iron.
a, Quantitative label-free proteomics. Volcano plot representing protein expression fold changes. Upregulated (right) and downregulated (left) proteins are shown. Dashed blue line defines a fold change of 1.42, continuous blue line defines a P-value of 0.05. The mitochondrial iron-sulfur cluster-containing protein ACO2 and the nuclear iron-dependent demethylase PHF8 are highlighted in red. N = 3 biologically independent experiments. b, Schematic illustration of metabolic pathways involved in the production of αKG. Enzymes that are upregulated at the protein level during EMT are highlighted in red. c, Quantitative metabolomics. Heatmap of upregulated (red) and downregulated (green) metabolites in cells treated with EGF for 60 h. N = 4 technical replicates. d, Quantification of αKG levels in cells treated as indicated using an αKG assay. Cells were treated as indicated for 72 h. N = 3 technical replicates. e, Quantification of αKG levels in CD44 knock down conditions using an αKG assay. N = 3 biologically independent experiments. MDA-MB-468 cells were used in a, b, c, e and were treated with EGF for 72 h, unless stated otherwise. Bars and error bars, mean values +/− SD. Statistical analysis for a see Supplementary Information. Unpaired t-test for d. One-way ANOVA with Bonferroni correction for e. Statistical tests throughout the figure two-sided.
Figure 4|
Figure 4|. Nuclear iron is a rate-limiting regulator of epigenetic plasticity.
a, Catalytic cycle of iron-mediated oxidative demethylation of a methylated lysine residue. b, Subcellular fractionation and western blot analysis of nuclear ferritin levels. NE, nuclear extract; CE, cytoplasmic extract; WCE, whole cell extract. c, Quantitative mass spectrometry. Heatmap of H3K9me2, H3K9me3 and H3K27me3 levels. N = 5 biologically independent experiments. d, Western blot analysis of H3K9me2 levels in PHF8 knock down conditions. e, H3K9me2 ChIP-seq profiles for selected genes. f, Scatter plot correlation of H3K9me2 ChIP-seq reads count in genes (N = 3 biologically independent experiments) and RNA-seq (N = 3 biologically independent experiments). g, Western blot analysis of proteins whose genes are regulated by H3K9me2 in PHF8 knock down conditions. h, Western blot analysis of H3K9me2 levels in CD44 knock down conditions. i, Western blot analysis of proteins whose genes are regulated by H3K9me2 in CD44 knock down conditions. j, Western blot analysis of fibronectin, PHF8 and H3K9me2 in CD44high/low cells sorted from breast cancer tumors. N = 1. MDA-MB-468 cells were used for b-i and treated with EGF for 72 h. Data representative of three independent experiments unless stated otherwise. Two-sided associated t-tests for c. Statistical analysis for f see Supplementary Information. Full western blots see Supplementary Information.
Figure 5|
Figure 5|. Targeting iron homeostasis interferes with the maintenance of mesenchymal cells.
a, Molecular structure of cDFO (top), schematic illustration of the chemical labeling of cDFO in cells (bottom) and fluorescence microscopy images of labeled cDFO and DAPI (right). 488 represents the Alexa-Fluor-488 fluorophore. Scale bar, 10 μm. b, Western blot analysis of H3K9me2 levels in cells cotreated with EGF and DFO. N = 1 for primary cells. c, Western blot analysis of proteins whose genes are regulated by H3K9me2 in cells cotreated with EGF and DFO. N = 1 for primary cells. d, Quantification of αKG using an αKG assay. N = 4 biologically independent experiments. e, Western blot analysis of H3K9me2 levels in cells cotreated with EGF and metformin. f, Cell viability curves of cells cotreated with EGF and ironomycin. N = 4 biologically independent experiments. g, Flow cytometry analysis of C11-BODIPY treated as indicated. N = 1. Data representative of three independent experiments unless stated otherwise. Bars and error bars, mean values +/− SD. One-way ANOVA with Bonferroni correction for d. Two-way ANOVA with Bonferroni correction for f. Statistical tests throughout the figure two-sided. Full western blots see Supplementary Information.
Figure 6|
Figure 6|. Reciprocal endocytic-epigenetic regulation involving iron.
TF or iron-bound Hyal enters cells by means of TfR1-or CD44-mediated endocytosis. Excess cellular iron inhibits the canonical TfR1 pathway. Nuclear iron, αKG produced in mitochondria and iron-dependent enzymes mediate oxidative demethylation of chromatin marks to unlock the expression of specific genes including CD44. CD44 positively regulates its own expression at the transcriptional level by mediating iron endocytosis and this pathway prevails in the mesenchymal state of cells. Iron homeostasis can be targeted at the plasma membrane, the endosomal/lysosomal compartment, the mitochondria and in the nucleus using specific antibodies or small molecules.

References

    1. Ponta H, Sherman L, Herrlich PA. CD44: from adhesion molecules to signalling regulators. Nat Rev Mol Cell Biol. 2003;4:33–45. - PubMed
    1. Zöller M. CD44: can a cancer-initiating cell profit from an abundantly expressed molecule? Nat Rev Cancer. 2011;11:254–267. - PubMed
    1. Nieto MA, Huang RY, Jackson RA, Thiery JP. EMT: 2016. Cell. 2016;166:21–45. - PubMed
    1. Brabletz T, Kalluri R, Nieto MA, Weinberg RA. EMT in cancer. Nat Rev Cancer. 2018;18:128134 - PubMed
    1. Pastushenko I, et al. Identification of the tumour transition states occurring during EMT. Nature. 2018;556:463–468. - PubMed

Publication types

LinkOut - more resources