. 2020 Oct;23(10):1253-1266.
doi: 10.1038/s41593-020-0684-9. Epub 2020 Aug 3.

High-fat food biases hypothalamic and mesolimbic expression of consummatory drives

Affiliations

High-fat food biases hypothalamic and mesolimbic expression of consummatory drives

Christopher M Mazzone et al. Nat Neurosci. 2020 Oct.

Abstract

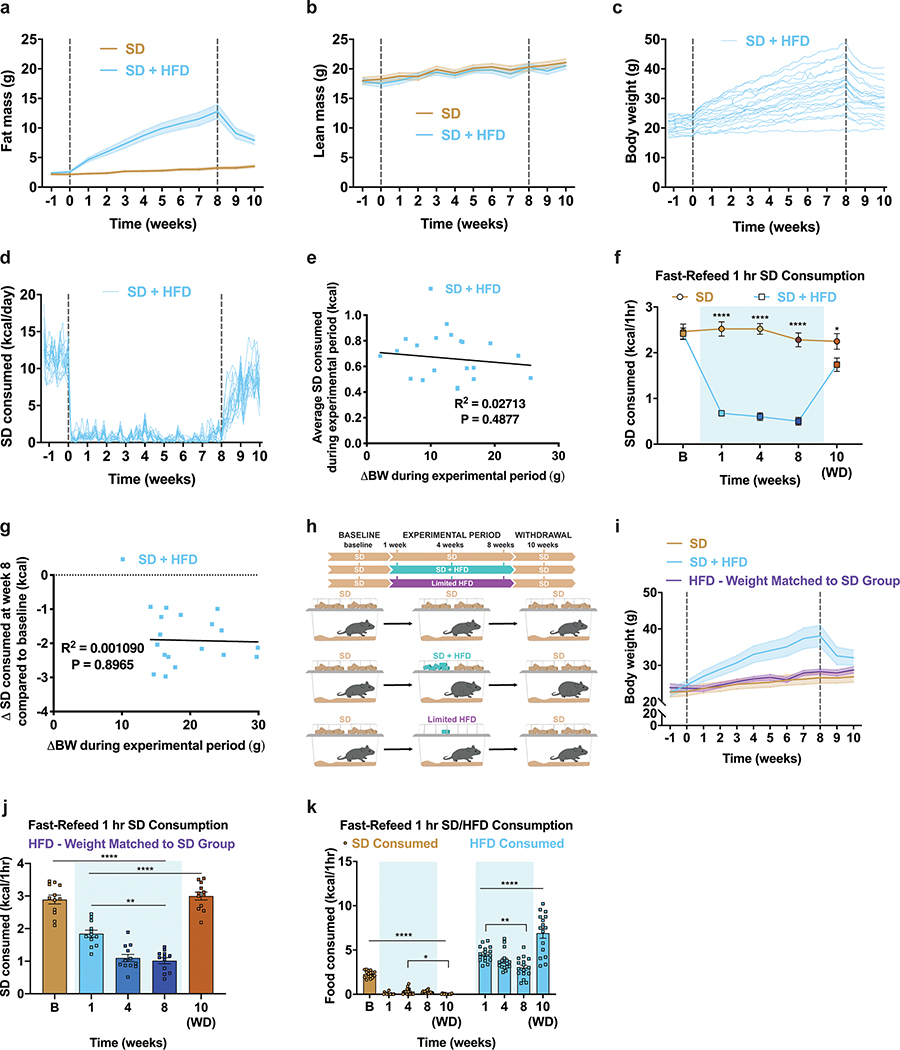
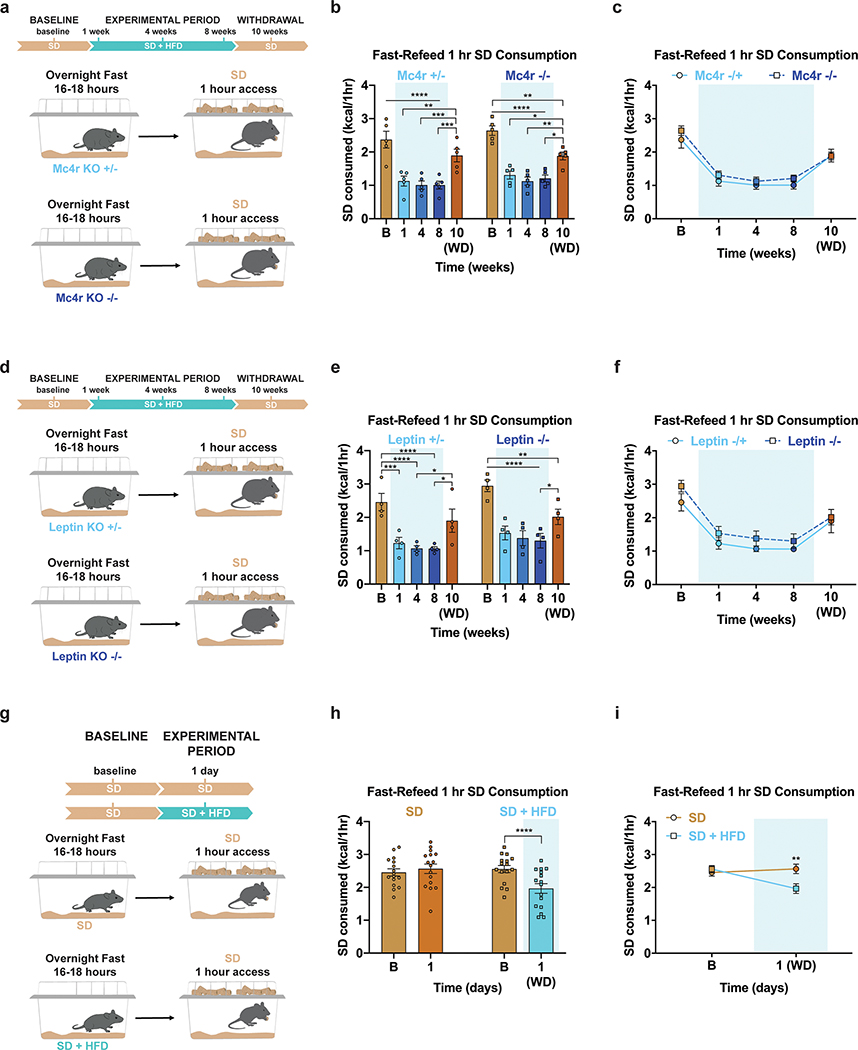
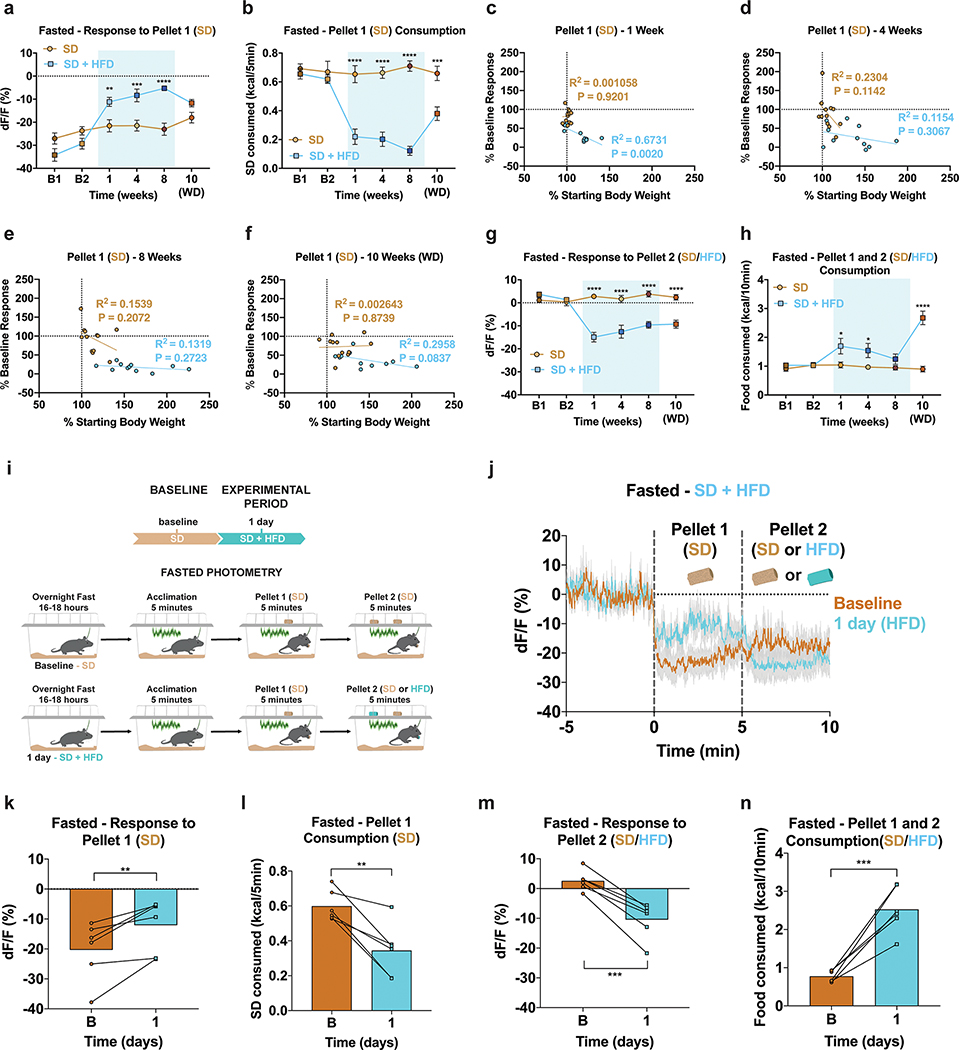
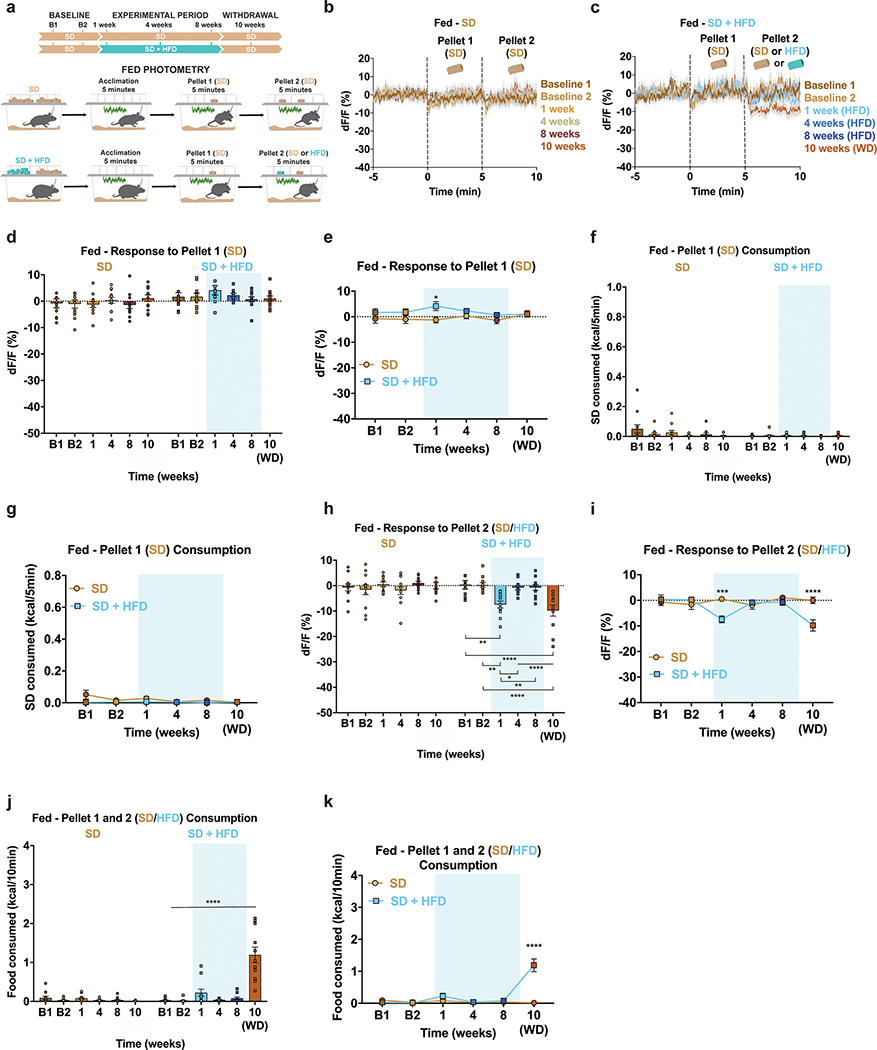
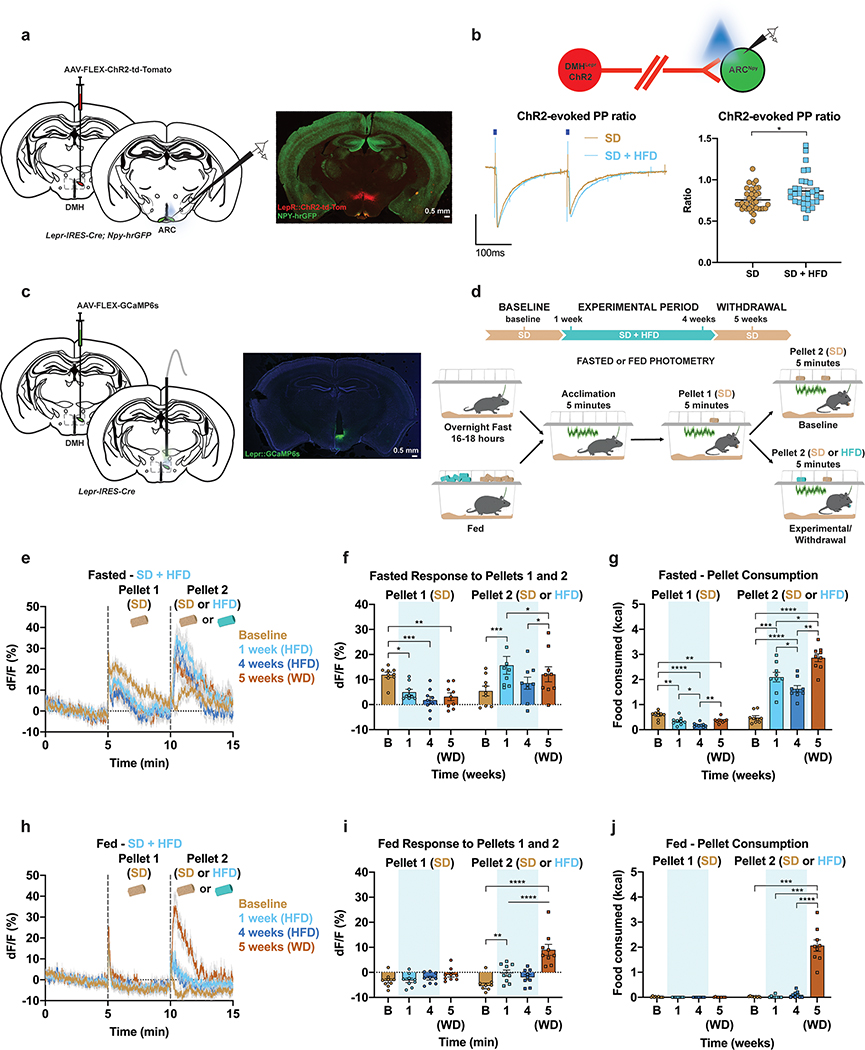
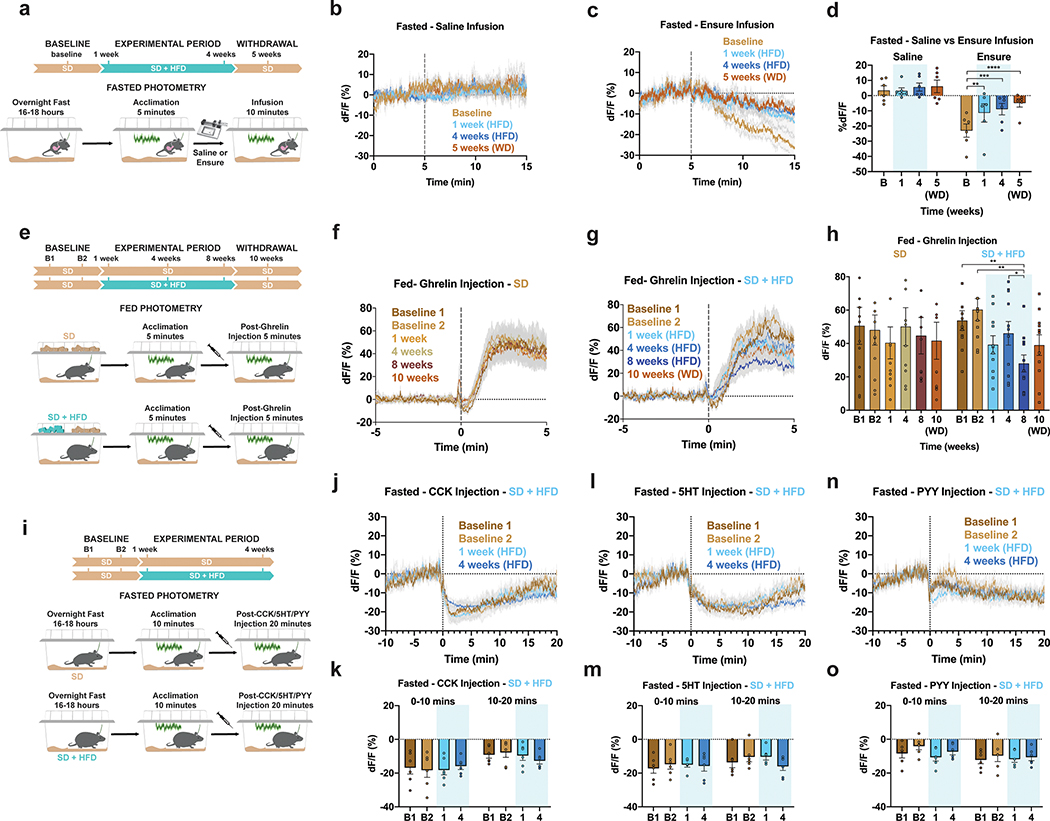
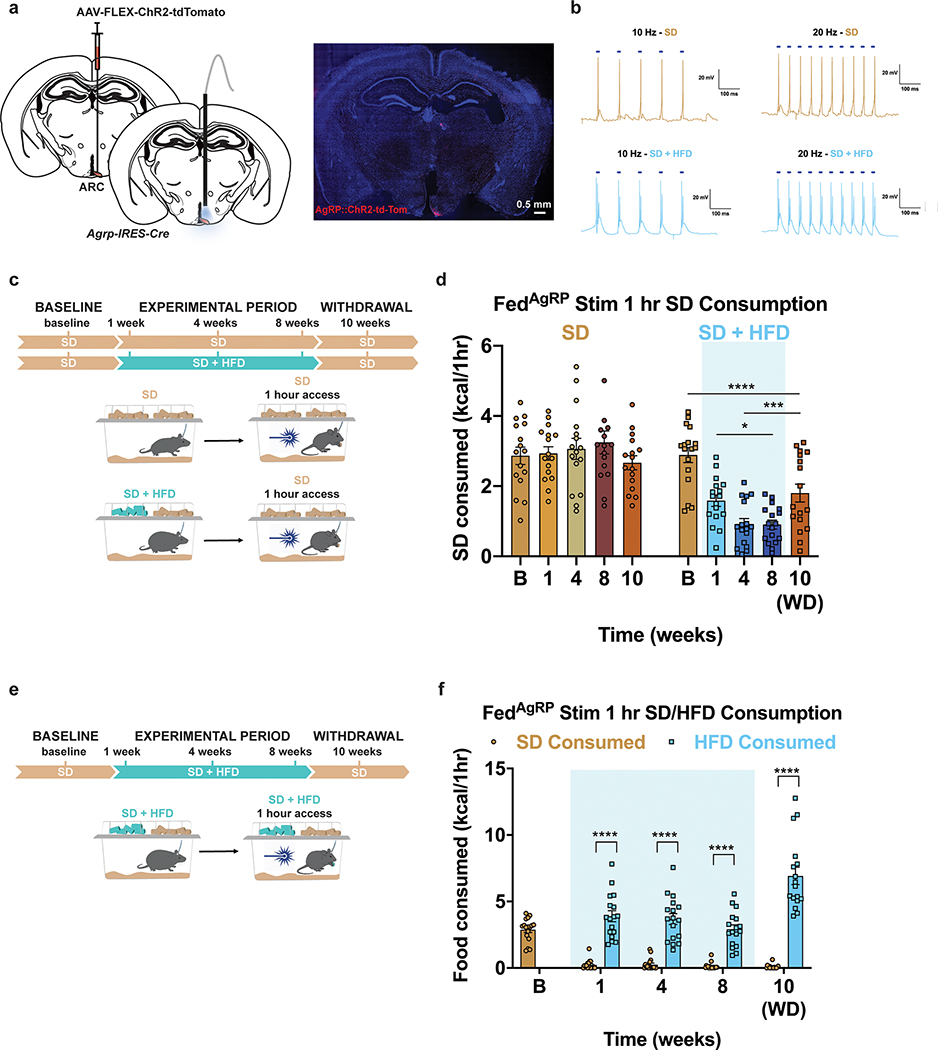
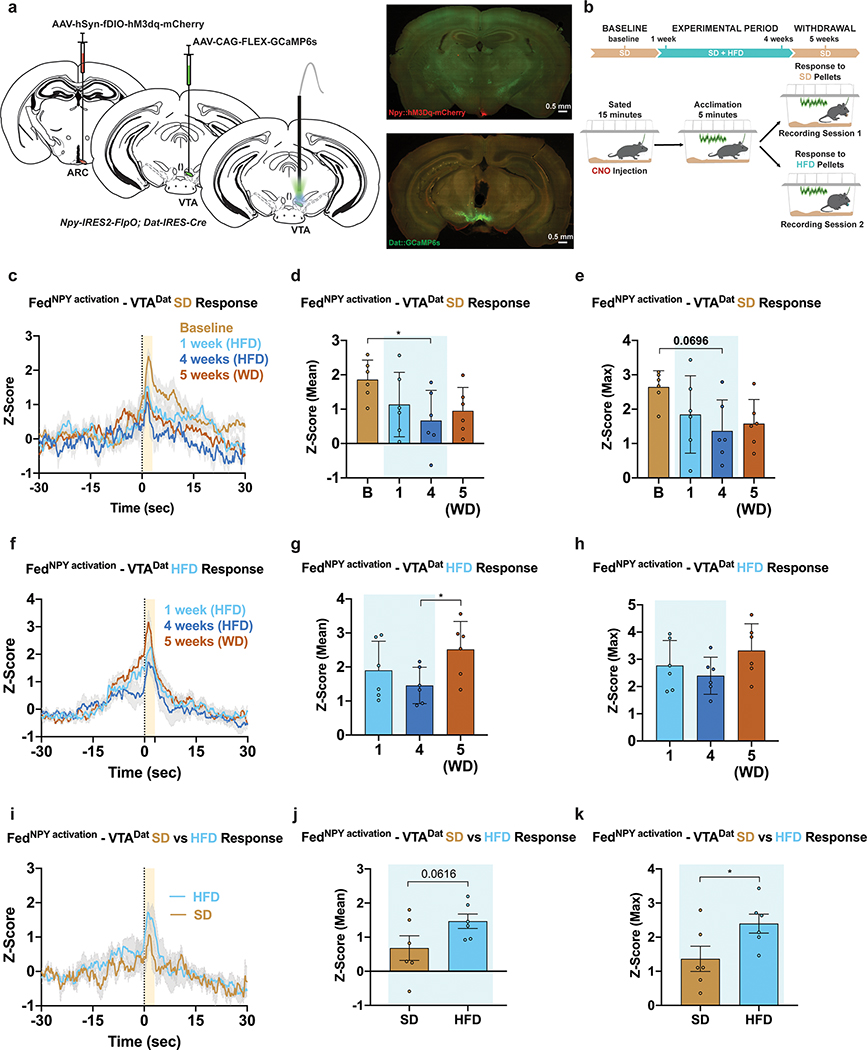
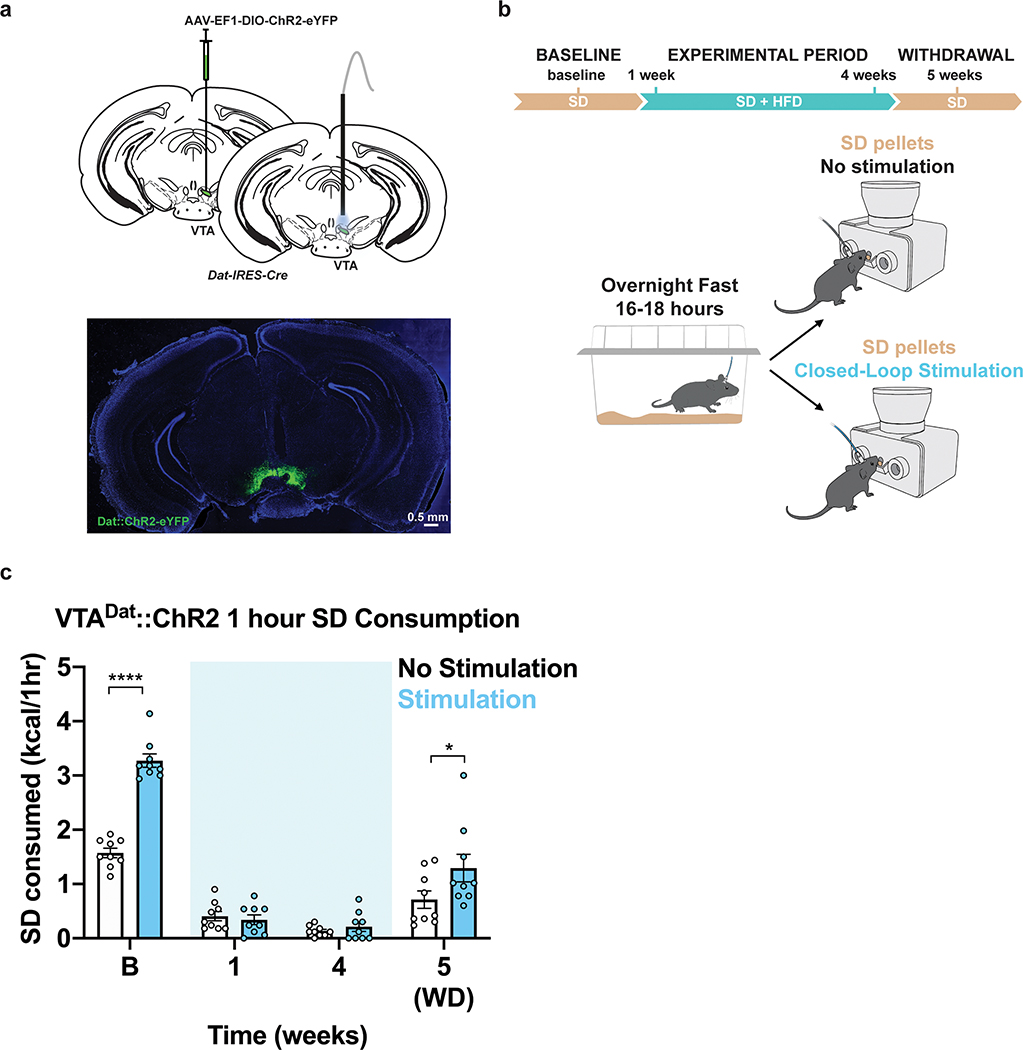
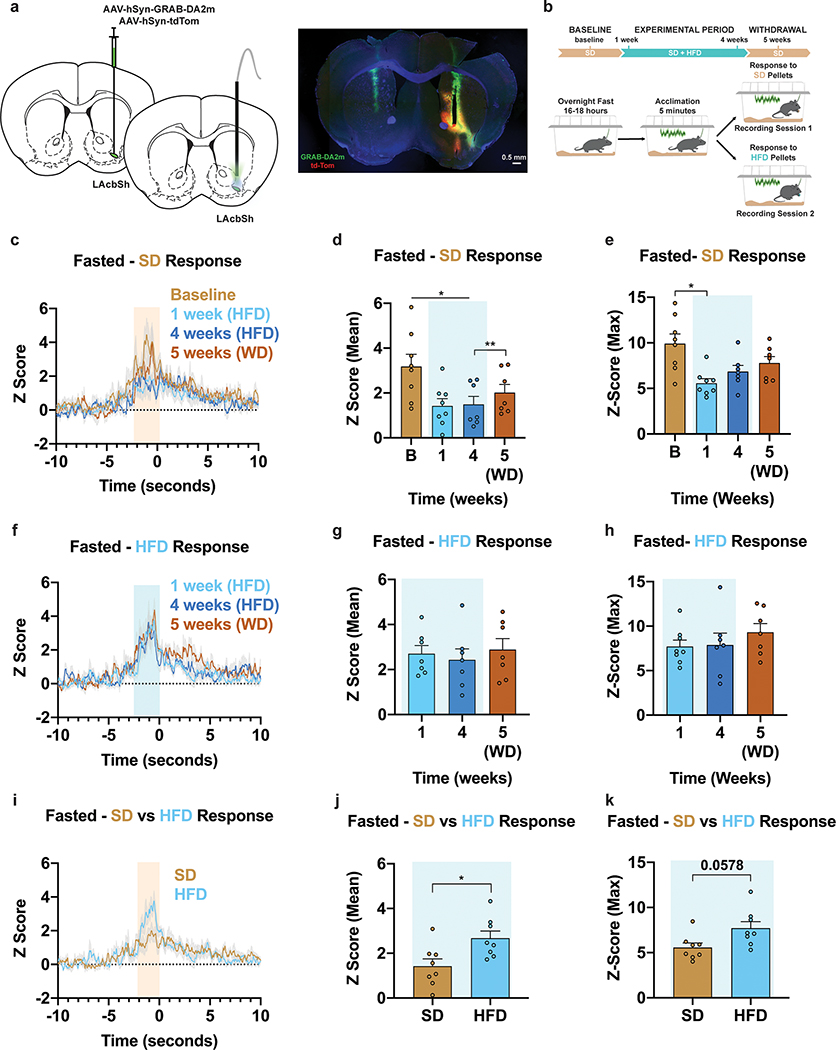
Maintaining healthy body weight is increasingly difficult in our obesogenic environment. Dieting efforts are often overpowered by the internal drive to consume energy-dense foods. Although the selection of calorically rich substrates over healthier options is identifiable across species, the mechanisms behind this choice remain poorly understood. Using a passive devaluation paradigm, we found that exposure to high-fat diet (HFD) suppresses the intake of nutritionally balanced standard chow diet (SD) irrespective of age, sex, body mass accrual and functional leptin or melanocortin-4 receptor signaling. Longitudinal recordings revealed that this SD devaluation and subsequent shift toward HFD consumption is encoded at the level of hypothalamic agouti-related peptide neurons and mesolimbic dopamine signaling. Prior HFD consumption vastly diminished the capacity of SD to alleviate the negative valence associated with hunger and the rewarding properties of food discovery even after periods of HFD abstinence. These data reveal a neural basis behind the hardships of dieting.


Conflict of interest statement

Competing interests The authors declare no conflicts of interest.

Figures

Extended Data Fig. 1:
Extended Data Fig. 1:. HFD-exposure promotes fat mass accrual, reduction of homecage SD intake and devaluation of SD in physiologically hungry mice independent of weight gain.
Weekly a, fat mass (n=20, males and females, RM two-way ANOVA, Week x Group: F (11, 418) = 50.17, P<0.0001, Sidak’s multiple comparisons test) and b, lean mass throughout diet exposure (n=20, males and females, RM two-way ANOVA, Week x Group: F (11, 418) = 0.8075, P=0.6326). Daily c, body weights and d, SD intake throughout the duration of the experiment of individual animals exposed to HFD. e, No correlation between the average amount of SD intake during the HFD-exposure period and body weight changes after 8 weeks of SD and HFD access (n=20, males and females, Linear regression, R2= 0.02713, P=0.4877). f, Between-subject comparison of 1 hr SD fast-refeed consumption across test sessions (n=16 SD group, n=18 SD + HFD group, males and females, RM two-way ANOVA, Time x Group: F (4, 128) = 28.99, P<0.0001, Bonferroni’s multiple comparisons test). g, No correlation between SD devaluation at Week 8 relative to Baseline and body weight changes after 8 weeks of access to SD and HFD (n=18, males and females, Linear regression, R2=0.001090, P=0.8965). h, Experimental timeline, group schematic for home cage measurements and i, and daily body weights throughout the duration of the experiment (n=12 per group, males and females). j, Within-subject comparison of 1 hr SD fast-refeed consumption across testing sessions (n=12 limited HFD weight-matched to SD group, males and females, RM one-way ANOVA, Time: F (2.431, 26.74) = 66.81, P<0.0001, Tukey’s multiple comparisons). k, Within-subject, within-diet comparisons of 1 hr SD and HFD fast-refeed consumption across testing sessions (n=18, males and females, RM one-way ANOVAs, Tukey’s multiple comparisons). Dotted lines in a, b, c, d and i delineate window of HFD availability. All error bars and shaded areas in a, b and i represent mean ± s.e.m. Shaded blue area in f, j, and k represent HFD homecage availability. *P < 0.05, **P < 0.01, ****P < 0.0001.
Extended Data Fig. 2:
Extended Data Fig. 2:. Intact melanocortin-4 receptor- or leptin-signaling are dispensable for SD devaluation following HFD-exposure and 24 hours of HFD-exposure is sufficient to devalue SD.
a,d Experimental timeline and group schematic for fast-refeed test with 1 hr SD access. b,e Within-subject and c,f between-subject comparisons of 1 hr SD fast-refeed consumption across testing sessions (n=5 per Mc4r KO +/− and −/− group, males and females, RM two-way ANOVA, Time x Group: F (4, 32) = 0.3173, P=0.8643, Tukey’s multiple comparisons) (n=4 per Leptin KO +/− and −/− group, males and females, RM two-way ANOVA, Time x Group: F (4, 24) = 0.3313, P=0.8542, Tukey’s multiple comparisons). g, Experimental timeline and group schematic for fast-refeed test with 1 hr SD access. h, Within-subject and i, between-subject comparisons of 1 hr SD fast-refeed consumption across testing sessions (n=16 per group, males and females, RM two-way ANOVA, Time x Group: F (1, 30) = 16.96, P=0.0003, Sidak’s multiple comparisons test). B=Baseline. WD=withdrawal. Shaded blue area in b, c, e, f, h and i represent HFD homecage availability. All error bars represent s.e.m. *P < 0.05, **P < 0.01, ***P < 0.001, ****P < 0.0001.
Extended Data Fig. 3:
Extended Data Fig. 3:. Acute and chronic HFD-exposure alters ARCAgRP activity responses to SD and HFD in fasted mice largely independent of body-weight changes.
a, Between-subject quantification of fasted ARCAgRP activity response to Pellet 1 (SD) (n=12 SD group, n=11 SD + HFD group, males and females, RM two-way ANOVA, Time x Group: F (5, 105) = 16.74, P<0.0001, Bonferroni’s multiple comparisons) and b, SD consumed across testing sessions (n=12 SD group, n=11 SD + HFD group, males and females, RM two-way ANOVA, Time x Group: F (5, 105) = 15.81, P<0.0001, Bonferroni’s multiple comparisons). c-f, ARCAgRP activity changes to Pellet 1 (SD) presentation are not strongly correlated with bodyweight accrual over the entire length of the experiment (n=12 SD group, n=11 SD + HFD group, males and females, Linear regression, c, SD group: R2=0.001058, P=0.9201, SD+HFD group: R2=0.6731, P=0.0020, d, SD group: R2=0.2304, P=0.1142, SD + HFD group: R2=0.1154, P=0.3067, e, SD group: R2=0.1539, P=0.2072, SD + HFD group: R2=0.1319, P=0.2723, f, SD group: R2=0.002643, P=0.8739, SD + HFD group: R2=0.2958, P=0.0837) g, Between-subject quantification of fasted ARCAgRP activity response to Pellet 2 (SD for SD group; SD for SD + HFD group during B1 and B2 and HFD for SD + HFD group during 1, 4, 8 and 10 weeks) (n=12 SD group, n=11 SD + HFD group, males and females, RM two-way ANOVA, Time x Group: F (5, 105) = 21.07, P<0.0001, Bonferroni’s multiple comparisons) and h, total calories consumed across testing sessions (n=12 SD group, n=11 SD + HFD group, males and females, RM two-way ANOVA, Time x Group: F (5, 105) = 14.26, P<0.0001, Bonferroni’s multiple comparisons). i, Experimental timeline and group schematic for fasted photometry recordings. j, Average fasted photometry traces across recording sessions aligned to Pellet 1 and 2 presentation (n=6, males and females). k, Within-subject quantification of fasted ARCAgRP activity response to Pellet 1 (SD) (n=6, males and females, Paired t test (two-tailed), P=0.0099) and l, SD consumed across testing sessions (n=6, males and females, Paired t test (two-tailed), P=0.0049). m, Within-subject quantification of fasted ARCAgRP activity response to Pellet 2 (SD for Baseline; HFD for 1 day) (n=6, males and females, Paired t test (two-tailed), P=0.0008) and n, total calories consumed across testing sessions (n=6, males and females, Paired t test (two-tailed), P=0.0008). Shaded blue area in a-b, and g-h represent HFD homecage availability. B1 and B2 refer to Baseline 1 and 2, respectively. WD=withdrawal. Dotted lines in j indicate Pellet 1 and Pellet 2 presentation. All error bars and shaded regions of j represent s.e.m. *P < 0.05, **P < 0.01, ***P < 0.001, ****P < 0.0001.
Extended Data Fig. 4:
Extended Data Fig. 4:. HFD-exposure alters ARCAgRP activity responses to HFD in fed mice.
a, Experimental timeline and group schematic for fed photometry recordings. b-c, Average fed photometry traces of the b, SD group and c, SD + HFD group across recording sessions aligned to Pellet 1 and 2 presentation (n=12 SD group, n=11 SD + HFD group, males and females). d, Within- and e, between-subject quantification of fed ARCAgRP activity response to Pellet 1 (SD) (n=12 SD group, n=11 SD + HFD group, males and females, RM two-way ANOVA, Time x Group: F (5, 105) = 0.8953, P=0.4872, Bonferroni’s multiple comparisons). f, Within- and g, between-subject quantification of SD consumed across testing sessions (n=12 SD group, n=11 SD + HFD group, males and females, RM two-way ANOVA, Time x Group: F (5, 105) = 1.768, P=0.1258). h, Within- and i, between-subject quantification of fed ARCAgRP activity response to Pellet 2 (SD for SD group; SD for SD + HFD group during B1 and B2 and HFD for SD + HFD group during 1, 4, 8 and 10 weeks) (n=12 SD group, n=11 SD + HFD group, males and females, RM two-way ANOVA, Time x Group: F (5, 105) = 7.565, P<0.0001, Bonferroni’s multiple comparisons). j, Within- and k, between-subject quantification of total calories consumed across testing sessions (n=12 SD group, n=11 SD + HFD group, males and females, RM two-way ANOVA, Time x Group: F (5, 105) = 31.68, P<0.0001, Bonferroni’s multiple comparisons). Dotted lines in b,c indicate Pellet 1 and Pellet 2 presentation. Shaded blue area in d-k represent HFD homecage availability. B1 and B2 refer to Baseline 1 and 2, respectively. WD=withdrawal. All error bars and shaded regions of b-c represent s.e.m. *P < 0.05, **P < 0.01, ***P < 0.001, ****P < 0.0001.
Extended Data Fig. 5:
Extended Data Fig. 5:. Spectrum-based fiber photometry reveals diminished ARCAgRP baseline activity following HFD exposure.
a, Representative GCaMP and tdTomato emission spectra from a mouse during the Fed and Fasted sessions of Baseline 1 prior to the addition of food. b, GCaMP/tdTomato ratios normalized to the mean of Baseline 1+2 Fed values shows basal ARCAgRP activity is increased during Fasted sessions relative to Fed sessions (SD – Fed vs Fasted; HFD – Fed vs Fasted). Homecage HFD exposure reduces basal ARCAgRP activity relative to the SD group across both Fed and Fasted conditions (Fed – SD vs HFD; Fasted – SD vs HFD) (n=12 SD group, n=11 SD + HFD group, males and females, three-way ANOVA, Diet: F(1,21) = 6.515, P=0.019, Satiety state: F(1,63) = 94.128, P<0.0001) c, Fasted GCaMP/tdTomato ratios normalized to the Fed values across recording sessions demonstrates an ~50% fasting-induced increase in the GCaMP/tdTomato ratio across all recording weeks (n=12 SD group, n=11 SD + HFD group, males and females, RM two-way ANOVA, Time x Group: F (5, 105) = 1.978, P=0.0879). B1 and B2 refer to Baseline 1 and 2, respectively. WD=withdrawal.
Extended Data Fig. 6:
Extended Data Fig. 6:. Physiological disruption of ARCAgRP activity in response to HFD-exposure is partially dependent on body weight gain.
a, Changes in ARCAgRP activity in response to identical caloric load is correlated to weight gain 1, but not 4 weeks after HFD exposure or 1 week HFD withdrawal (n=6, males and females, Linear regression, 1 week (HFD): R2=0.6903, P=0.0405, 4 weeks (HFD): R2=0.1356, P=0.4727, 5 weeks (WD): R2=0.003755, P=0.9082). b-e, Changes in ARCAgRP activity in response to ghrelin is correlated to weight gain (n=12 SD group, n=11 SD + HFD group, males and females, Linear regression, b, SD group: R2=0.01466, P=0.7078, SD+HFD group: R2=0.3905, P=0.0398, c, SD group: R2=0.05629, P=0.4578, SD+HFD group: R2=0.4724, P=0.0194, d, SD group: SD group: R2=0.1504, P=0.2129, SD+HFD group: R2=0.2336, P=0.1321), e, SD group: R2=0.2907, P=0.0705, SD+HFD group: R2=0.4042, P=0.0355. f-k, Changes in ARCAgRP activity in response to f-g, CCK, h-I, 5HT or j-k, PYY is not correlated to weight gain (n=5 SD group, n=6 SD + HFD group, males and females, Linear regression, f, SD group: R2=0.008391, P=0.8835, SD+HFD group: R2=0.09392, P=0.5547, g, SD group: R2=0.003959, P=0.9199, SD+HFD group: R2=0.06259, P=0.6326, h, SD group: R2=0.6037, P=0.1221, SD+HFD group: R2=0.0009157, P=0.9546, i, SD group: R2=0.6415, P=0.1034, SD+HFD group: R2=0.0007729, P=0.9583, j, SD group: R2=0.3514, P=0.2922, SD+HFD group: R2=0.05138, P=0.6602, k, SD group: R2=0.09218, P=0.6194, SD+HFD group: R2=0.01706, P=0.8052). l,n,p, Average photometry traces of the SD group across recording sessions aligned to l, CCK, n, 5HT or p, PYY injection (n=5 SD group, males and females). m,o,q, Within-subject quantification of ARCAgRP activity to m, CCK (n=5 SD group, males and females, RM two-way ANOVA, Time Bin x Week: F (1.511, 6.045) = 1.014, P=0.3923), o, 5HT (n=5 SD group, males and females, RM two-way ANOVA, Time Bin x Week: F (2.334, 9.337) = 1.242, P=0.3393) or q, PYY (n=5 SD group, males and females, RM two-way ANOVA, Time Bin x Week: F (1.897, 7.589) = 1.885, P=0.2164) across testing sessions. Dotted lines indicate l, CCK, n, 5HT or p, PYY injection. B1 and B2 refer to Baseline 1 and 2, respectively. All error bars and shaded regions of l,n, and p represent s.e.m.
Extended Data Fig. 7:
Extended Data Fig. 7:. HFD exposure promotes devaluation of optogenetic ARCAgRP-evoked SD, but not HFD, and consumption independent of weight gain.
a, Between-subject comparison of fedAgRP stimulation 1 hr SD consumption across test sessions (n=16 SD group, n=17 SD + HFD group, males and females, RM two-way ANOVA, Time x Group: F (4, 124) = 18.85, P<0.0001, Bonferroni’s multiple comparisons). b, No correlation between SD devaluation at Week 8 relative to Baseline and body weight changes after 8 weeks of access to SD and HFD (n=17, males and females, Linear regression, R2=0.04964, P=0.3900). c, Within-subject, within-diet comparisons of fedAgRP stimulation 1 hr SD and HFD consumption across testing sessions (n=17, males and females, RM one-way ANOVAs, Tukey’s multiple comparisons). B=Baseline. WD=Withdrawal. Shaded blue area in a and c represent HFD homecage availability. All error bars represent s.e.m. *P < 0.05, **P < 0.01, ***P < 0.001, ****P < 0.0001.
Extended Data Fig. 8:
Extended Data Fig. 8:. ARCAgRP/Npy activation does not alter basal VTADat activity but potentiates signaling in response to food via an indirect signaling mechanism.
a, Brain schematic of anterograde tracing strategy. b-d, representative images of AgRP::Synaptophysin-tdTomato and tyrosine hydroxylase (TH) in the b, arcuate nucleus, c, paraventricular hypothalamus and d, ventral tegmental area. e, Brain schematic of unilateral viral delivery of Cre-inducible ChR2 to the ARC of AgRP-ires-Cre mice and position of ex vivo slice recordings from PVH (top) and VTA (bottom) cells. f-g, ChR2-assisted circuit mapping schematic and representative trace from f, PVH and g, VTA cells. h, Representative image of Dat-ires-Cre::Ai32-ChR2-eYFP and overlap with TH in the ARC. i, Chemogenetic ARCNpy activation drives food intake (n=6, males and females, Paired t test (two-tailed), P=0.0013). j, Averaged Z-score traces and k, quantification of basal VTADat activity after saline or CNO injections (n=6, males and females, Paired t test (two-tailed), P=0.2837). l, Averaged Z-score traces and m, mean (n=6, males and females, Paired t test (two-tailed), P=0.0656) and n, max quantification (n=6, males and females, Paired t test (two-tailed), P=0.0365) of VTADat activity in response to SD food drop after saline or CNO injections. All error bars represent s.e.m. *P < 0.05, **P < 0.01.
Extended Data Fig. 9:
Extended Data Fig. 9:. VTADat photostimulation is intrinsically rewarding but loses the capacity to enhance SD consumption in fasted mice after HFD exposure.
a, Schematic of Real-Time Place Preference assay. b, Averaged heat maps and quantification of time spent in each chamber of the RTPP assay in VTADat::ChR2 mice (n=9, males, Paired t test (two-tailed), P<0.0001). c, Averaged heat maps and quantification of time spent in each chamber of the RTPP assay in control VTADat::YFP mice (n=6, males, Paired t test (two-tailed), P=0.9576). d, Within-subject and condition comparisons of 1 hr SD consumption across testing sessions with or without VTADat photostimulation (n=9, males, RM two-way ANOVA, Time x Condition: F (3, 48) = 18.30, P<0.0001, Tukey’s multiple comparisons). B=Baseline. WD=Withdrawal. Shaded blue area in d represents HFD homecage availability. All error bars represent s.e.m. ***P < 0.001, ****P < 0.0001.
Extended Data Fig. 10:
Extended Data Fig. 10:. DA responses to SD are state-dependent and consistent over time in HFD-naïve animals.
a, Averaged Z-score traces of DA2m fluorescence aligned to SD pellet retrieval across appetite state (n=8, males and females). b, Within-subject comparisons of mean fluorescence Z-score during SD pellet retrieval across appetite state (n=8, males and females, Paired t test (two-tailed), P=0.0659). c, Within-subject comparisons of SD pellets consumed across appetite state (n=8, males and females, Paired t test (two-tailed), P<0.0001). d, Averaged Z-score traces of DA2m fluorescence aligned to SD pellet retrieval across recording weeks. (n=4, males and females) e, Within-subject comparisons of mean fluorescence Z-score during SD pellet retrieval across sessions (n=4, males and females, Wilcoxon matched-pairs signed rank test, P=0.625). f, Within-subject comparisons of SD pellets consumed across sessions (n=4, males and females, Wilcoxon matched-pairs signed rank test, P>0.9999). Time 0 denotes consumption. B=Baseline. Shaded peach region in a and d represent quantified pellet approach/retrieval period. All error bars and shaded regions of a and d represent s.e.m. ****P < 0.0001.
Figure 1:
Figure 1:. HFD-exposure promotes weight gain and devaluation of SD.
a, Experimental timeline and group schematic for home cage measurements. Daily b, body weight (n=20 per group, males and females, RM two-way ANOVA, Day x Group: F (79, 3002) = 33.34, P<0.0001) c, total food intake (n=20 per group, males and females, RM two-way ANOVA, Day x Group: F (79, 3002) = 18.73, P<0.0001) and d, SD intake throughout the duration of the experiment (n=20 per group, males and females, RM two-way ANOVA, Day x Group: F (79, 3002) = 95.76, P<0.0001). e, Experimental timeline and group schematic for fast-refeed test with 1 hr SD access. f, Within-subject comparison of 1 hr SD fast-refeed consumption across testing sessions (n=16 SD group, n=18 SD + HFD group, males and females, RM two-way ANOVA, Time x Group: F (4, 128) = 28.99, P<0.0001, Tukey’s multiple comparisons). g, Experimental timeline and group schematic for fast-refeed test with 1 hr SD and HFD access. h, Within-subject comparison of 1 hr SD and HFD fast-refeed consumption across testing sessions (n=16, males and females, RM two-way ANOVA, Time x Diet: F (3, 90) = 30.58, P<0.0001, Tukey’s multiple comparisons). Dotted lines in b, c, d delineate window of HFD availability. B=Baseline. WD=withdrawal. Shaded blue area in f and h represent HFD homecage availability. All error bars and shaded regions of b, c, and d represent mean ± s.e.m. ***P < 0.001, ****P < 0.0001.
Figure 2:
Figure 2:. HFD-exposure alters ARCAgRP activity responses to SD and HFD in fasted mice.
a, Left, Brain schematic of unilateral viral delivery of Cre-inducible GCaMP6s to the ARC of AgRP-ires-Cre; Ai9-tdTomato reporter mice and optical fiber implant. Right, representative image of GCaMP6s and tdTomato expression. b, Experimental timeline and group schematic for fasted photometry recordings. c-d, Average fasted photometry traces of the c, SD group and d, SD + HFD group across recording sessions aligned to Pellet 1 and 2 presentation (n=12 SD group, n=11 SD + HFD group, males and females). e, Within-subject quantification of fasted ARCAgRP activity response to Pellet 1 (SD) (n=12 SD group, n=11 SD + HFD group, males and females, RM two-way ANOVA, Time x Group: F (5, 105) = 16.74, P<0.0001, Bonferroni’s multiple comparisons). and f, SD consumed across testing sessions during the first 5 minutes of food access (n=12 SD group, n=11 SD + HFD group, males and females, RM two-way ANOVA, Time x Group: F (5, 105) = 15.81, P<0.0001, Bonferroni’s multiple comparisons). g, Within-subject quantification of fasted ARCAgRP activity response to Pellet 2 (SD for SD group; SD for SD + HFD group during B1 and B2 and HFD for SD + HFD group during 1, 4, 8 and 10 weeks) (n=12 SD group, n=11 SD + HFD group, males and females, RM two-way ANOVA, Time x Group: F (5, 105) = 21.07, P<0.0001, Bonferroni’s multiple comparisons) and h, total calories consumed across testing sessions (n=12 SD group, n=11 SD + HFD group, males and females, RM two-way ANOVA, Time x Group: F (5, 105) = 14.26, P<0.0001, Bonferroni’s multiple comparisons). i-j, Average fasted photometry traces of the i, SD group and j, SD + HFD group across recording sessions aligned to Pellet 1 (SD) consumption. k, Within-subject quantification of fasted ARCAgRP activity response to Pellet 1 (SD) consumption (n=12 SD group, n=8–11 SD + HFD group, males and females, Mixed-effects model (REML), Time x Group: F (5, 99) = 3.735, P=0.0039, Bonferroni’s multiple comparisons). Dotted lines in c,d indicate Pellet 1 and Pellet 2 presentation. Dotted lines in i,j indicate Pellet 1 consumption. Shaded blue area in e-h, and k represent HFD homecage availability. B1 and B2 refer to Baseline 1 and 2, respectively. WD=withdrawal. All error bars and shaded regions of c-d and i-j represent s.e.m. *P < 0.05, **P < 0.01, ***P < 0.001, ****P < 0.0001.
Figure 3:
Figure 3:. HFD exposure induces alterations in DMHLepR responses to SD.
a, Left, Brain schematic of unilateral viral delivery of Cre-inducible ChR2 to the DMH of LepR-ires-Cre; Npy-hrGFP mice and position of ex vivo slice recordings from ARCNpy cells. Right, representative image of ARC slice showing NPY-hrGFP and DMHLepR::ChR2 terminals. b, Top, Schematic of light-evoked paired-pulse recordings. Left, representative traces. Right, quantification of ratio (n=37 cells/4 mice in the SD group, 31 cells/4 mice in the SD + HFD group, Unpaired t-test (two-tailed) Welch’s correction, P=0.0152). c, Left, Brain schematic of unilateral viral delivery of Cre-inducible GCaMP6s to the DMH of LepR-ires-Cre mice and optical fiber implant. Right, representative image of GCaMP6s expression. d, Experimental timeline and group schematic for both fasted and fed photometry recordings. e, Average fasted photometry traces across recording sessions aligned to Pellet 1 and 2 presentation (n=9, males and females). f, Within-subject quantification of fasted DMHLepR activity response to Pellet 1 (SD) and Pellet 2 (SD at Baseline; HFD during 1, 4 and 5 weeks) (n=9, males and females, RM two-way ANOVA, Time x Pellet: F (3, 48) = 11.07, P<0.0001, Tukey’s multiple comparisons) and g, total calories consumed across testing sessions (n=9, males and females, RM two-way ANOVA, Time x Pellet: F (3, 48) = 66.65, P<0.0001, Tukey’s multiple comparisons). h, Average fed photometry traces across recording sessions aligned to Pellet 1 and 2 presentation (n=9, males and females). i, Within-subject quantification of fed DMHLepR activity response to Pellet 1 (SD) and Pellet 2 (SD at Baseline; HFD during 1, 4 and 5 weeks) (n=9, males and females, RM two-way ANOVA, Time x Pellet: F (3, 48) = 14.44, P<0.0001, Tukey’s multiple comparisons) and j, total calories consumed across testing sessions (n=9, males and females, RM two-way ANOVA, Time x Pellet: F (3, 48) = 81.11, P<0.0001, Tukey’s multiple comparisons). Dotted lines in e,h indicate Pellet 1 and Pellet 2 presentation. Shaded blue area in f-g, and i-j represent HFD homecage availability. B refers to Baseline. WD=withdrawal. All error bars and shaded regions of e-h represent s.e.m. *P < 0.05, **P < 0.01, ***P < 0.001, ****P < 0.0001.
Figure 4:
Figure 4:. HFD-exposure disrupts ARCAgRP responses to both peripheral detection of calories and signals of hunger.
a, Experimental timeline and group schematic for fasted photometry recordings during gastric infusions. b-c, Average fasted ARCAgRP photometry traces in response to gastric infusion of b, saline or c, Ensure (n=6, males and females). d, Within-subject quantification of fasted ARCAgRP activity response to gastric infusions of saline or Ensure across testing sessions (n=6, males and females, RM two-way ANOVA, Time x Infusion: F (3, 15) = 7.236, P=0.0032, Tukey’s multiple comparisons). e, Experimental timeline and group schematic for fed photometry recordings during ghrelin injection. f-g, Average photometry traces of the f, SD group and g, SD + HFD group across recording sessions aligned to ghrelin injection (n=12 SD group, n=11 SD + HFD group, males and females). h, Within-subject quantification of ARCAgRP activity to ghrelin across testing sessions (n=12 SD group, n=11 SD + HFD group, males and females, RM two-way ANOVA, Time x Group: F (5, 105) = 3.244, P=0.0092, Tukey’s multiple comparisons). i, Experimental timeline and group schematic for fasted photometry recordings during CCK, 5HT or PYY injection. j,l,n, Average photometry traces of the SD + HFD group across recording sessions aligned to j, CCK, l, 5HT or n, PYY injection (n=6 SD + HFD group, males and females). k,m,o, Within-subject quantification of ARCAgRP activity to k, CCK (n=6 SD + HFD group, males and females, RM two-way ANOVA, Time bin x Week: F (1.681, 8.404) = 3.230, P=0.0961), m, 5HT (n=6 SD + HFD group, males and females, RM two-way ANOVA, Time bin x Week: F (1.656, 8.279) = 2.904, P=0.1158) or o, PYY (n=6 SD + HFD group, males and females, RM two-way ANOVA, Time bin x Week: F (2.081, 10.40) = 2.203, P=0.1583) across testing sessions. Dotted lines indicate b-c, infusion, f-g, ghrelin, j, CCK, l, 5HT or n, PYY injection. Shaded blue area in d,h,k,m and o represent HFD homecage availability. B1 and B2 refer to Baseline 1 and 2, respectively. WD=withdrawal. All error bars and shaded regions of b-c, f-g, j, l, and n represent s.e.m. *P < 0.05, **P < 0.01, ***P < 0.001, ****P < 0.0001.
Figure 5:
Figure 5:. HFD-exposure disrupts functional capacity of ARCAgRP neurons to drive SD, but not HFD, consumption.
a, Left, Brain schematic of unilateral viral delivery of Cre-inducible ChR2-tdTomato to the ARC of AgRP-ires-Cre mice and optical fiber implant. Right, representative image of ChR2-tdTomato expression. b, Light-evoked action potentials in AgRP::ChR2 mice in SD (top) and SD + HFD (bottom) groups. c, Experimental timeline and group schematic for optogenetic studies with 1 hr SD access. d, Within-subject comparison of fedAgRP stimulation 1 hr SD consumption across testing sessions (n=16 SD group, n=17 SD + HFD group, males and females, RM two-way ANOVA, Time x Group: F (4, 124) = 18.85, P<0.0001, Tukey’s multiple comparisons). e, Experimental timeline and group schematic for optogenetic studies with 1 hr SD and HFD access. f, Within-subject comparison of FedAgRP stimulation 1 hr SD and HFD consumption across testing sessions (n=17, males and females, RM two-way ANOVA, Time x Diet: F (3, 96) = 26.03, P<0.0001, Bonferroni’s multiple comparisons). Shaded blue area in d and f represent HFD homecage availability. B=Baseline. WD=Withdrawal. All error bars represent s.e.m. *P < 0.05, **P < 0.01, ***P < 0.001, ****P < 0.0001.
Figure 6:
Figure 6:. HFD alters ARCNpy-mediated VTADat responses to SD.
a, Left, Brain schematic of unilateral viral delivery of Flp-inducible hM3Dq and Cre-inducible GCaMP6s to the ARC and VTA, respectively, of Npy-ires2-FlpO; Dat-ires-Cre mice and optical fiber implant. Right, representative image of Npy::hM3dq (top) and Dat::GCaMP6s (bottom) expression. b, Experimental timeline and group schematic for fed photometry recordings. c,f Averaged Z-score traces of VTADat activity aligned to c, SD or f, HFD pellet consumption across recording weeks. d-e, g-h Within-subject comparisons of d,g mean and e,h maximum fluorescence Z-score during d,e, SD (n=6, males and females, RM one-way ANOVA, Time: F (3, 15) = 3.538, P=0.0407, Time: F (3, 15) = 2.802, P=0.0757, Tukey’s multiple comparisons) or g,h, HFD pellet consumption across sessions (n=6, males and females, RM one-way ANOVA, Time: F (2, 10) = 4.073, P=0.0508, Time: F (2, 10) = 2.454, P=0.1358, Tukey’s multiple comparisons). i, Comparison of averaged Z-score traces of VTADat activity aligned to SD or HFD pellet consumption at 4 weeks. j-k, Within-subject comparisons of j, mean (n=6, males and females, Paired t test (two-tailed), P=0.0616) and k, maximum fluorescence Z-score comparing SD and HFD pellet consumption at 4 weeks (n=6, males and females, Paired t test (two-tailed), P=0.042). B=Baseline. WD=Withdrawal. Shaded peach region in c,f and i represent quantified pellet retrieval period. Shaded blue area in d,e,g,h,j and k represent HFD homecage availability. Time 0 denotes consumption. All error bars and shaded regions of c,f and i represent s.e.m. *P < 0.05.
Figure 7:
Figure 7:. HFD-exposure disrupts functional capacity of VTADat neurons to potentiate SD consumption.
a, Left, Brain schematic of unilateral viral delivery of Cre-inducible ChR2-eYFP to the VTA of Dat-ires-Cre mice and optical fiber implant. Right, representative image of ChR2-eYFP expression. b, Experimental timeline and group schematic for closed loop optogenetic studies with or without light stimulation. c, Within-subject comparison of 1 hr SD consumption across testing sessions with or without VTADat photostimulation (n=9, males, RM two-way ANOVA, Time x Condition: F (3, 48) = 18.30, P<0.0001, Bonferroni’s multiple comparisons test). B=Baseline. WD=Withdrawal. Shaded blue area in c represents HFD homecage availability. All error bars represent s.e.m. *P < 0.05, ****P < 0.0001.
Figure 8:
Figure 8:. HFD-exposure dampens nucleus accumbens shell DA release in response to SD
a, Left, Brain schematic of unilateral viral delivery of the DA sensor GRAB-DA2m and tdTomato to the AcbSh and optical fiber implant. Right, representative image of Right, representative image of GRAB-DA2m and tdTomato expression in the AcbSh. b, Experimental timeline and group schematic for photometry recordings. c,f Averaged Z-score traces of DA2m fluorescence aligned to c, SD or f, HFD pellet retrieval across recording weeks. d-e, g-h Within-subject comparisons of d,g mean and e,h maximum fluorescence Z-score during d,e, SD (n=7–8, males and females, Mixed-effects model (REML), Time: F (1.555, 9.847) = 11.91, P=0.0034, Time: F (1.599, 10.12) = 6.608, P=0.0182, Tukey’s multiple comparison) or g,h, HFD pellet consumption across sessions (n=7–8, males and females, Mixed-effects model (REML), Time: F (1.950, 11.70) = 0.2897, P=0.7484, Time: F (1.832, 10.99) = 0.8452, P=0.4461). i, Comparison of averaged Z-score traces of DA2m fluorescence aligned to SD or HFD pellet consumption at 1 week. j-k, Within-subject comparisons of j, mean (n=8, males and females, Paired t test (two-tailed), P=0.021) and k, maximum fluorescence Z-score comparing SD and HFD pellet consumption at 1 week (n=8, males and females, Paired t test (two-tailed), P=0.0578). Shaded peach/blue region in c,f and i represent quantified pellet approach/retrieval period. Shaded blue area in d,e,g,h,j and k represent HFD homecage availability. B=Baseline. WD=Withdrawal. Time 0 denotes consumption. All error bars and shaded regions of c,f and i represent s.e.m. *P < 0.05, **P < 0.01.

References

    1. Timper K & Brüning JC Hypothalamic circuits regulating appetite and energy homeostasis: pathways to obesity. Dis. Model. Mech 10, 679–689 (2017). - PMC - PubMed
    1. DiFeliceantonio AG & Small DM Dopamine and diet-induced obesity. Nat. Neurosci 22, 1–2 (2019). - PubMed
    1. Ferrario CR et al. Homeostasis Meets Motivation in the Battle to Control Food Intake. J. Neurosci 36, 11469–11481 (2016). - PMC - PubMed
    1. Luquet S, Perez FA, Hnasko TS & Palmiter RD NPY/AgRP neurons are essential for feeding in adult mice but can be ablated in neonates. Science 310, 683–5 (2005). - PubMed
    1. Aponte Y, Atasoy D & Sternson SM AGRP neurons are sufficient to orchestrate feeding behavior rapidly and without training. Nat. Neurosci 14, 351–355 (2011). - PMC - PubMed

References in Methods

    1. Madisen L et al. A robust and high-throughput Cre reporting and characterization system for the whole mouse brain. Nat. Neurosci 13, 133–40 (2010). - PMC - PubMed
    1. Meng C et al. Spectrally Resolved Fiber Photometry for Multi-component Analysis of Brain Circuits. Neuron 98, 707–717.e4 (2018). - PMC - PubMed
    1. Nguyen KP, O’Neal TJ, Bolonduro OA, White E & Kravitz AV Feeding Experimentation Device (FED): A flexible open-source device for measuring feeding behavior. J. Neurosci. Methods 267, 108–114 (2016). - PMC - PubMed

Publication types