. 2021 Jan;17(1):20-29.
doi: 10.1038/s41589-020-0604-z. Epub 2020 Aug 3.

Bariatric surgery reveals a gut-restricted TGR5 agonist with anti-diabetic effects

Affiliations

Bariatric surgery reveals a gut-restricted TGR5 agonist with anti-diabetic effects

Snehal N Chaudhari et al. Nat Chem Biol. 2021 Jan.

Abstract

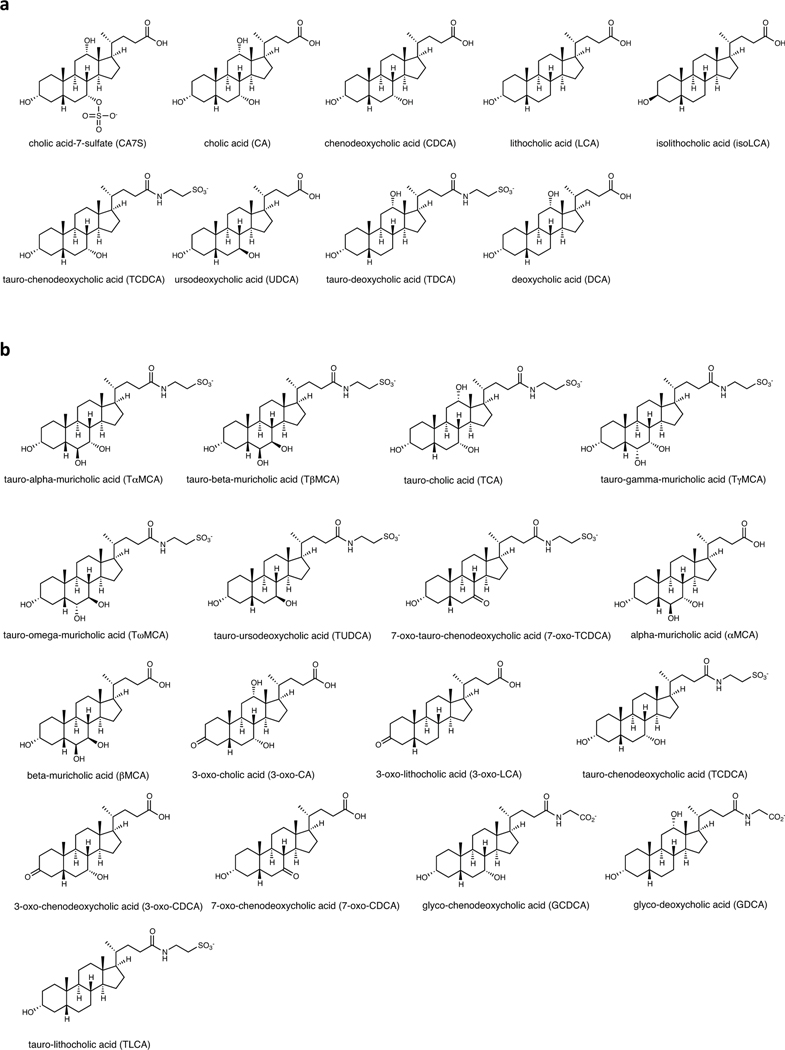
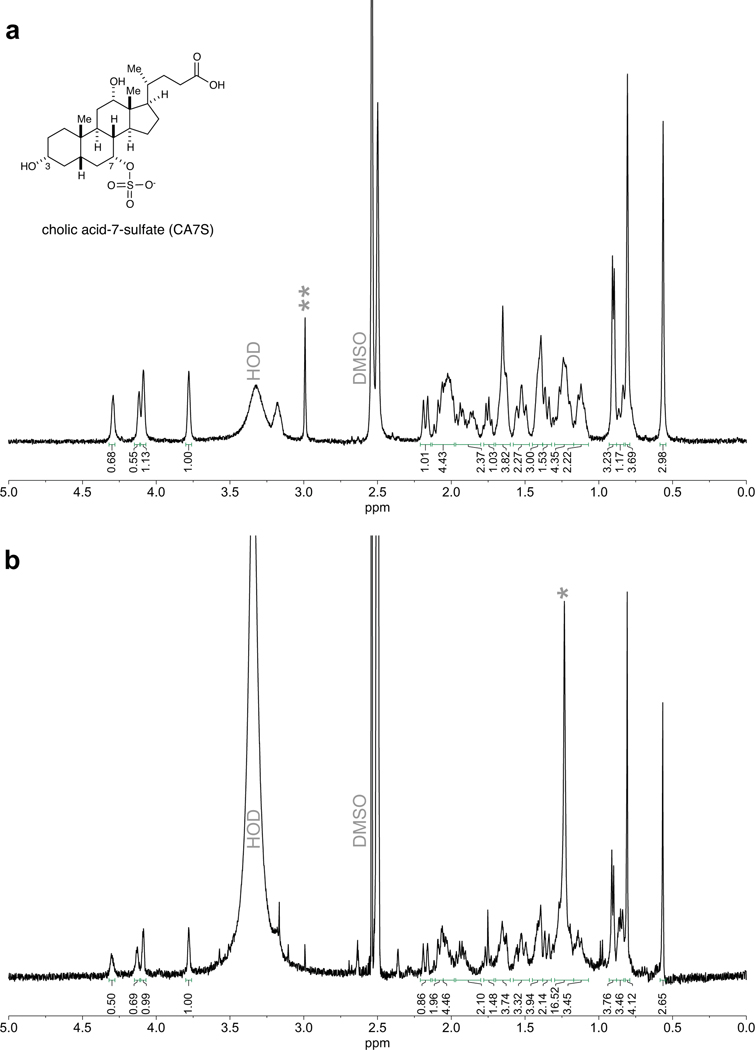
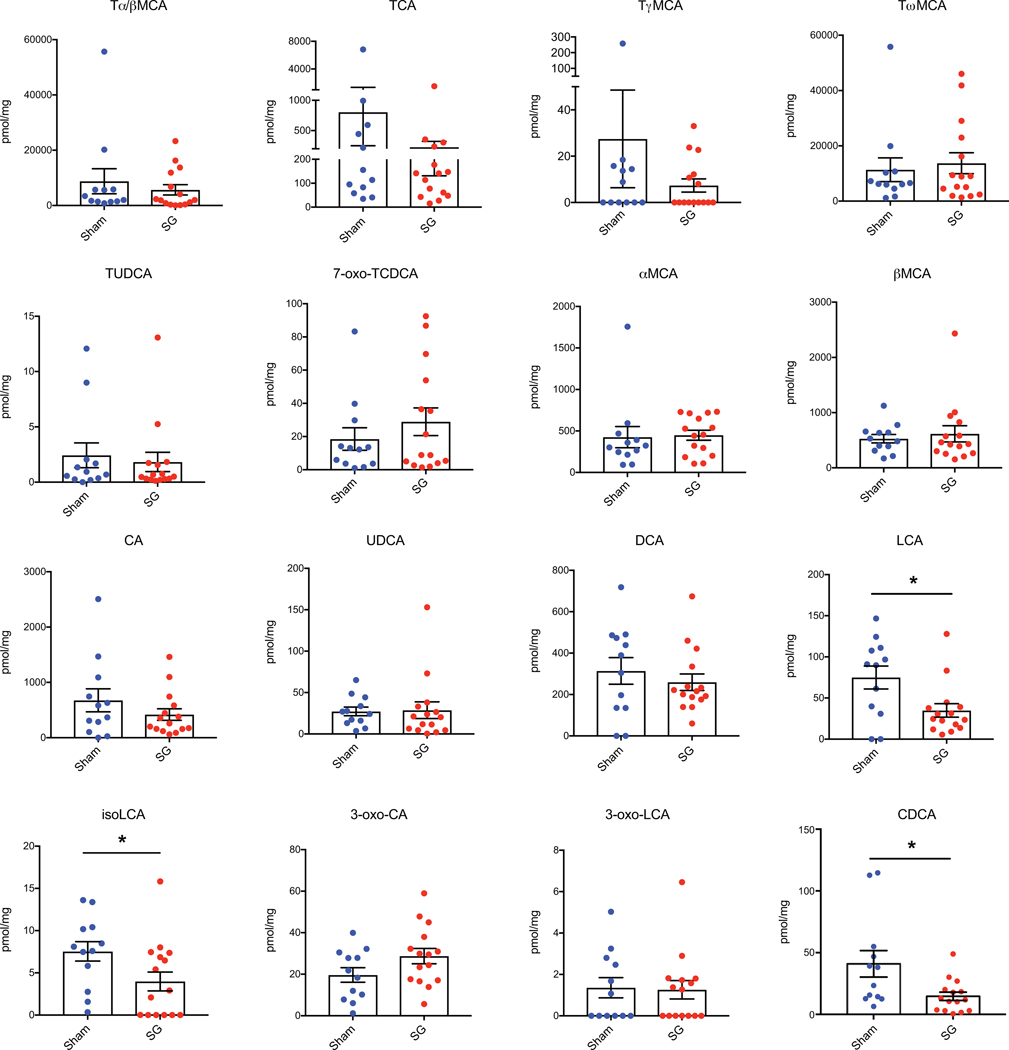
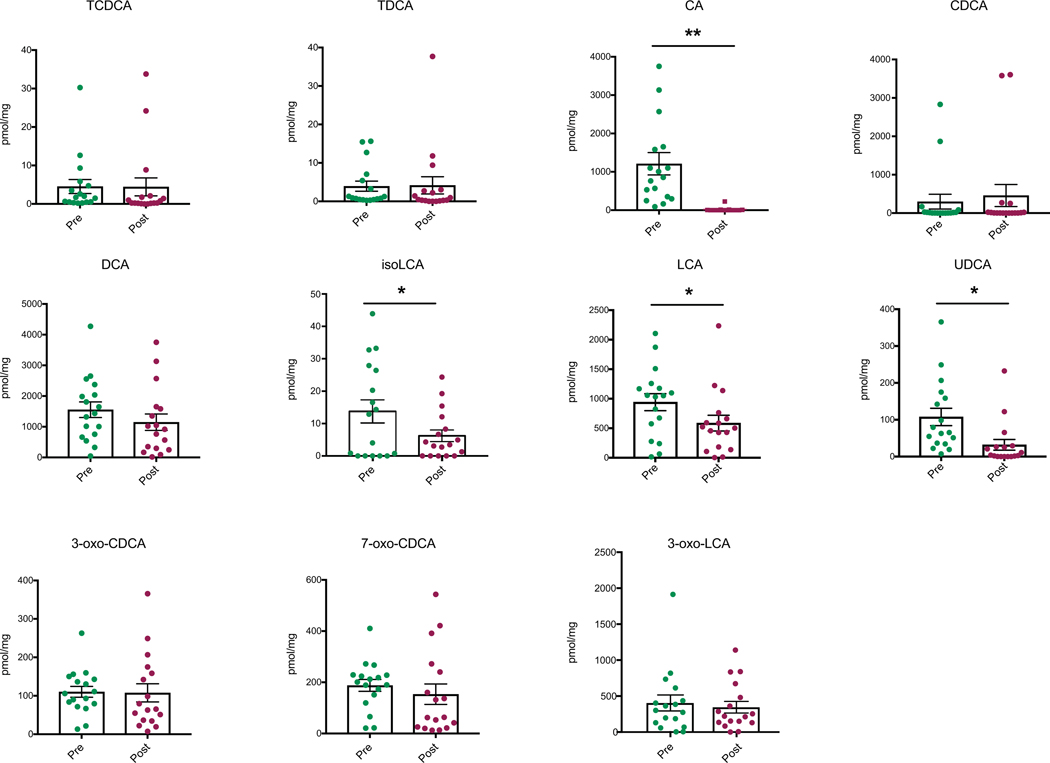
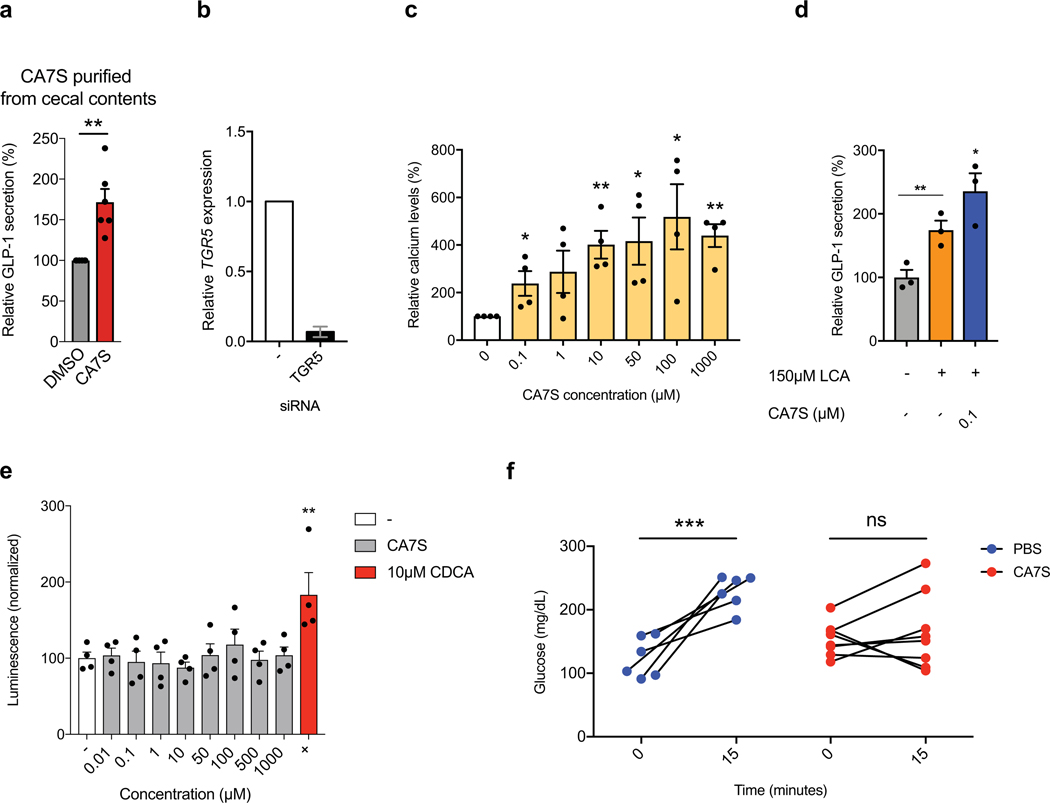
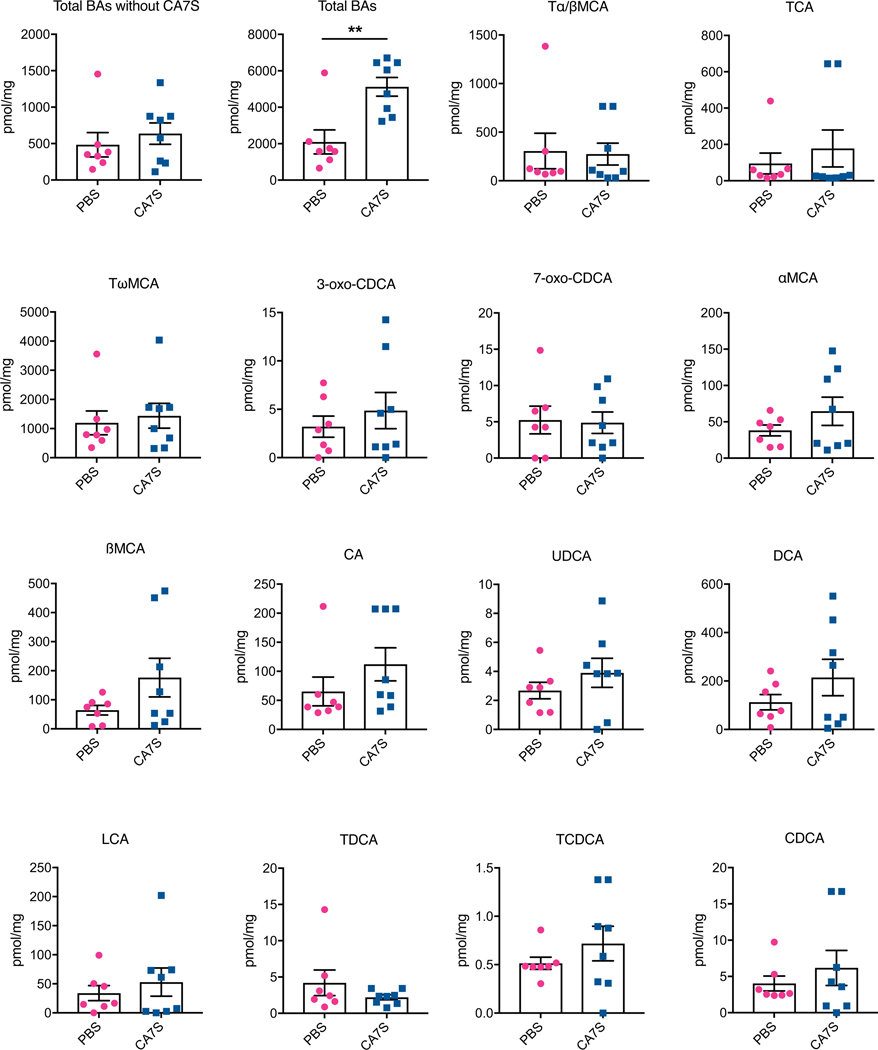
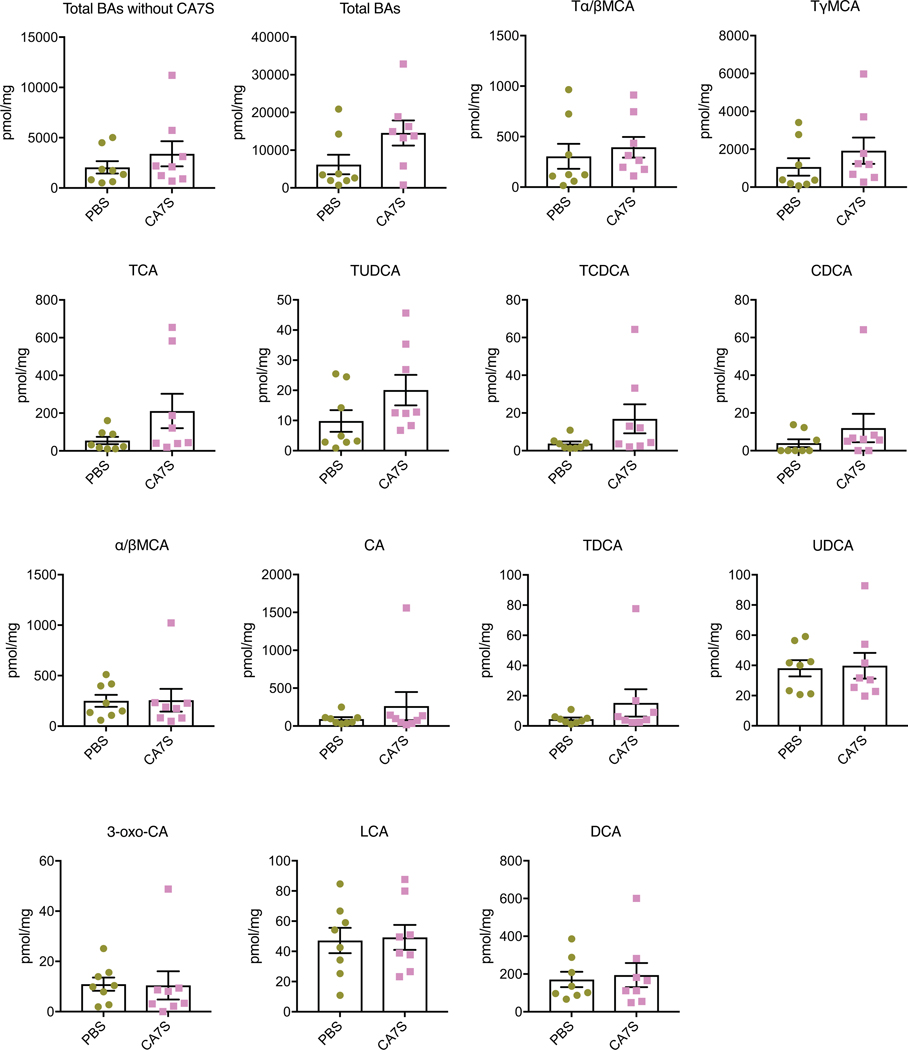
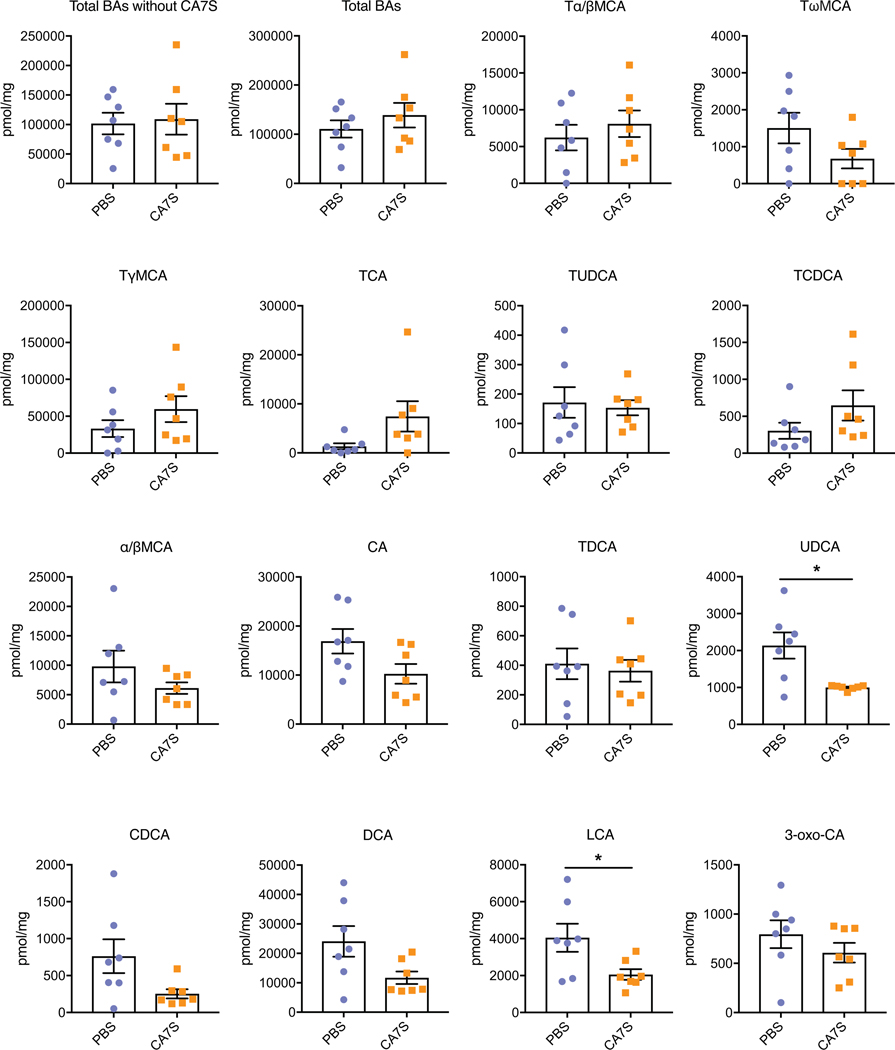
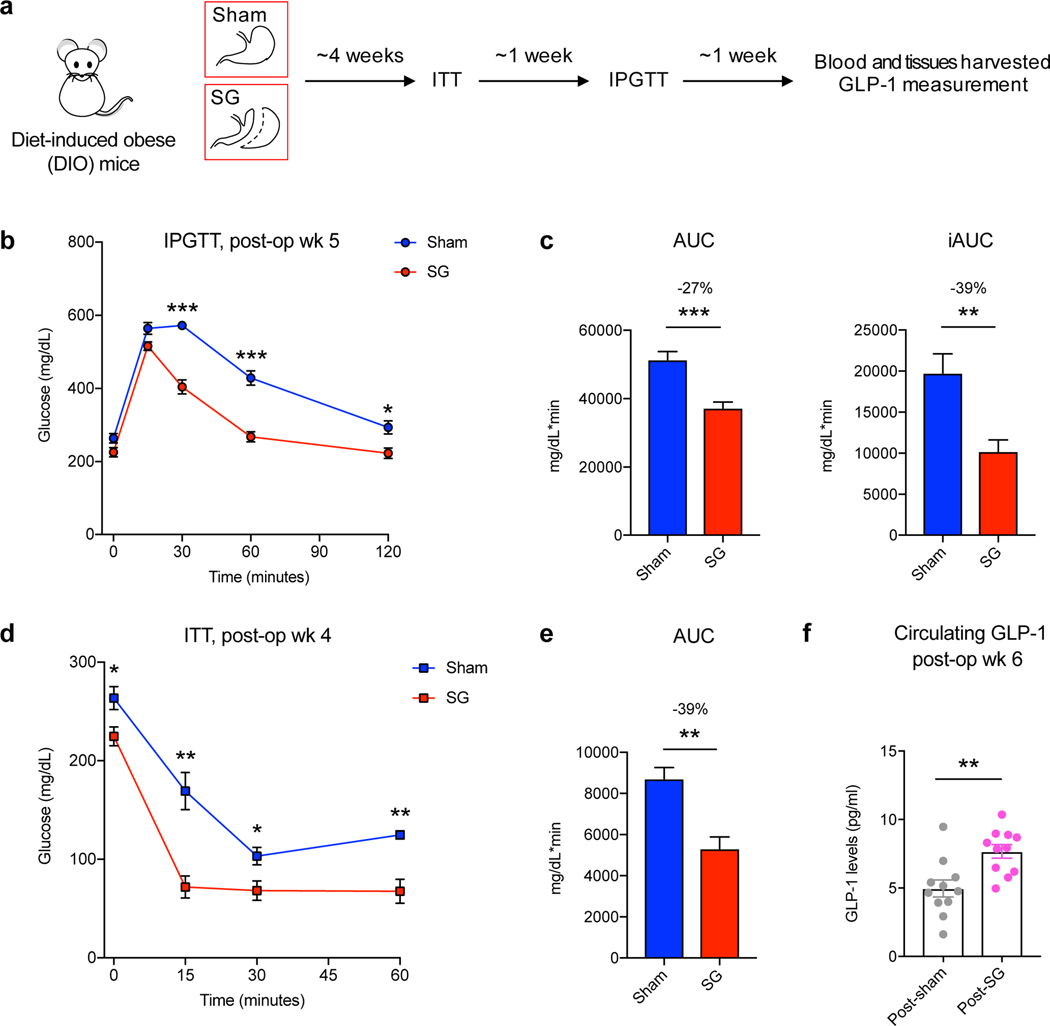
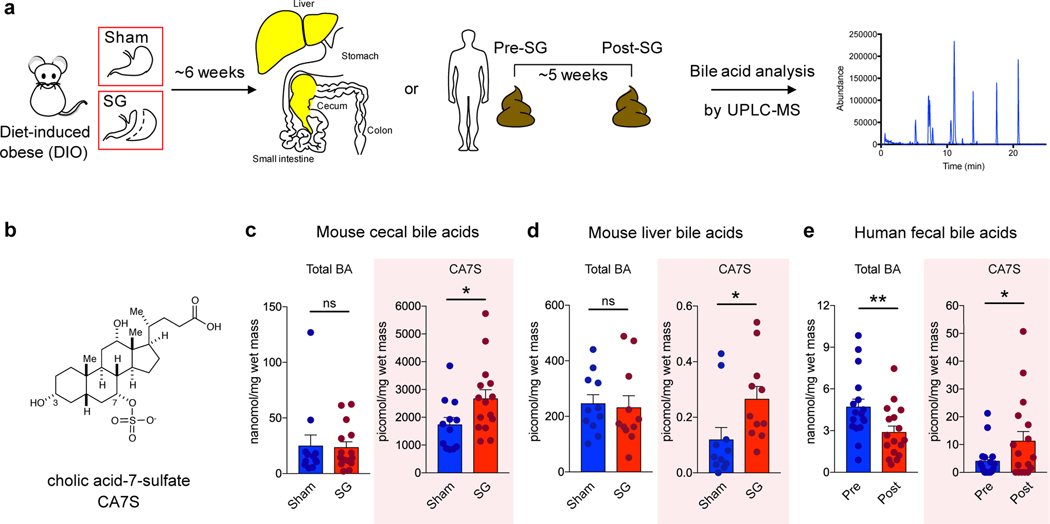
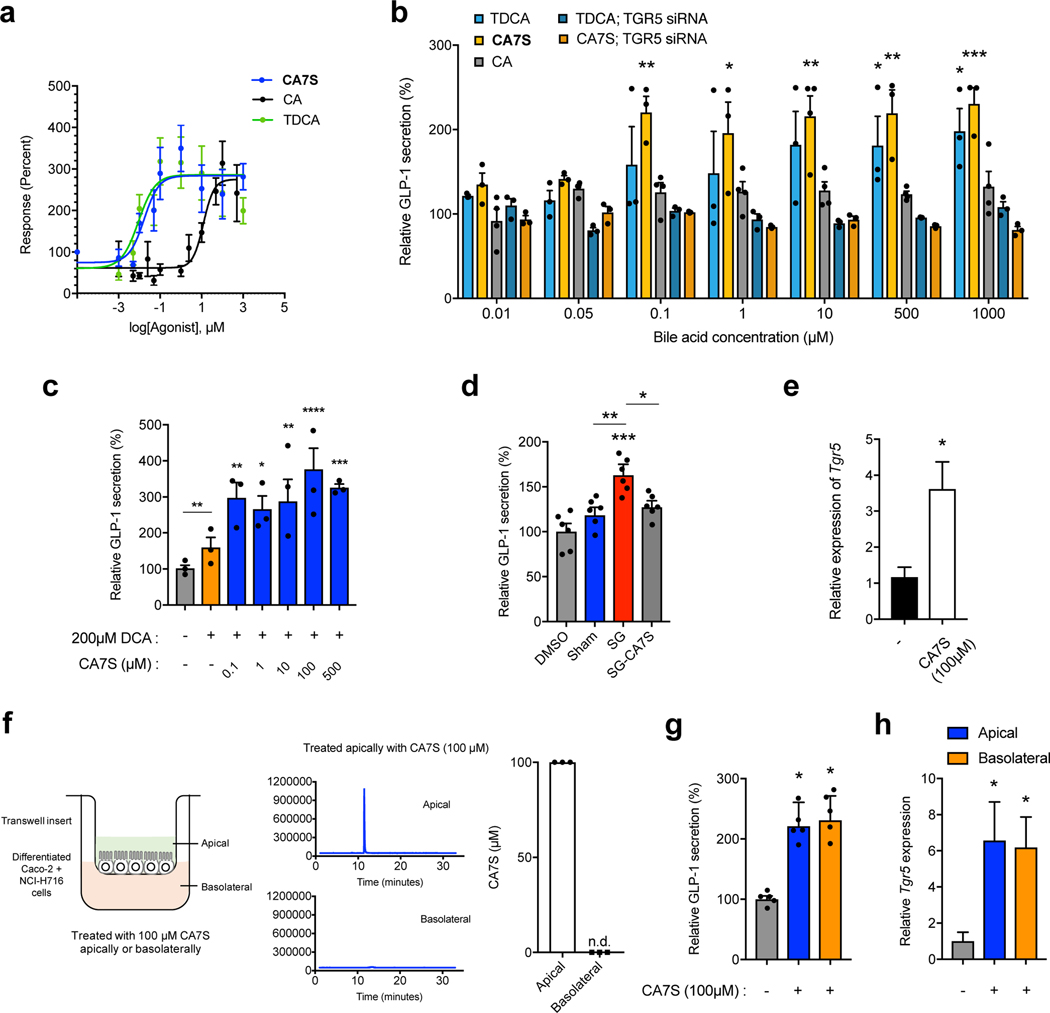
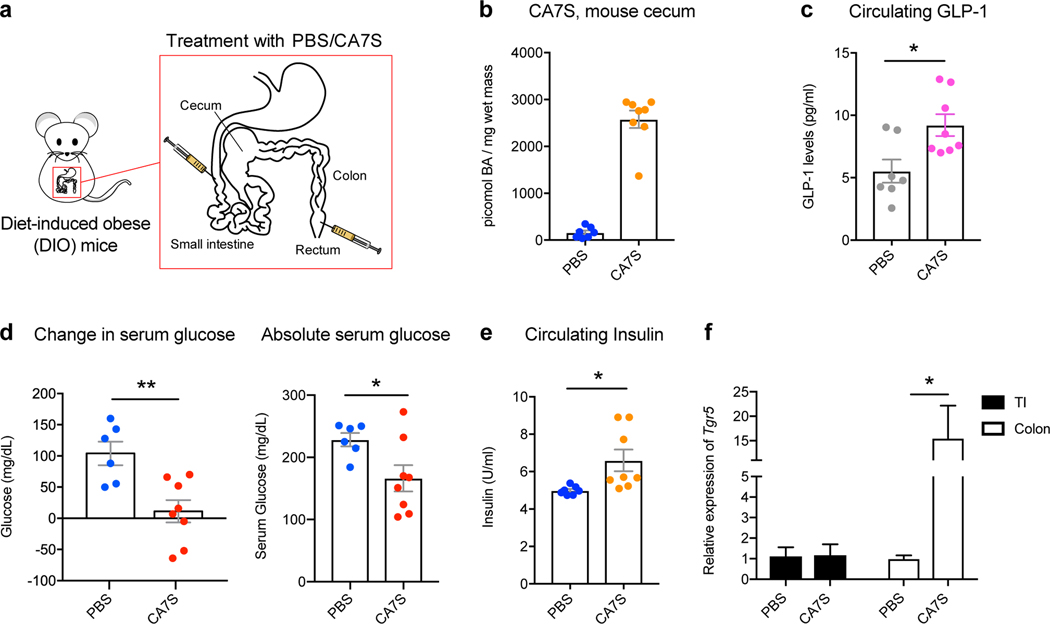
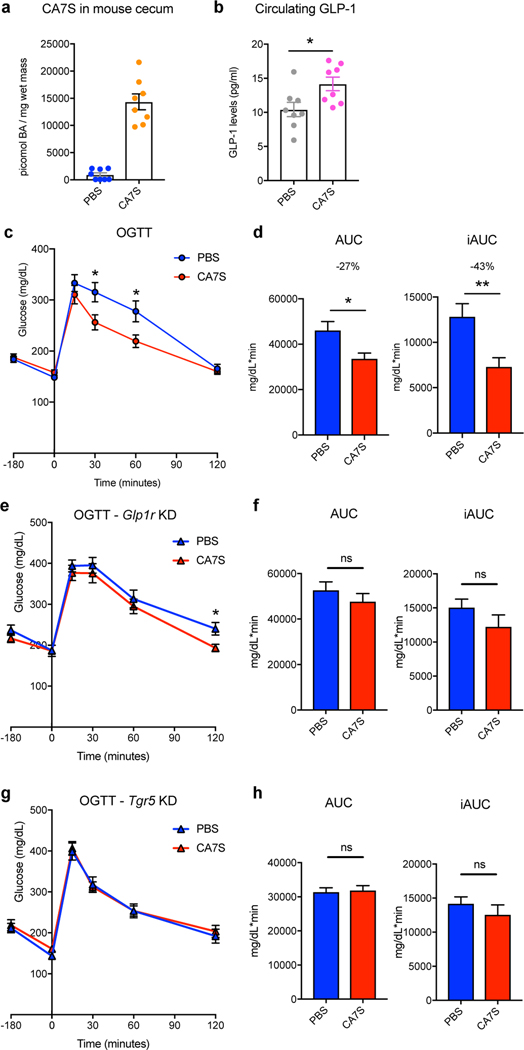
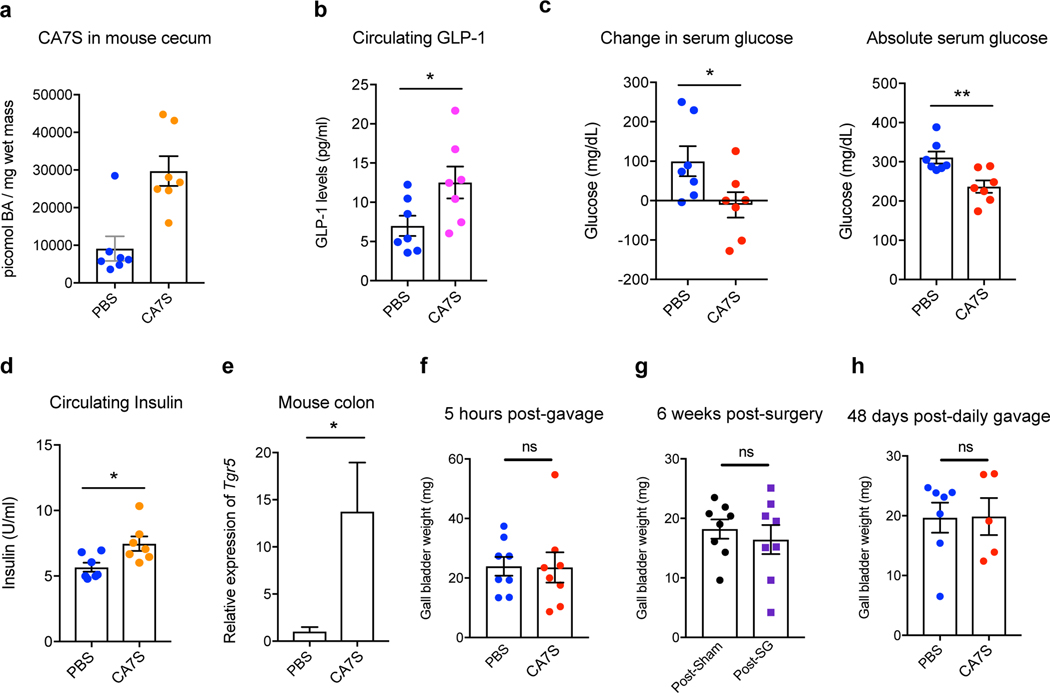
Bariatric surgery, the most effective treatment for obesity and type 2 diabetes, is associated with increased levels of the incretin hormone glucagon-like peptide-1 (GLP-1) and changes in levels of circulating bile acids. The levels of individual bile acids in the gastrointestinal (GI) tract after surgery have, however, remained largely unstudied. Using ultra-high performance liquid chromatography-mass spectrometry-based quantification, we observed an increase in an endogenous bile acid, cholic acid-7-sulfate (CA7S), in the GI tract of both mice and humans after sleeve gastrectomy. We show that CA7S is a Takeda G-protein receptor 5 (TGR5) agonist that increases Tgr5 expression and induces GLP-1 secretion. Furthermore, CA7S administration increases glucose tolerance in insulin-resistant mice in a TGR5-dependent manner. CA7S remains gut restricted, minimizing off-target effects previously observed for TGR5 agonists absorbed into the circulation. By studying changes in individual metabolites after surgery, the present study has revealed a naturally occurring TGR5 agonist that exerts systemic glucoregulatory effects while remaining confined to the gut.


Conflict of interest statement

Competing interests

CA7S is a subject of patents held by HMS and BWH on which S.N.C., D.A.H., E.G.S., and A.S.D. are inventors. A.S.D. is a consultant for Kintai Therapeutics and HP Hood. E.G.S. was previously on the scientific advisory board of Kitotech, Inc.

Figures

Extended Data Fig. 1
Extended Data Fig. 1. Bile acid structures
a, Structures of bile acids in main text and figures. b, Structures of additional bile acids in Extended Data and Supplementary Information.
Extended Data Fig. 2
Extended Data Fig. 2. NMR of cholic acid-7-sulfate
a, 1H NMR of authentic sample of cholic acid-7-sulfate (CA7S) (Cayman Chemical). b, 1H NMR of CA7S purified from the cecal contents of SG mice. Signals between 3.7 to 4.4 ppm are diagnostic of CA7S. Impurities are denoted by asterisks.
Extended Data Fig. 3
Extended Data Fig. 3. Bile acid concentrations in cecal contents of mice post-sham or post-SG
Six weeks following surgery, cecal contents were collected from sham or SG mice after an overnight fast. Bile acids were quantified using UPLC-MS (sham, n=12, SG, n=15, data not marked with asterisk(s) are not significant). All bile acids with measurable concentrations above the limit of detection are shown. Tα/βMCA, tauro-alpha- and tauro-beta-muricholic acid, p=0.53; TCA, tauro-cholic acid, p=0.32; TγMCA, tauro-gamma-muricholic acid, p=0.36; TωMCA, tauro-omega-muricholic acid, p=0.68; TUDCA, tauro-ursodeoxycholic acid, p=0.67; 7-oxo-TCDCA, 7-oxo-tauro-chenodeoxycholic acid p=0.34; αMCA, alpha-muricholic acid, p=0.87; βMCA, beta-muricholic acid, p=0.59; CA, cholic acid, p=0.28; UDCA, ursodeoxycholic acid, p=0.85; DCA, deoxycholic acid, p=0.48; LCA, lithocholic acid, *p=0.02; isoLCA, isolithocholic acid *p=0.02; 3-oxo-CA, 3-oxo-cholic acid, p=0.08; 3-oxo-LCA, 3-oxo-lithocholic acid, p=0.79; CDCA, chenodeoxycholic acid, *p=0.03, two-tailed Welch’s t-test. All data are presented as mean ± SEM.
Extended Data Fig. 4
Extended Data Fig. 4. Bile acid concentrations in feces of human patients pre-SG or post-SG
Feces were collected from patients pre-op or ~5 weeks post-op and bile acids were quantified using UPLC-MS (n=17 patients, median 36 days after surgery, data not marked with asterisk(s) are not significant). All bile acids with measurable concentrations above the limit of detection are shown. TCDCA, tauro-chenodeoxycholic acid, p=0.97; TDCA, tauro-deoxycholic acid, p=0.93; CA, cholic acid, **p=1.00×10⁻³; CDCA, chenodeoxycholic acid, p=0.52; DCA, deoxycholic acid, p=0.13; LCA, lithocholic acid, *p=0.01; isoLCA, iso-lithocholic acid, *p=0.03; UDCA, ursodeoxycholic acid, *p=0.02; 3-oxo-CDCA, 3-oxo-chenodeoxycholic acid, p=0.92; 7-oxo-CDCA, 7-oxo-chenodeoxycholic acid, p=0.47, 3-oxo-LCA, 3-oxo-lithocholic acid, p=0.56, two-tailed paired t-test. All data are presented as mean ± SEM.
Extended Data Fig. 5
Extended Data Fig. 5. CA7S agonizes TGR5 but not FXR, induces GLP-1 secretion, and reduces systemic glucose levels
a, CA7S (500 μM) purified from SG mouse cecal contents induced secretion of GLP-1 in NCI-H716 cells compared to DMSO control (6 biological replicates per condition, **p=1.00×10⁻³, two-tailed Welch’s t-test). b, Quantitative real time PCR analysis of expression of human TGR5 in TGR5 siRNA and negative (−) siRNA-treated NCI-H716 cells for Fig. 3b. c, CA7S induced an increase in intracellular calcium levels in NCI-H716 cells (4 biological replicates per condition, CA7S 10 μM *p=0.03, 50 μM *p=0.02, 100 μM **p=1.80×10⁻³, 100 μM *p=0.01, one-way ANOVA followed by Dunnett’s multiple comparisons test). d, CA7S induced secretion of GLP-1 in the presence of a physiologically relevant concentration of LCA (150 μM) (3 biological replicates per condition, DMSO (−) control vs. LCA **p=9.90×10⁻³, CA7S vs. LCA 0.1 μM *p=0.03, two-way ANOVA followed by Dunnett’s multiple comparisons test). e, CA7S did not induce activation of endogenous FXR in Caco-2 cells compared to (−) DMSO control. Known FXR agonist CDCA (10 μM) was used as a positive control (4 biological replicates per condition, CA7S 0.01–50 μM and 500–1000 μM not significant p=0.99, CA7S 100 μM not significant p=0.96, CDCA 10 μM **p=4.60×10⁻³, one-way ANOVA followed by Dunnett’s multiple comparisons test). f, In vivo change in serum glucose upon acute enteral treatment with PBS and CA7S (PBS, n=6; CA7S, n=8 mice, ***p=1.00×10⁻⁴, ns=not significant p=0.63, two-tailed paired t-test). All data are presented as mean ± SEM.
Extended Data Fig. 6
Extended Data Fig. 6. Bile acid concentrations in cecal contents of mice treated enterally with CA7S
Cecal contents were collected from mice after enteral treatment with CA7S or PBS and bile acids were quantified using UPLC-MS (PBS, n=7, CA7S, n=8, data not marked with asterisk(s) are not significant). All bile acids with measurable concentrations above the limit of detection are shown. Total BAs without CA7S, p=0.50; Total bile acids (BAs), **p=3.5×10⁻³; Tα/βMCA, tauro-alpha- and tauro-beta-muricholic acid, p=0.88; TCA, tauro-cholic acid, p=0.49; TωMCA, tauro-omega-muricholic acid, p=0.68; 3-oxo-CDCA, 3-oxo-chenodeoxycholic acid p=0.45; 7-oxo-CDCA, 7-oxo-chenodeoxycholic acid p=0.87; αMCA, alpha-muricholic acid, p=0.23; βMCA, beta-muricholic acid, p=0.14; CA, cholic acid, p=0.23; UDCA, ursodeoxycholic acid, p=0.30; DCA, deoxycholic acid, p=0.24; LCA, lithocholic acid, p=0.50; TDCA, tauro-deoxycholic acid, p=0.30; TCDCA, tauro-chenodeoxycholic acid, p=0.31; CDCA, chenodeoxycholic acid, p=0.43, two-tailed Welch’s t-test. All data are presented as mean ± SEM.
Extended Data Fig. 7
Extended Data Fig. 7. Bile acid concentrations in cecal contents of mice gavaged with one dose of CA7S
Fasted DIO mice were gavaged with CA7S or PBS and cecal contents were collected from mice 5 hours post-gavage. Bile acids were quantified using UPLC-MS (n=8 in each group, data not marked with asterisk(s) are not significant). All bile acids with measurable concentrations above the limit of detection are shown. Total BAs without CA7S, p=0.35; Total bile acids (BAs), p=0.06; Tα/βMCA, tauro-alpha- and tauro-beta-muricholic acid, p=0.58; TγMCA, tauro-gamma-muricholic acid, p=0.32; TCA, tauro-cholic acid, p=0.13; TUDCA, tauro-ursodeoxycholic acid, p=0.12; TCDCA, tauro-chenodeoxycholic acid, p=0.13; CDCA, chenodeoxycholic acid, p=0.33; αβMCA, alpha-muricholic acid and beta-muricholic acid, p=0.96; CA, cholic acid, p=0.38; TDCA, tauro-deoxycholic acid, p=0.27; UDCA, ursodeoxycholic acid, p=0.87; 3-oxo-CA, 3-oxo-cholic acid, p=0.93; LCA, lithocholic acid, p=0.86; DCA, deoxycholic acid, p=0.76, two-tailed Welch’s t-test. All data are presented as mean ± SEM.
Extended Data Fig. 8
Extended Data Fig. 8. Bile acid concentrations in cecal contents of mice gavaged chronically with CA7S
Cecal contents were collected from mice following an overnight fast after 48 days of daily gavage with CA7S or PBS. Bile acids were quantified using UPLC-MS (n=7 in each group, data not marked with asterisk(s) are not significant). All bile acids with measurable concentrations above the limit of detection are shown. Total BAs without CA7S, p=0.82; Total bile acids (BAs), p=0.38; Tα/βMCA, tauro-alpha- and tauro-beta-muricholic acid, p=0.46; TωMCA, tauro-omega-muricholic acid, p=0.12; TγMCA, tauro-gamma-muricholic acid, p=0.23; TCA, tauro-cholic acid, p=0.09; TUDCA, tauro-ursodeoxycholic acid, p=0.76; TCDCA, tauro-chenodeoxycholic acid, p=0.17; αβMCA, alpha-muricholic acid and beta-muricholic acid, p=0.23; CA, cholic acid, p=0.06; TDCA, tauro-deoxycholic acid, p=0.71; UDCA, ursodeoxycholic acid, *p=0.01; CDCA, chenodeoxycholic acid, p=0.06; DCA, deoxycholic acid, p=0.23; LCA, lithocholic acid, *p=0.04; 3-oxo-CA, 3-oxo-cholic acid, p=0.30, two-tailed Welch’s t-test. All data are presented as mean ± SEM.
Figure 1.
Figure 1.. DIO mice display improved glucose tolerance and insulin sensitivity following SG
a, Schematic of surgical interventions and post-operative assessments. Sleeve gastrectomy (SG) or sham surgery was performed on diet-induced obese (DIO) mice, followed by an insulin tolerance test (ITT) ~4 weeks post-op and then intraperitoneal glucose tolerance test (IPGTT) ~5 weeks post-op. Blood and tissues were harvested ~6 weeks post-op in the fasted state. b, Glycemic curves during IPGTT (SG, n=7; sham, n=6, 30 min ***p=5.91×10⁻⁶, 60 min ***p=4.34×10⁻⁵, 120 min *p=0.01, two-tailed Student’s t-test). c, Corresponding area under the blood glucose curve (AUC) and incremental area under the curve (iAUC) were reduced in SG- compared to sham-operated mice. (SG, n=7; sham, n=6, AUC ***p= 4.01×10⁻⁴, iAUC **p=6.12×10⁻³, two-tailed Welch’s t-test). d, Glycemic curves during ITT (SG, n=4; sham, n=4, 0 min *p=0.04, 15 min **p=4.31×10⁻³, 30 min *p=0.03, 60 min **p=4.53×10⁻³, two-tailed Student’s t-test). e, Corresponding area under the blood glucose curve (AUC) was reduced in SG-compared to sham-operated mice (SG, n=4; sham, n=4, AUC **p= 5.25×10⁻³, two-tailed Welch’s t-test). f, GLP-1 levels were increased in mice post-SG compared to post-sham (n=11 per group, **p=3.00×10⁻³, two-tailed Welch’s t-test). All data are presented as mean ± SEM.
Figure 2.
Figure 2.. The BA metabolite cholic acid-7-sulfate (CA7S), is increased in mice and humans following SG
a, Schematic of sample collection followed by BA profiling using UPLC-MS. For mice, livers and cecal contents were collected from fasted sham or SG mice 6 weeks post-op. For humans, a pre-operative stool sample was compared with a post-operative sample collected a median of 36 days after surgery. b, Structure of CA7S (1). c, CA7S was increased in cecal contents of SG mice, while total BA (BA) concentrations did not differ between SG and sham mice (sham, n=12, SG, n=15, total BAs (BA) not significant (ns) p=0.90, CA7S *p=0.03, two-tailed Welch’s t-test). Note that 1 picomol BA/mg wet mass is approximately equivalent to 1 μM. d, CA7S was increased in livers of SG mice (SG, n=11; sham, n=11, total BAs (BA) not significant (ns) p=0.55, CA7S *p=0.03, two-tailed Welch’s t-test). e, CA7S in human feces was increased post-SG compared to pre-surgery (n=17 patients, total BAs (BA) **p=1.00×10⁻³, CA7S *p=0.01, two-tailed paired t-test).
Figure 3.
Figure 3.. CA7S activates TGR5 signaling and increases TGR5 expression
a, Dose response curves for human TGR5 activation in HEK293T cells overexpressing human TGR5 for CA7S, TDCA, CA (3 biological replicates for CA and TDCA, 6 biological replicates for CA7S, see Supplementary Table 1 for EC50 values). b, CA7S-induced secretion of GLP-1 in NCI-H716 cells compared to both CA and the known TGR5 agonist, TDCA. siRNA-mediated knockdown of TGR5 abolished GLP-1 secretion (3 biological replicates for all except 4 biological replicates for CA, data not marked with asterisk(s) are not significant. CA7S 0.1 μM **8.00×10⁻³, 1 μM *p=0.03, 10 μM **p=2.03×10⁻³, 500 μM **p=3.00×10⁻³, 1000 μM ***p=7.00×10⁻⁴, TDCA 500 μM *p=0.04, 1000 μM *p=0.02, one-way ANOVA followed by Dunnett’s multiple comparisons test). For qRT-PCR expression analysis of TGR5 knockdown, see Extended Data Fig. 5b. c, CA7S induced secretion of GLP-1 in the presence of a physiologically relevant concentration of DCA (200 μM) (3 biological replicates per condition, DMSO (−) control vs. DCA not significant p=0.28, 0.1 μM CA7S vs. DCA **p=4.90×10⁻³, 1 μM *p=0.03, 10 μM **p=5.30×10⁻³, 100 μM ****p=1.00×10⁻⁴, 500 μM ***p=7.00×10⁻⁴, two-way ANOVA followed by Dunnett’s multiple comparisons test). d, In vitro pools of BAs mimicking the mean physiological concentrations of SG cecal BAs induced GLP-1 secretion in NCI-H716 cells compared to pools of mean sham cecal BAs. Induction of GLP-1 secretion by the SG cecal BA pool was lost when CA7S was removed from the pool (SG-CA7S) (6 biological replicates per condition, data not marked with asterisk(s) are not significant. DMSO vs. Sham not significant p=0.52, DMSO vs. SG ***p=7.00×10⁻⁴, DMSO vs. SG-CA7S not significant p=0.24, Sham vs. SG **p=4.00×10⁻³, SG vs. SG-CA7S *p=0.03, one-way ANOVA followed by Dunnett’s multiple comparisons test). e, Quantitative real time PCR analysis of TGR5 expression in NCI-H716 cells treated with CA7S (4 biological replicates per condition, *p=0.01, two-tailed Welch’s t-test. f, Schematic of differentiated Caco-2 and NCI-H716 cells grown in transwells and treated with CA7S. Apical treatment of epithelial monolayer with 100 μM CA7S led to undetectable amounts of CA7S in the basolateral chamber as measured by UPLC-MS analysis (3 biological replicates, representative UPLC-MS traces shown). g,h, CA7S (100 μM) induced GLP-1 secretion (g) and TGR5 expression (h) when administered apically or basolaterally to a mixed monolayer of Caco-2 and NCI-H716 cells in a transwell system compared to control (5 biological replicates per condition, (g) apical CA7S *p=0.02, basolateral CA7S *p=0.01, (h) apical CA7S *p=0.03, basolateral CA7S *p=0.02, one-way ANOVA followed by Dunnett’s multiple comparisons test). All data are presented as mean ± SEM.
Figure 4.
Figure 4.. Acute CA7S administration induces GLP-1 and reduces serum glucose levels in vivo
a, Schematic of acute treatment wherein fasted DIO mice were anesthetized and treated with PBS or CA7S via duodenal and rectal catheters. b, Concentration of CA7S in mouse cecum 15 minutes after treatment with PBS or CA7S (PBS, n=7; CA7S, n=8 mice). c-e, CA7S-treated mice displayed increased GLP-1 (c), reduced blood glucose levels (d), and increased blood insulin levels (e) compared to PBS-treated mice. (For c and e, PBS, n=7; CA7S, n=8 mice, (c) *p=0.01, (e) *p=0.02, two-tailed Welch’s t-test. For d, PBS, n=6; CA7S, n=8 mice, **p=4.20×10⁻³, *p=0.02, two-tailed Welch’s t-test). f, CA7S treatment in the intestine induced Tgr5 expression in the colon but not in the terminal ileum (TI) (PBS, n=7; CA7S, n=8 mice, *p=0.03, two-tailed Welch’s t-test). All data are presented as mean ± SEM.
Figure 5.
Figure 5.. CA7S gavage induces GLP-1 and improves glucose tolerance in vivo via TGR5
a, Concentration of CA7S in mouse cecum 5 hours after PBS or CA7S gavage. b, CA7S mice displayed increased GLP-1 levels 5 hours post-gavage. Mice remained fasting for the time between gavage and blood collection for GLP-1 measurement. (For a and b, n=8 mice per group, *p=0.02, two-tailed Welch’s t-test). c,d, DIO mice treated with CA7S (100 mg/kg) displayed increased glucose tolerance compared to vehicle-treated mice 3 hours post-gavage as determined by an oral glucose tolerance test (OGTT) (n=11 mice per group). c, Glycemic curves during OGTT (data not marked with asterisk(s) are not significant. 30 min *p=0.02, 60 min *p=0.02, 120 min p=0.6, two-tailed Student’s t-test). d, Corresponding blood glucose AUC and iAUC were significantly reduced in CA7S-treated mice (AUC *p=0.01, iAUC **p=4.00×10⁻³, two-tailed Welch’s t-test). e,f, On day 3 after treatment with lentiviral shRNA targeting GLP-1 receptor (Glp1r), CA7S (100 mg/kg) or PBS was administered, and 3 hours later, an OGTT was performed (n=11 mice per group). e, Glycemic curves during OGTT (data not marked with asterisk(s) are not significant. 30 min p=0.53, 60 min p=0.53, 120 min *p=0.02, two-tailed Student’s t-test). f, Corresponding blood glucose AUC and iAUC were not significantly different in CA7S- or PBS-treated mice in which the Glp1r had been knocked down (KD) (ns = not significant, AUC p=0.35, iAUC p=0.20, two-tailed Welch’s t-test). g,h, On day 3 after treatment with lentiviral shRNA targeting Tgr5, CA7S (100 mg/kg) or PBS was administered, and 3 hours later, an OGTT was performed (n=9 mice per group). g, Glycemic curves during OGTT (data not marked with asterisk(s) are not significant. 30 min p=0.87, 60 min p=0.85, 120 min p=0.52, two-tailed Student’s t-test). h, Corresponding blood glucose AUC and iAUC were not significantly different in CA7S- or PBS-treated mice in which the Tgr5 had been knocked down (KD) (ns = not significant, AUC p=0.56, iAUC p=0.97, two-tailed Welch’s t-test). For qRT-PCR expression analysis of Glp1r and Tgr5 knockdown in e-f and g-h, respectively, see Supplementary Figure 9.
Figure 6.
Figure 6.. CA7S displays anti-diabetic effects in a chronic setting and does not affect gallbladder filling
a, Concentration of CA7S in mouse cecum at day 48 (n=7 in each group, animals were fasted overnight prior to euthanasia). b-e, CA7S-dosed mice displayed increased GLP-1 (b), reduced blood glucose levels (c), increased blood insulin levels (d) and increased Tgr5 expression in the colon (e) compared to PBS-dosed mice. (For b-e, n=7 mice in each group), (b) GLP-1 levels *p=0.04 (c) change in glucose *p=0.04, absolute glucose **p=5.40×10⁻³, (d) insulin levels *p=0.02, (e) Tgr5 expression *p=0.04, two-tailed Welch’s t-test). f-h, Administration of CA7S did not induce gallbladder filling in mice. For (f) Gallbladder weights were measured 5 hours post-gavage with CA7S or PBS (n=8 mice per group, ns=not significant, p=0.95, two-tailed Welch’s t-test). For (g), gallbladder weights were measured 6 weeks post-sham or post-SG surgery (n=8 mice per group, ns=not significant, p=0.56, two-tailed Welch’s t-test). For (h), gallbladder weights were measured following 48 days of once-daily gavage with CA7S or PBS (PBS n=7, CA7S n=5 mice, ns=not significant p=0.96, two-tailed Welch’s t-test). All data are presented as mean ± SEM.

Comment in

References

    1. Batterham RL & Cummings DE Mechanisms of Diabetes Improvement Following Bariatric/Metabolic Surgery. Diabetes Care 39, 893–901 (2016). - PMC - PubMed
    1. Gloy VL et al. Bariatric surgery versus non-surgical treatment for obesity: a systematic review and meta-analysis of randomised controlled trials. BMJ 347, f5934–f5934 (2013). - PMC - PubMed
    1. Abbasi J. Unveiling the ‘Magic’ of Diabetes Remission After Weight-Loss Surgery. JAMA 317, 571–574 (2017). - PubMed
    1. Kaska L, Sledzinski T, Chomiczewska A, Dettlaff-Pokora A. & Swierczynski J. Improved glucose metabolism following bariatric surgery is associated with increased circulating bile acid concentrations and remodeling of the gut microbiome. World J. Gastroenterol 22, 8698–8719 (2016). - PMC - PubMed
    1. Fiorucci S. & Distrutti E. Bile Acid-Activated Receptors, Intestinal Microbiota, and the Treatment of Metabolic Disorders. Trends Mol Med 21, 702–714 (2015). - PubMed

Methods-only References

    1. Yao L. et al. A selective gut bacterial bile salt hydrolase alters host metabolism. eLife 7, e37182 (2018). - PMC - PubMed
    1. Cristina ML, Lehy T, Zeitoun P. & Dufougeray F. Fine structural classification and comparative distribution of endocrine cells in normal human large intestine. Gastroenterology 75, 20–28 (1978). - PubMed
    1. Verhoeckx K. et al. Caco-2 Cell Line. The Impact of Food Bioactives on Health 175, 103–111 (2015).
    1. Tiscornia G, Singer O, Ikawa M. & Verma IM A general method for gene knockdown in mice by using lentiviral vectors expressing small interfering RNA. PNAS 100, 1844–1848 (2003). - PMC - PubMed
    1. Blosser W. et al. A method to assess target gene involvement in angiogenesis in vitro and in vivo using lentiviral vectors expressing shRNA. PLOS ONE 9, e96036 (2014). - PMC - PubMed

Publication types

MeSH terms