. 2020 Sep;21(9):1094-1106.
doi: 10.1038/s41590-020-0743-0. Epub 2020 Aug 3.

Mapping systemic lupus erythematosus heterogeneity at the single-cell level

Affiliations

Mapping systemic lupus erythematosus heterogeneity at the single-cell level

Djamel Nehar-Belaid et al. Nat Immunol. 2020 Sep.

Abstract

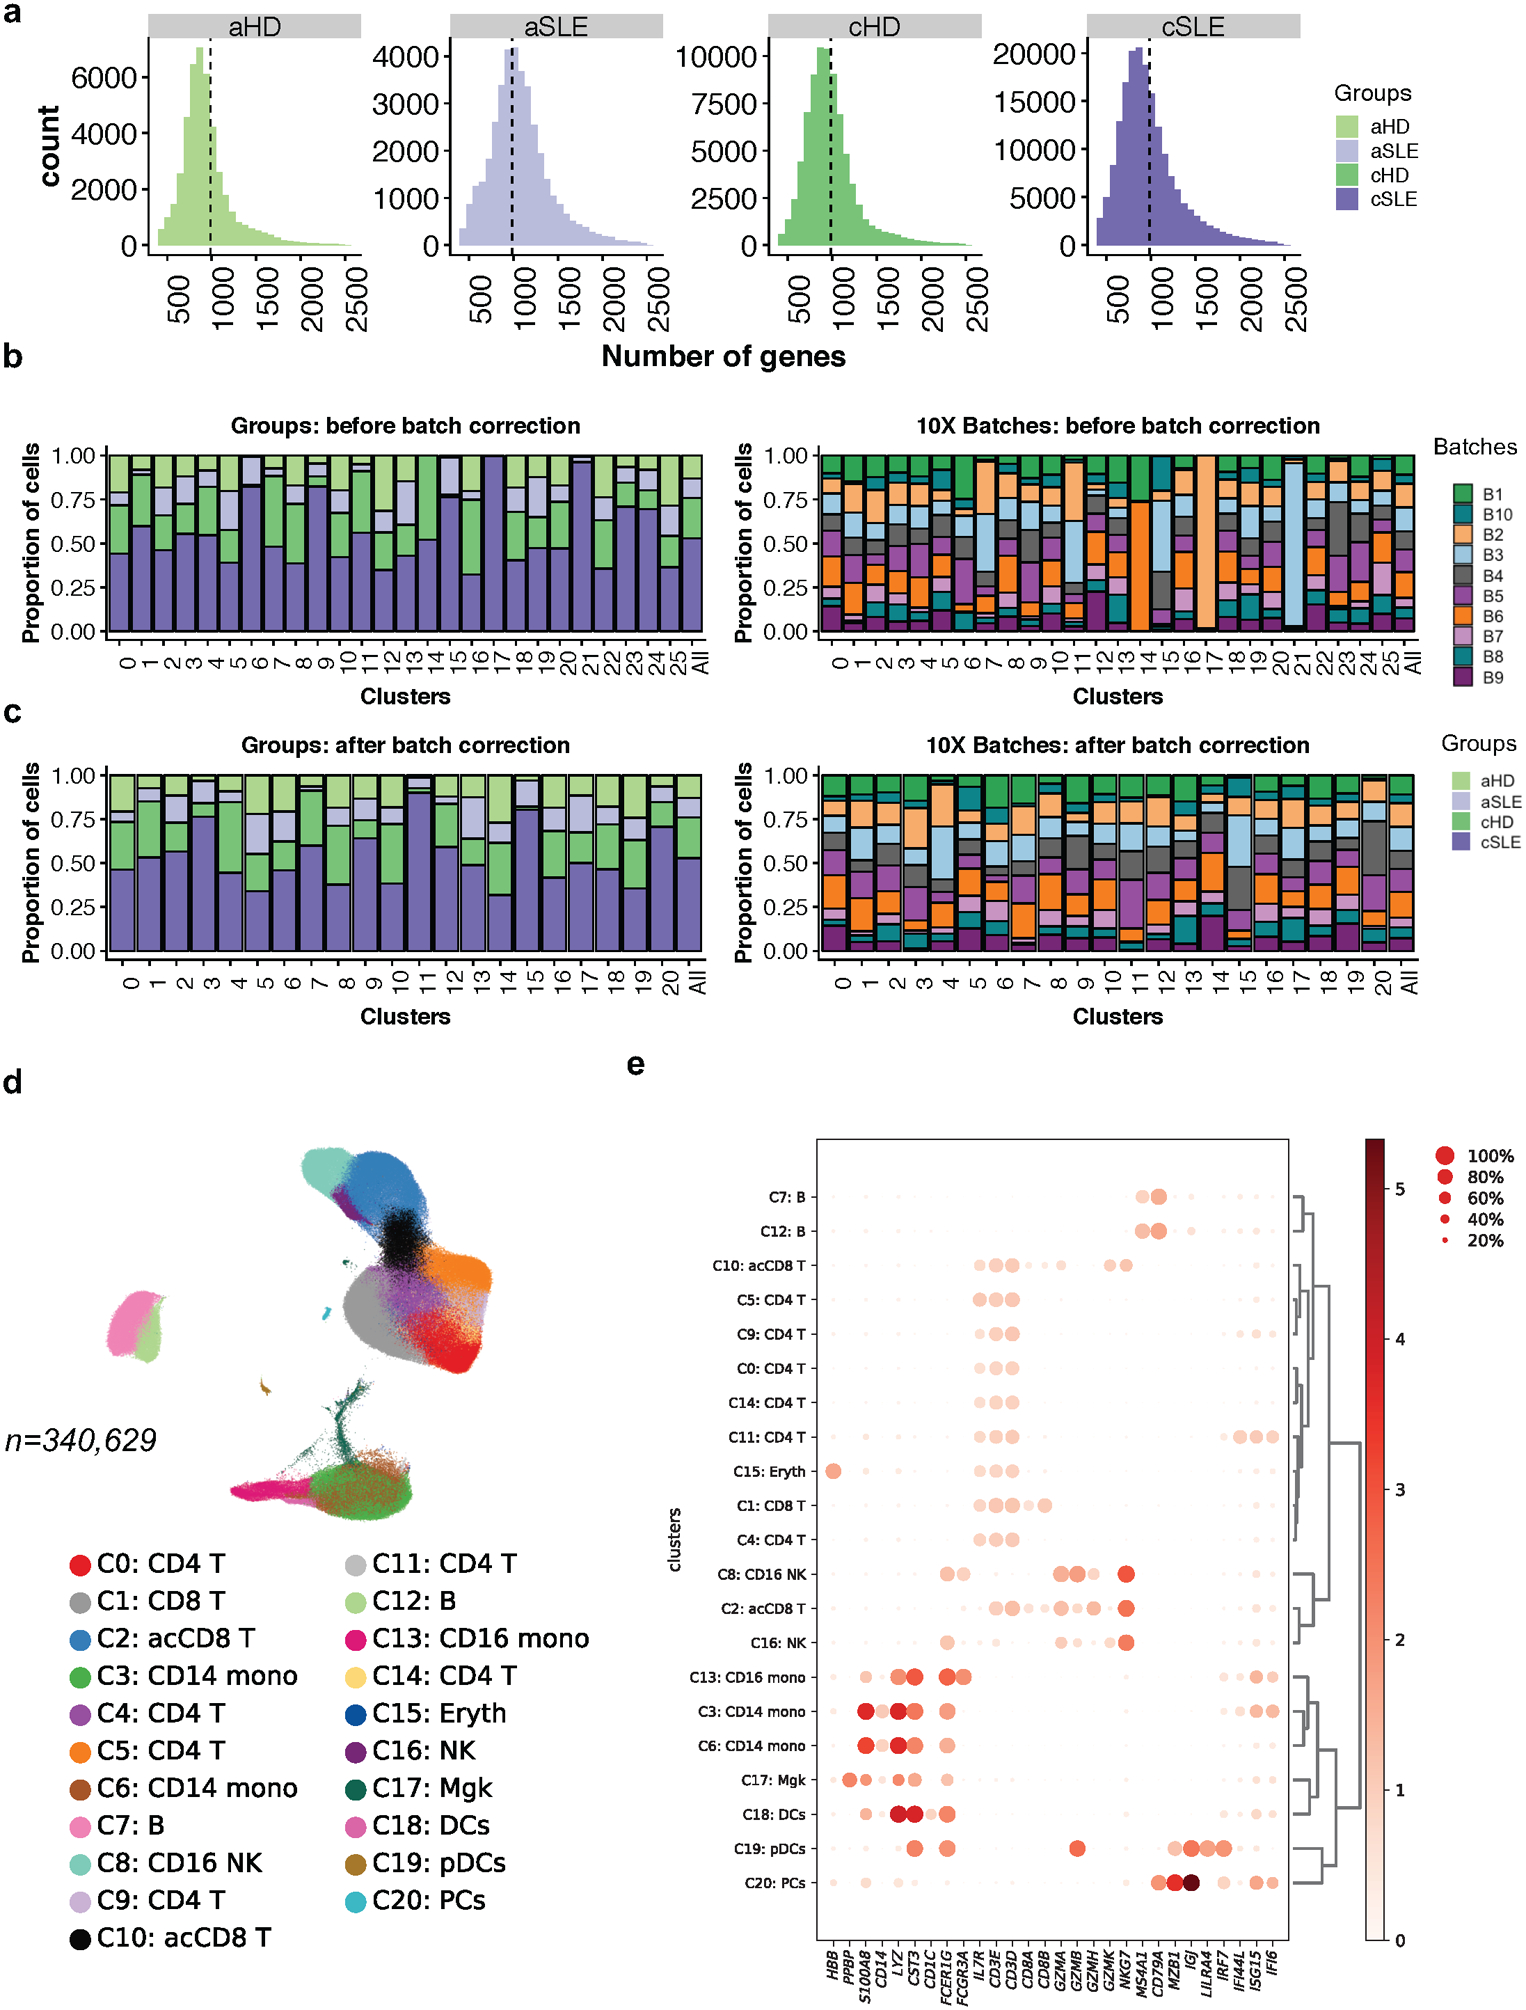
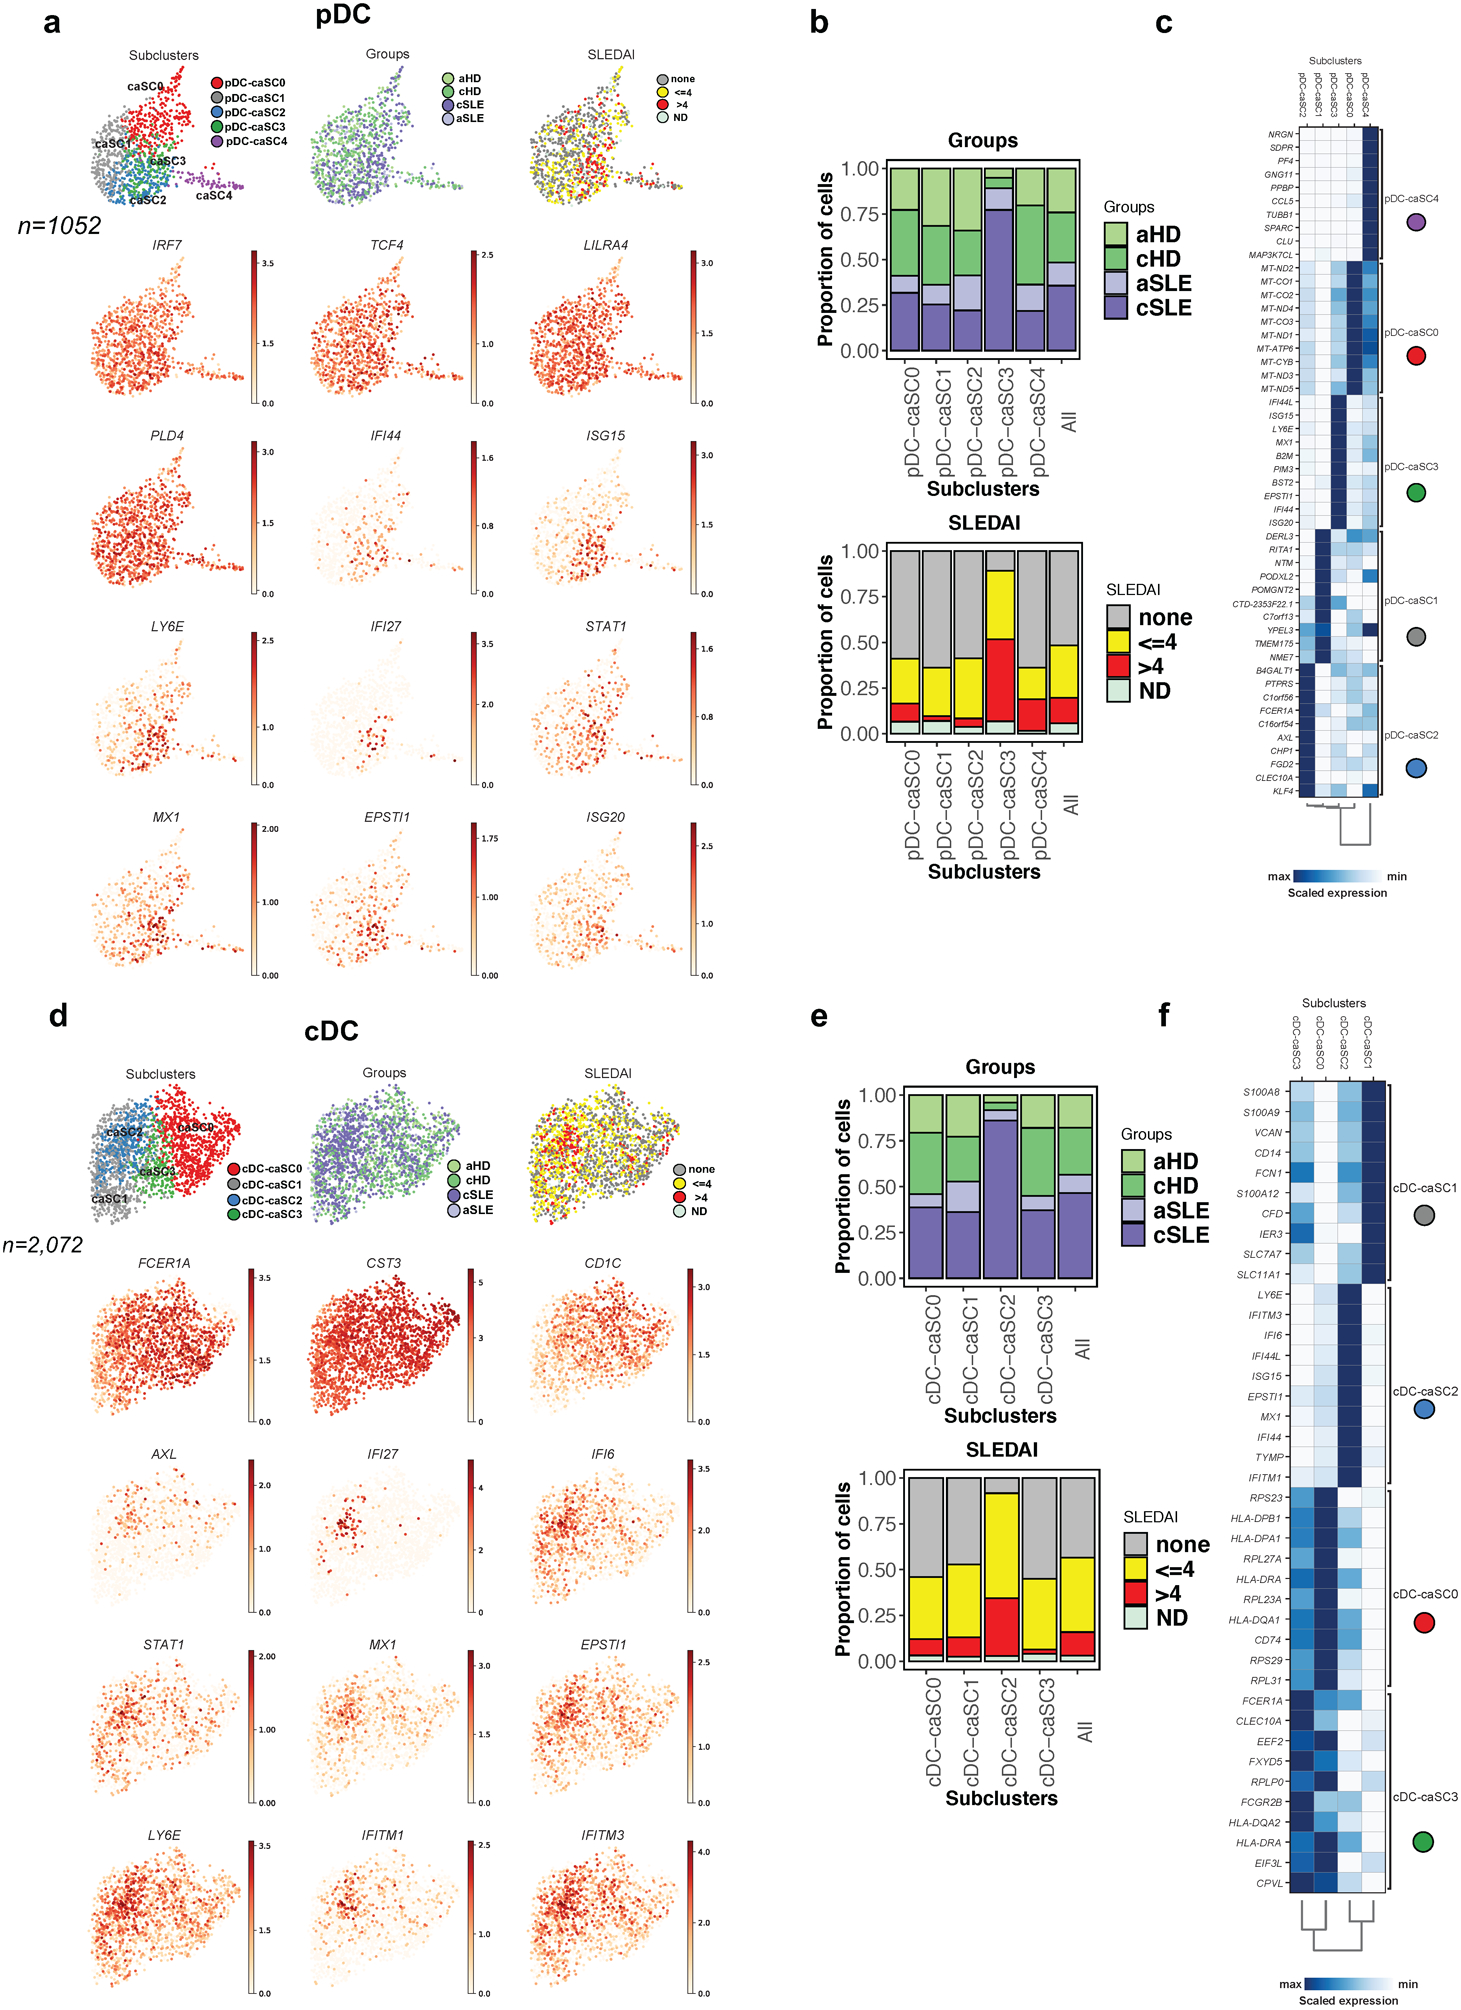
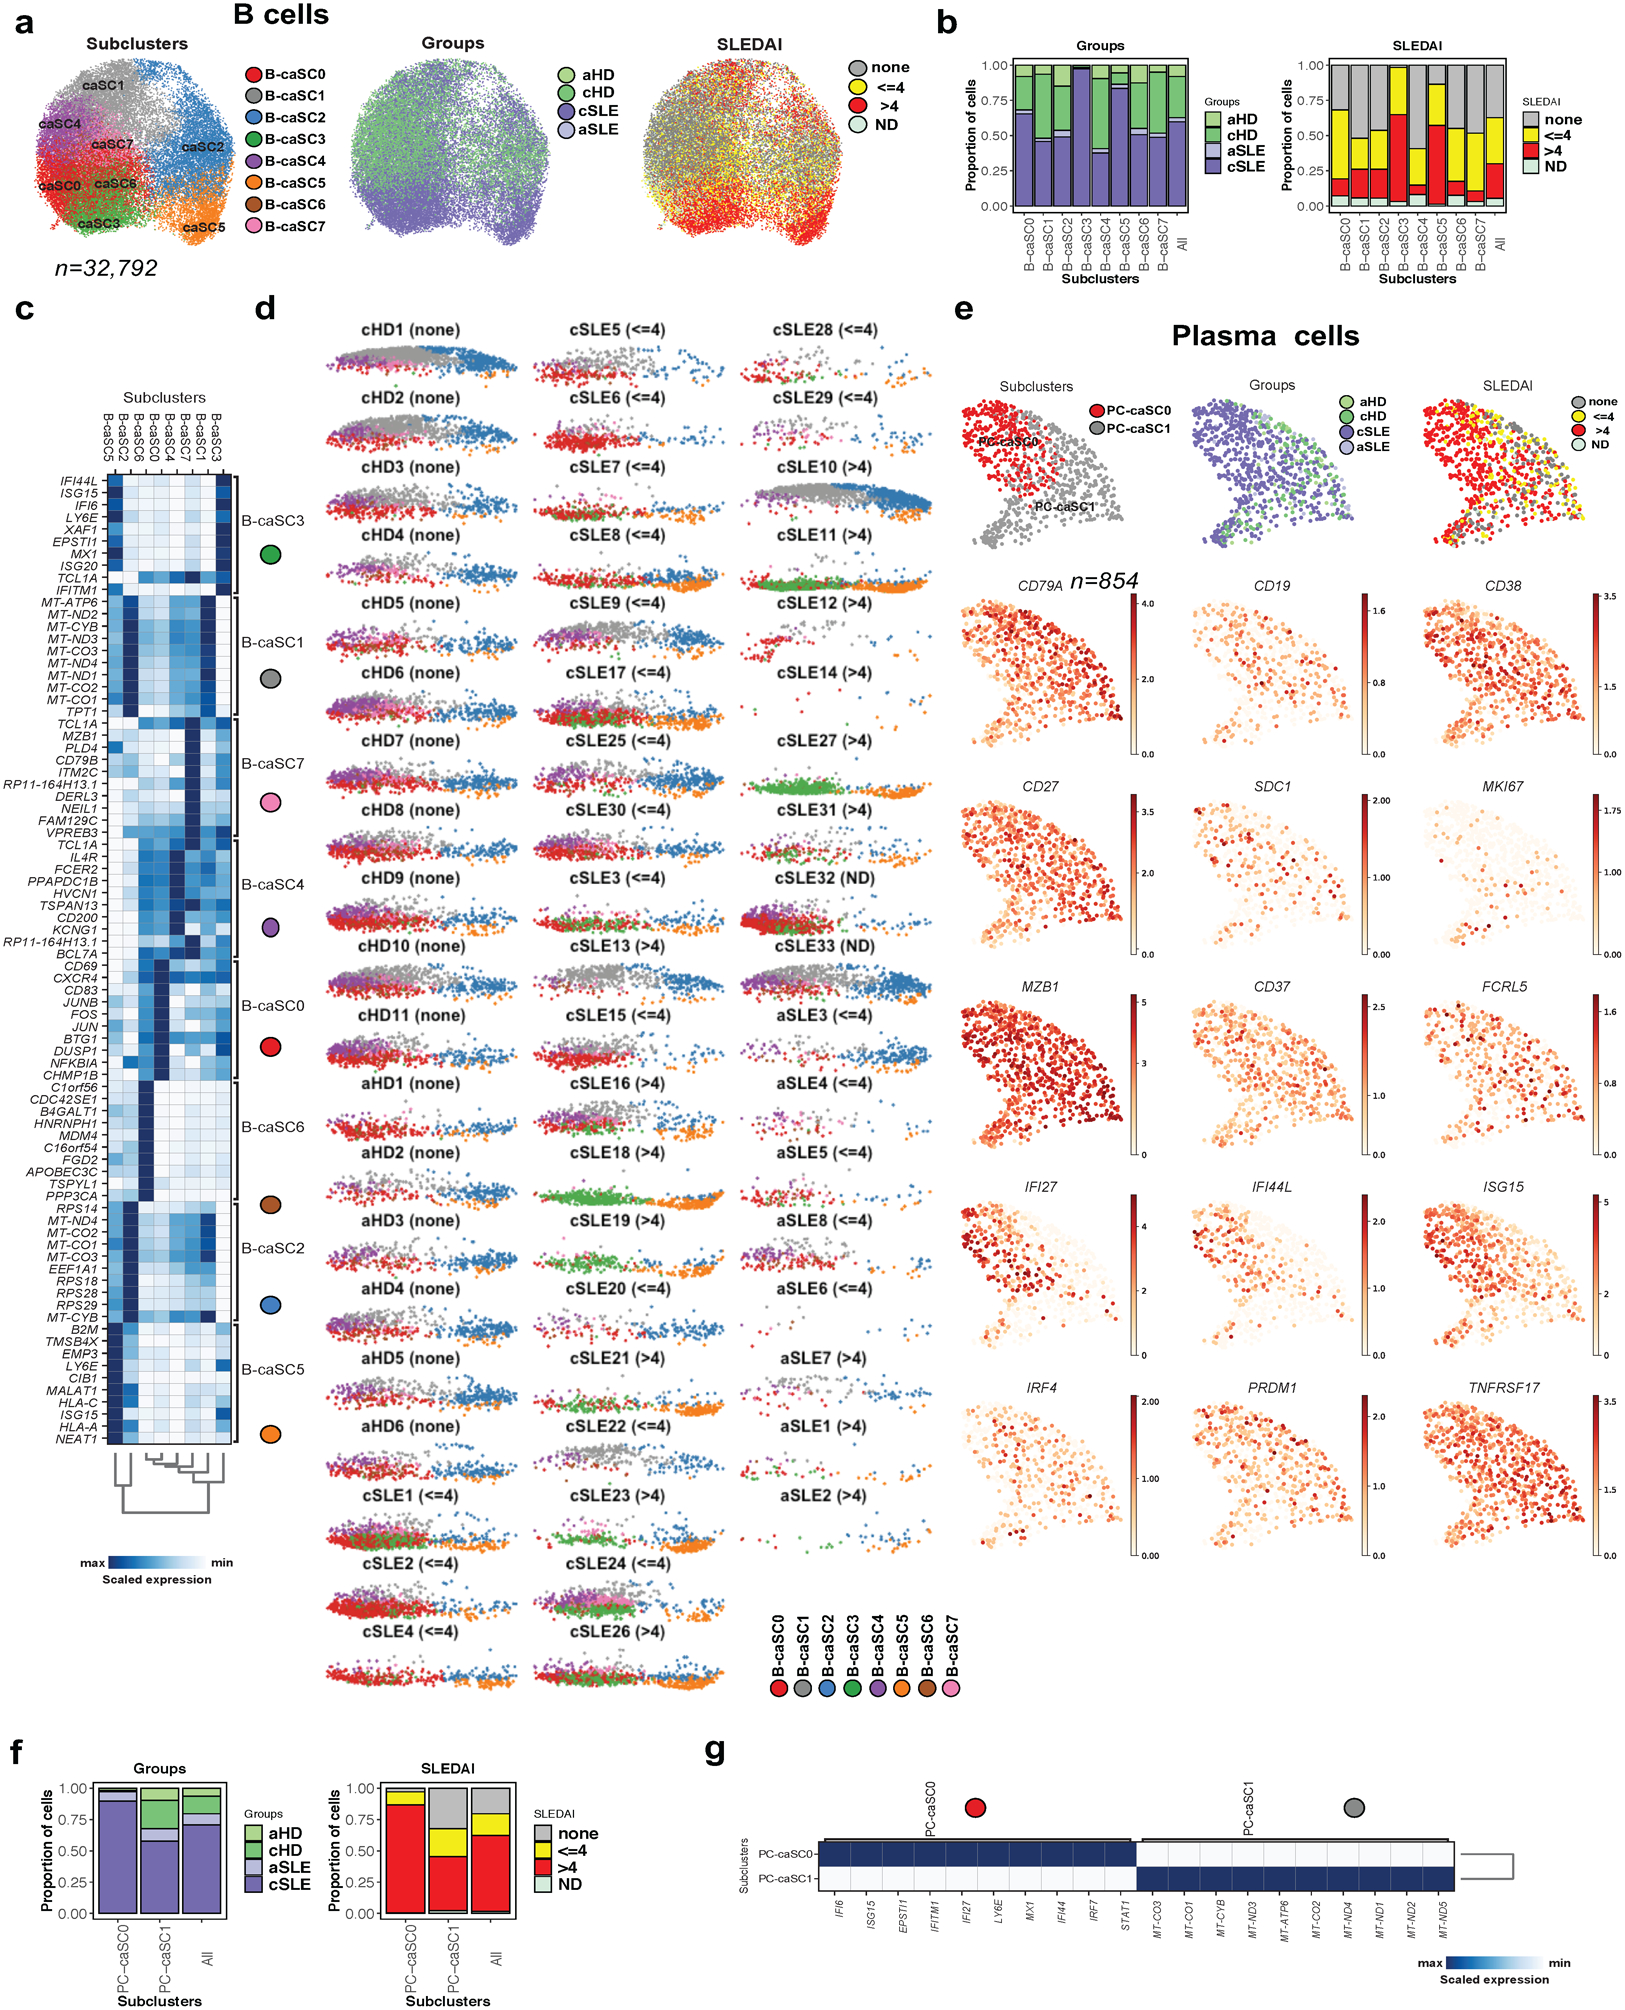
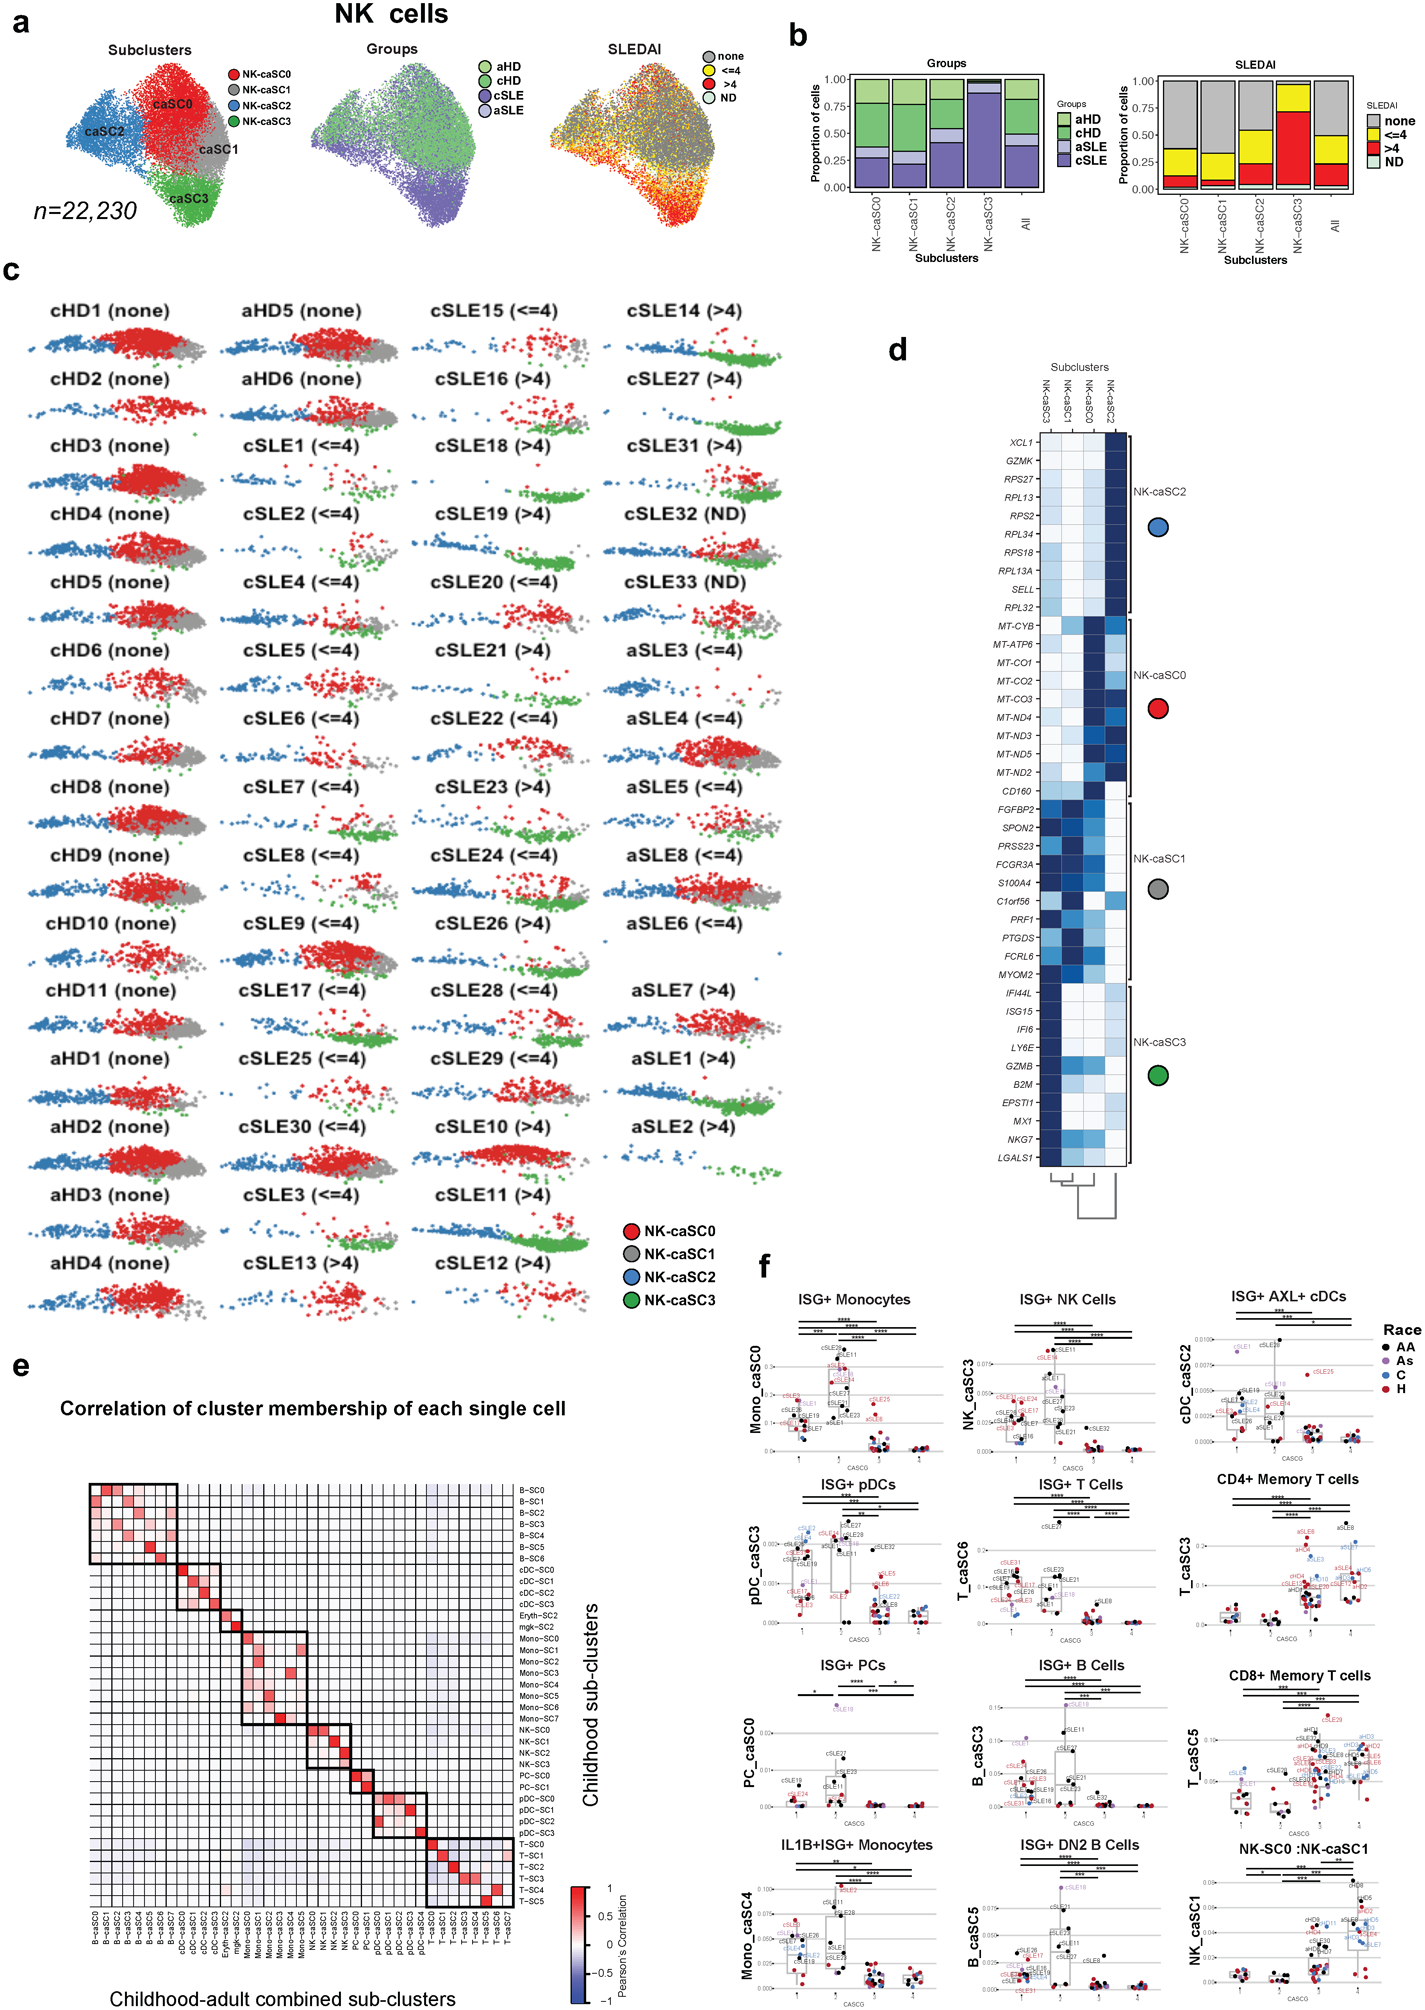
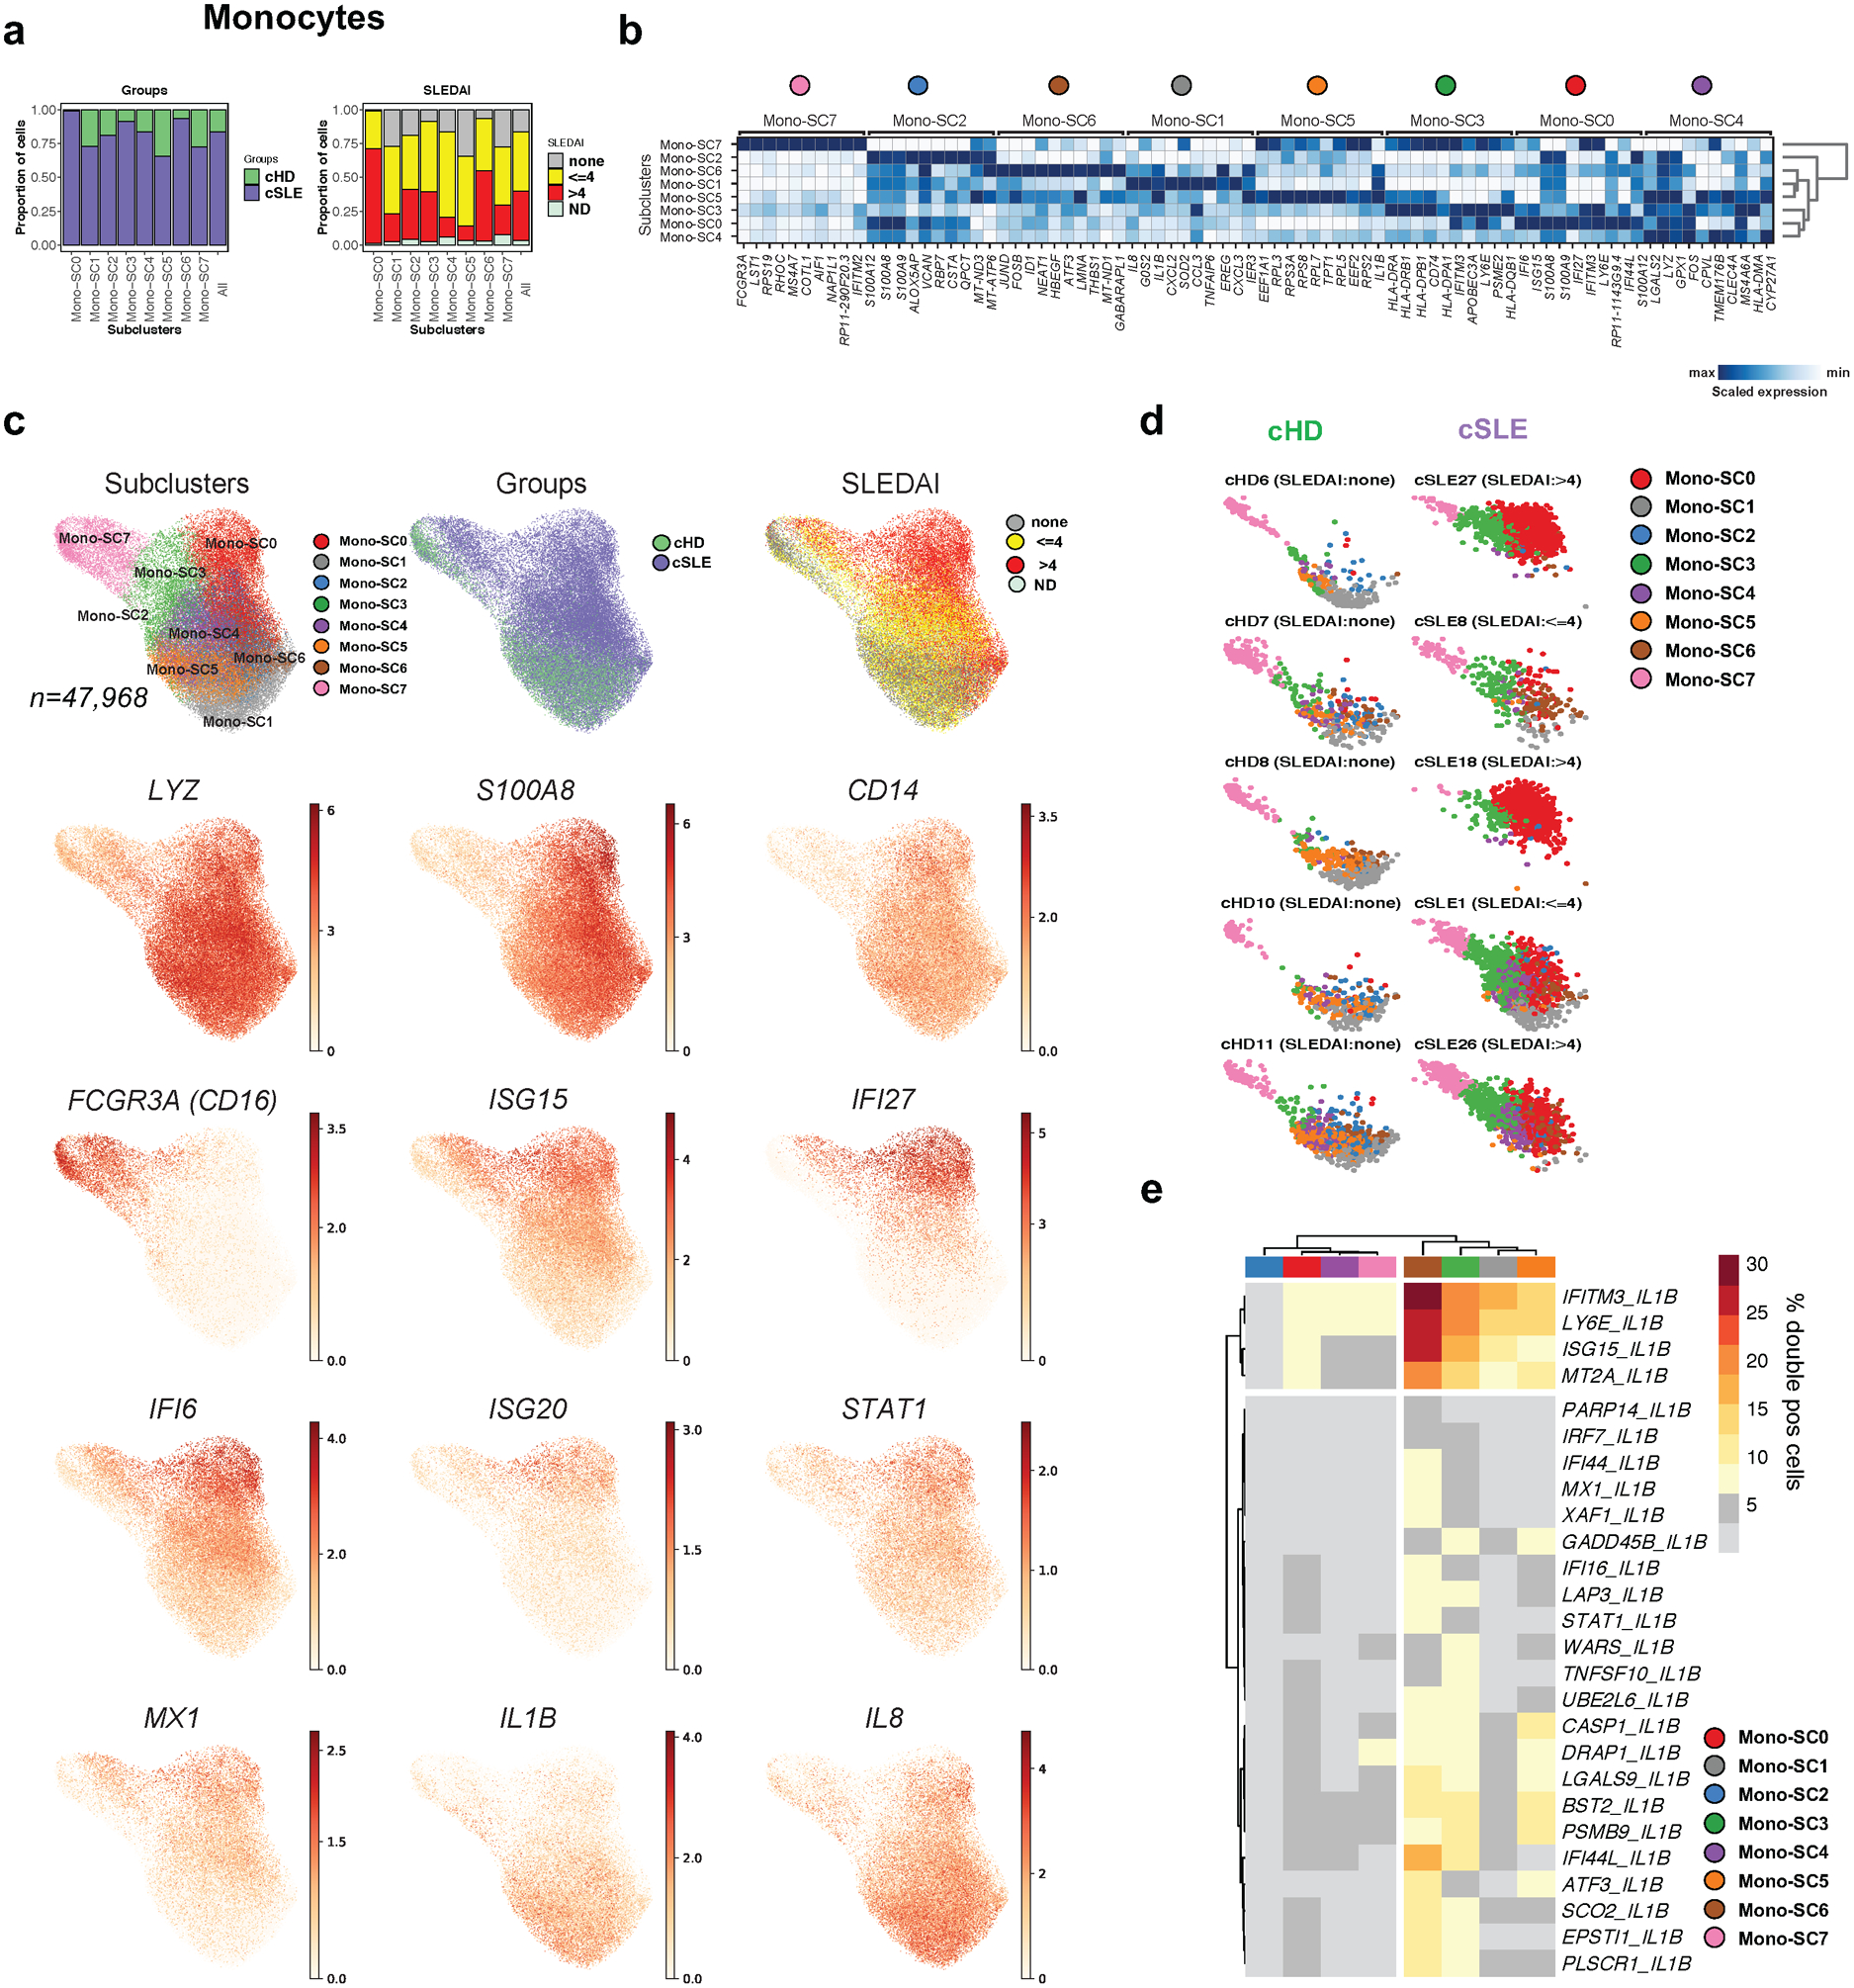
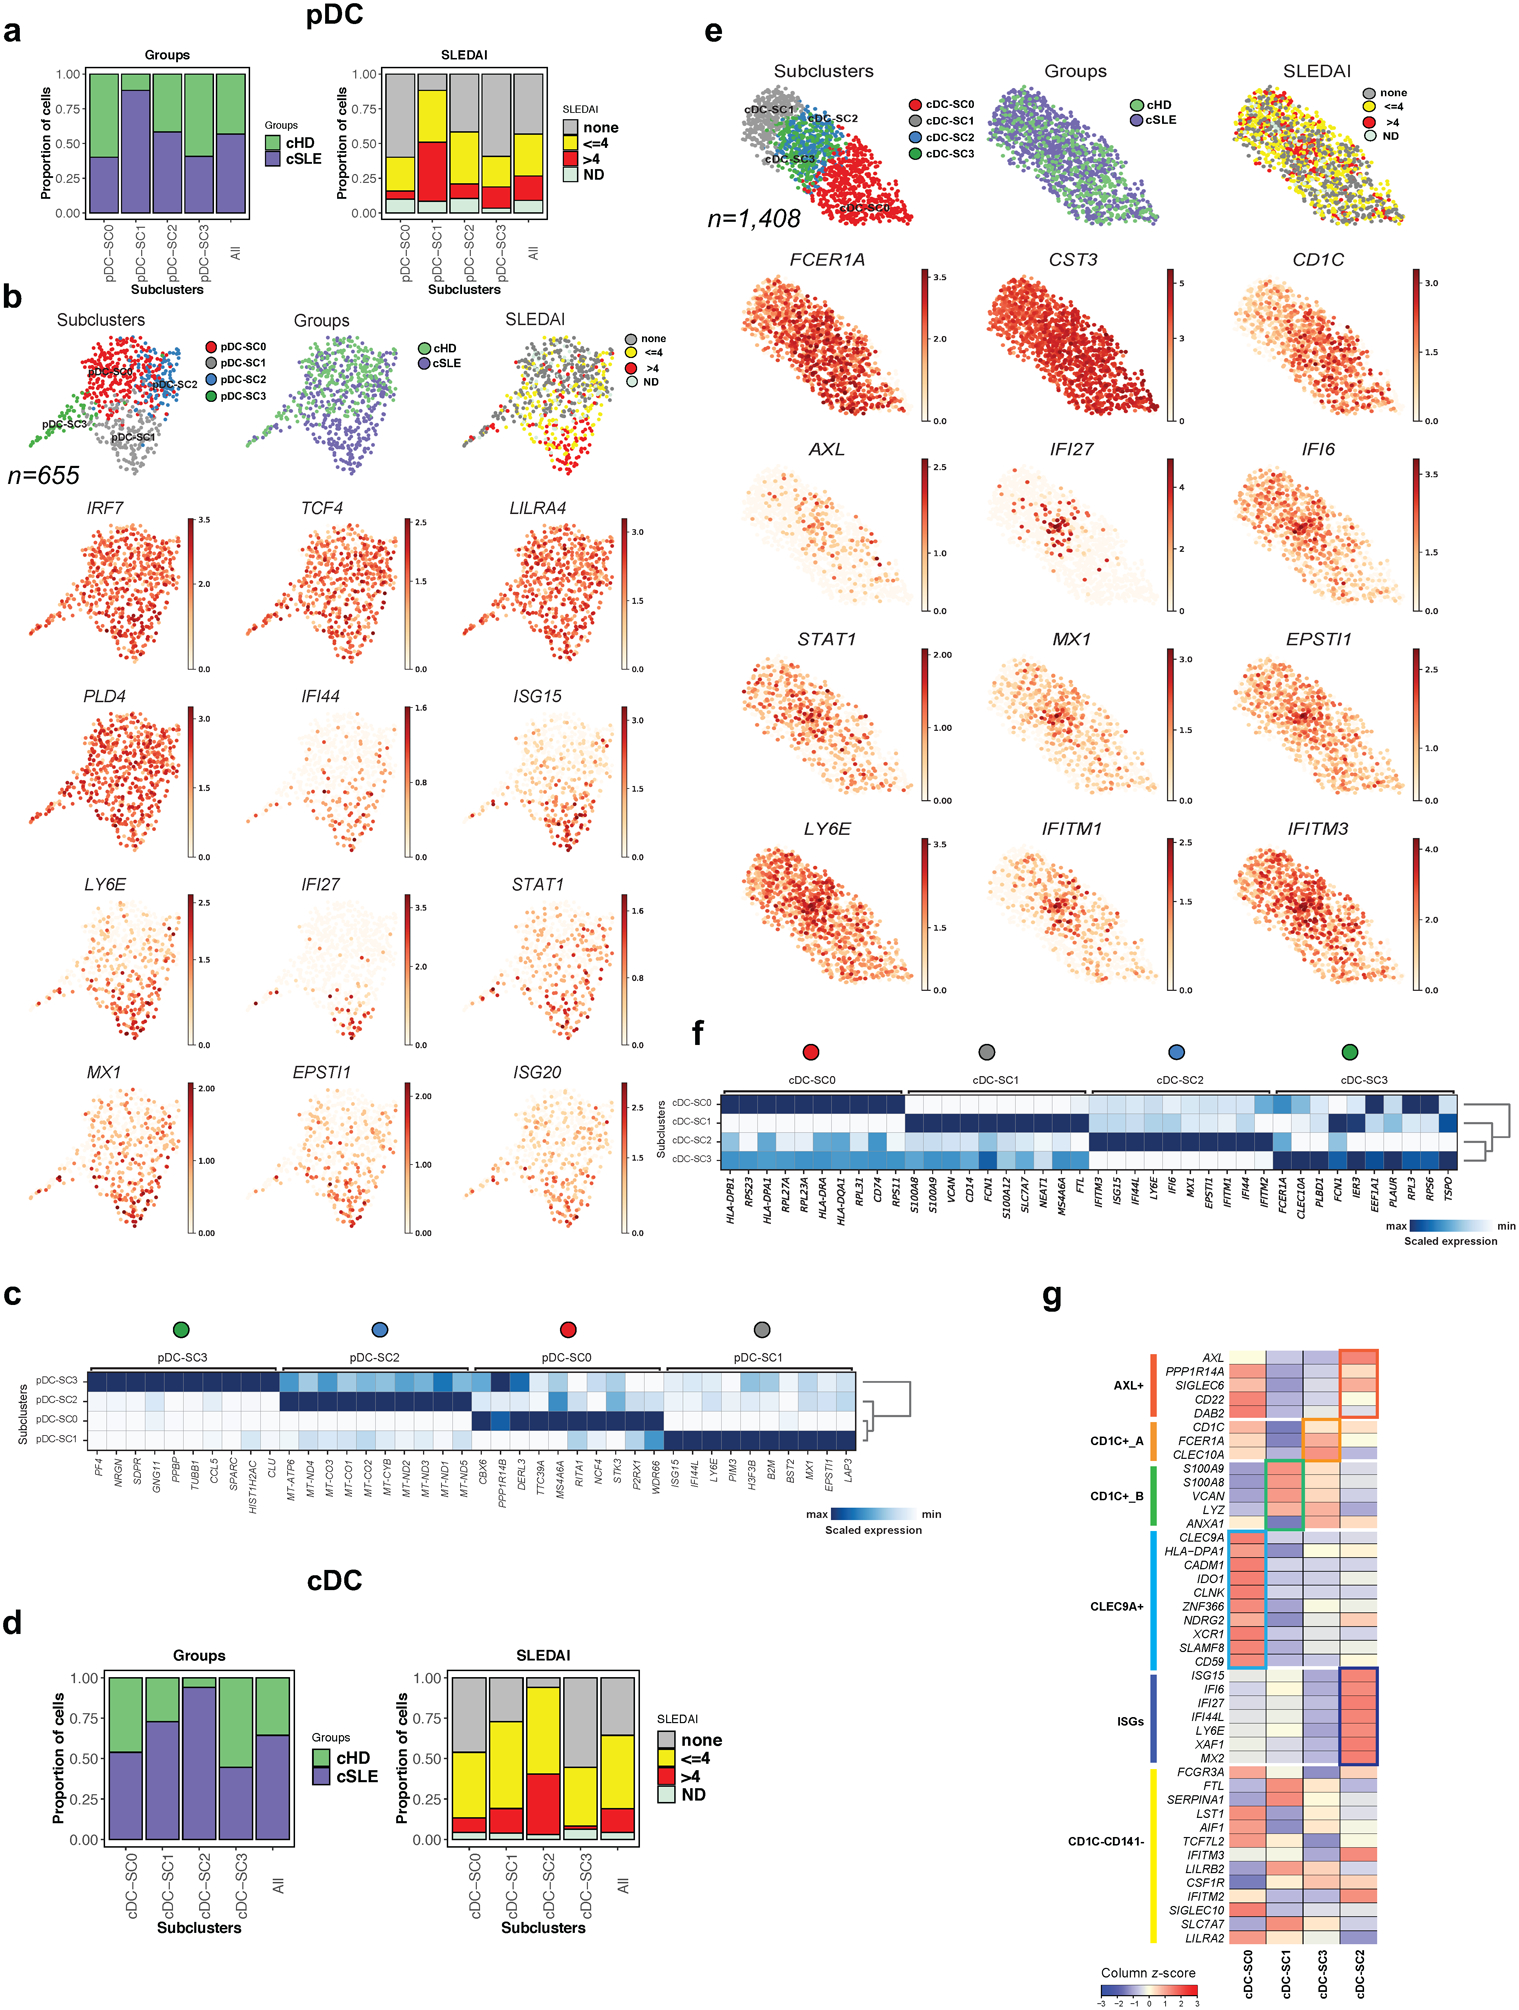
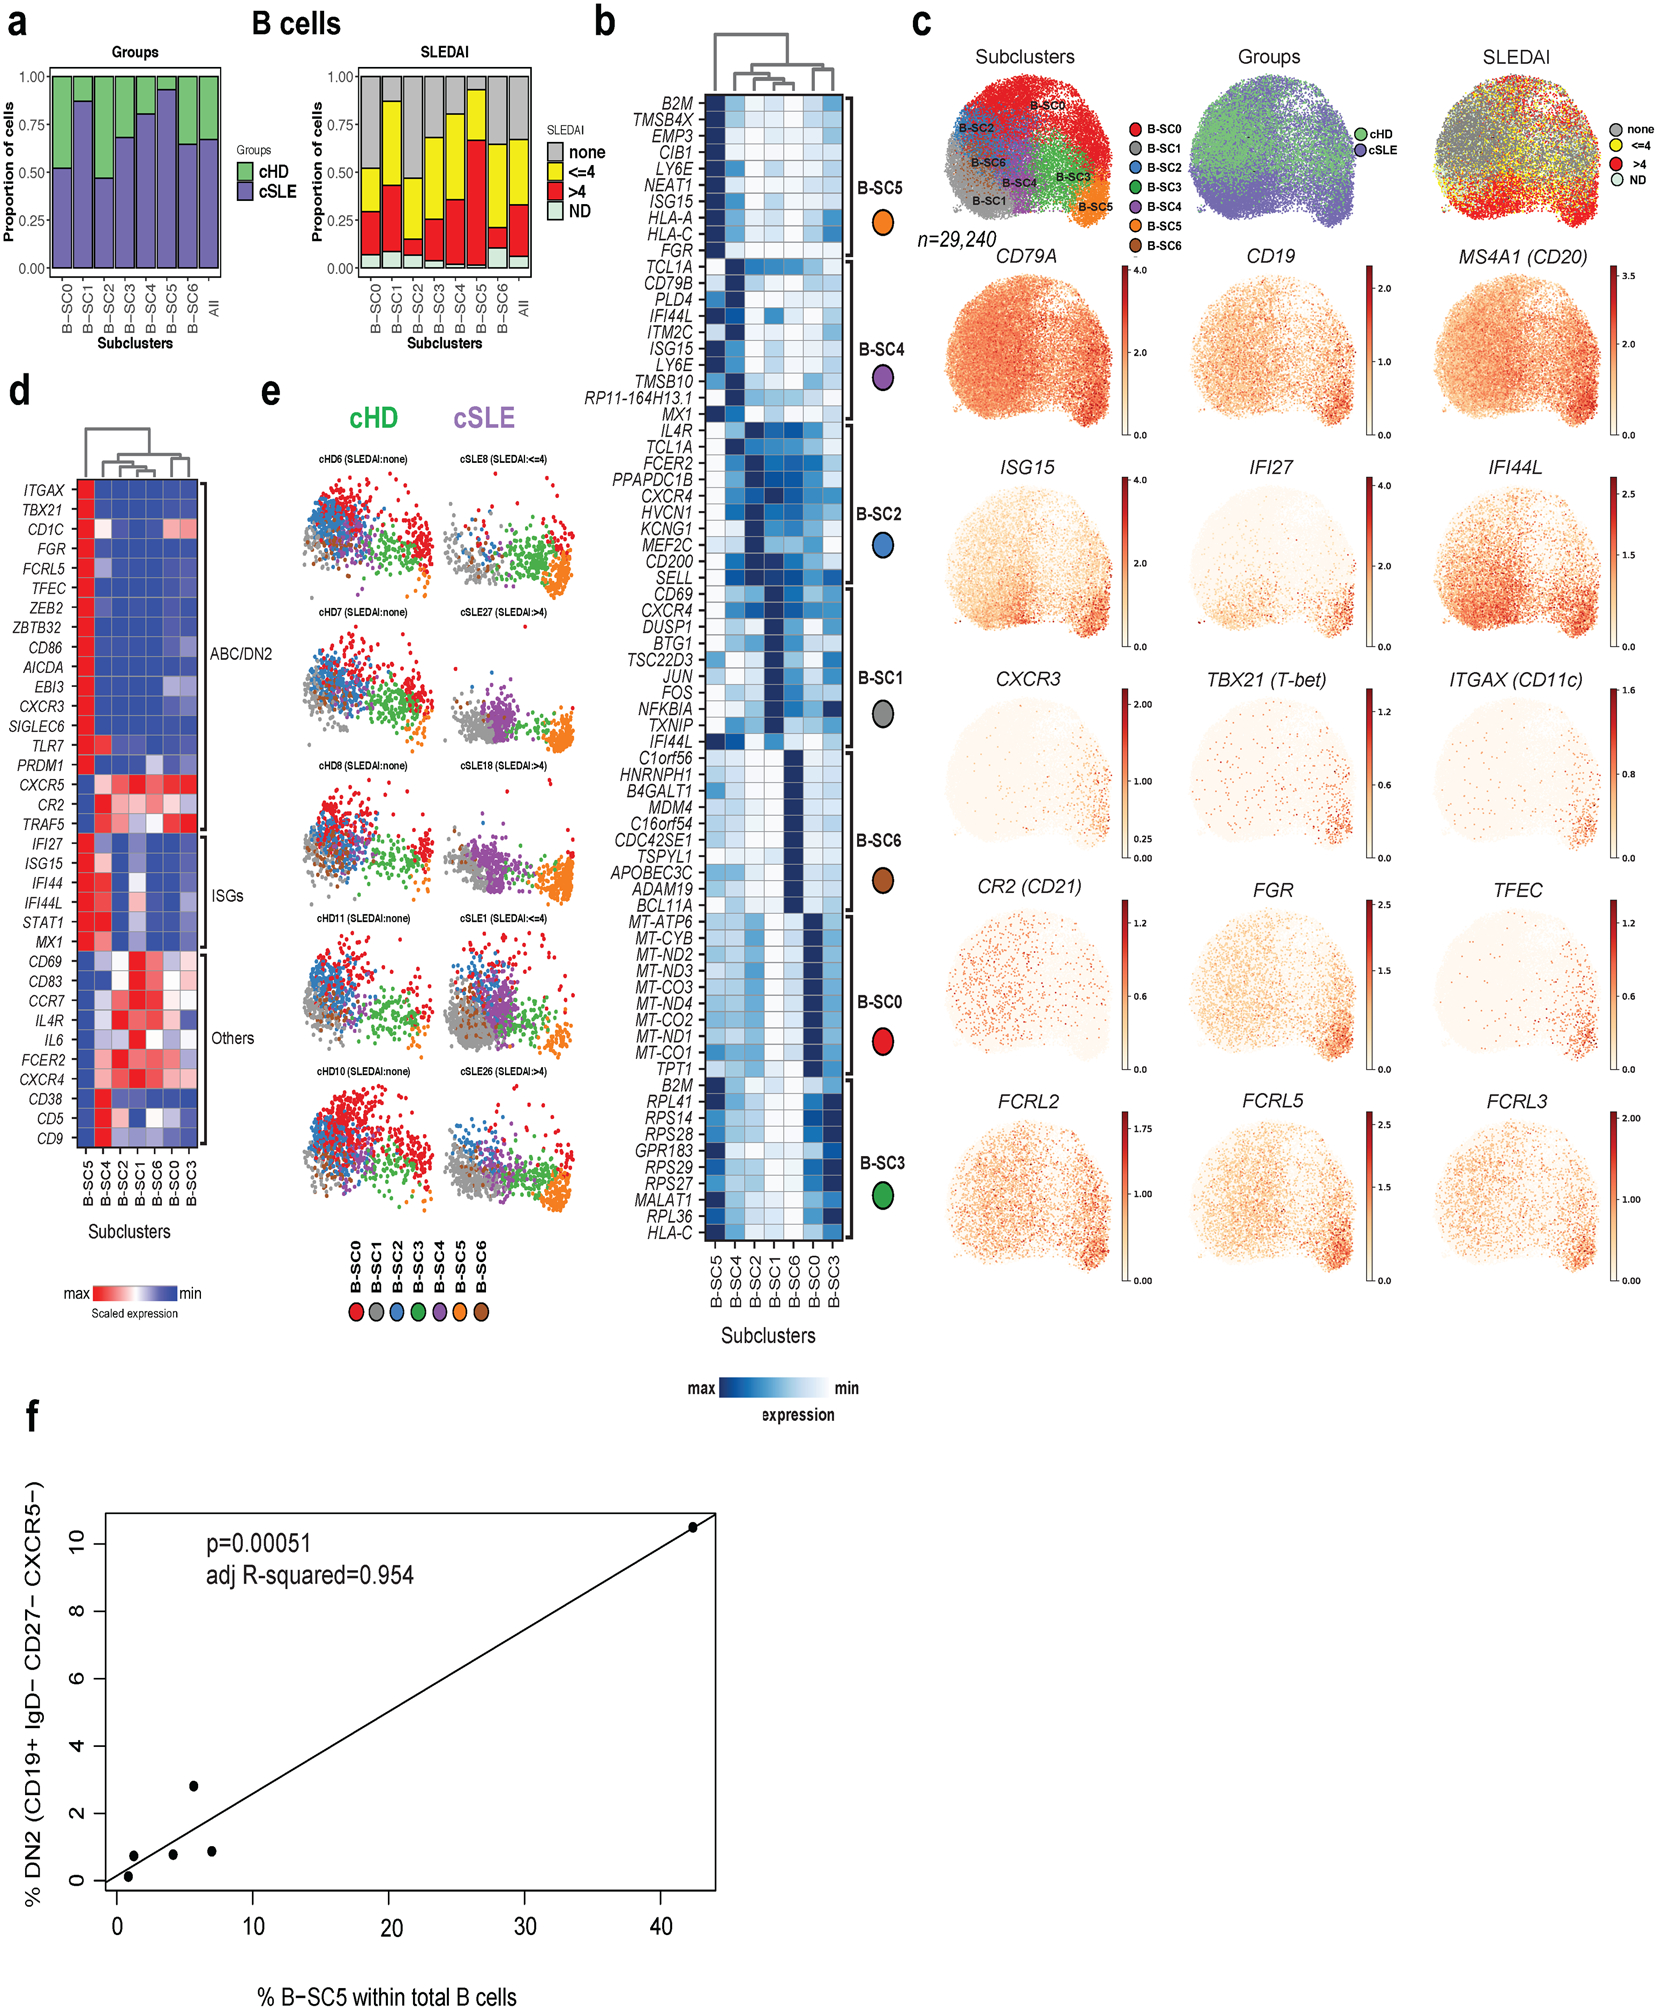
Patients with systemic lupus erythematosus (SLE) display a complex blood transcriptome whose cellular origin is poorly resolved. Using single-cell RNA sequencing, we profiled ~276,000 peripheral blood mononuclear cells from 33 children with SLE with different degrees of disease activity and 11 matched controls. Increased expression of interferon-stimulated genes (ISGs) distinguished cells from children with SLE from healthy control cells. The high ISG expression signature (ISGhi) derived from a small number of transcriptionally defined subpopulations within major cell types, including monocytes, CD4+ and CD8+ T cells, natural killer cells, conventional and plasmacytoid dendritic cells, B cells and especially plasma cells. Expansion of unique subpopulations enriched in ISGs and/or in monogenic lupus-associated genes classified patients with the highest disease activity. Profiling of ~82,000 single peripheral blood mononuclear cells from adults with SLE confirmed the expansion of similar subpopulations in patients with the highest disease activity. This study lays the groundwork for resolving the origin of the SLE transcriptional signatures and the disease heterogeneity towards precision medicine applications.


Conflict of interest statement

COMPETING INTERESTS STATEMENT

V.P. has acted as consultant for Sanofi and Astra Zeneca and is the recipient of a research award from Sanofi. J.F.B. is a member of the BOD and SAB of Neovacs.

Figures

Extended Data Fig. 1
Extended Data Fig. 1. childhood SLE (cSLE) dataset overview and batch effect correction
(a). Number of cells per individual (n=44). cSLE (n=33, in purple) and cHD (n=11; in green). (b). Number of genes per individual. cSLE (n=33, in purple) and cHD (n=11; in green). (c). Number of cells before and after filtration (which includes multiplet removal and other filtration steps that are described in Method), across the 44 individuals (33 cSLE and 11 cHD). (d). Bar plot highlighting the cell abundances across clusters (n=27) for cSLE and cHD (left panel) and 10X run batches (right panel) before batch effect correction. (e,f). Bar plot highlighting the cell abundances across clusters (n=20) for cSLE and cHD (left panel) and 10X run batches (right panel) after BBKNN (e), or Harmony (f) batch effect correction.
Extended Data Fig. 2
Extended Data Fig. 2. Global information after BBKNN batch correction and ISG scores throughout clusters/subclusters
(a). Bar plot displaying the cell composition of the 20 clusters. (b). Bar plot highlighting the individual (n=44) cell abundances across clusters (n=20) after BBKNN batch effect correction. (c,d). Heatmap representing Pearson correlation between individuals (n=44; c) or SLEDAI categories (d) based on overall scRNA seq dataset. The hierarchical clustering was based on the first 50 PCs. Red and blue colors, indicate positive and negative correlation, respectively. (e,f). ISG scores across the clusters (n=20; e) or SCs (n=37; f). Based on the average expression IFN modules M1.2, M3.4, M5.12, ISG scores have been calculated for each cell, across the clusters (e), or SCs (f). Erythrocyte cluster was a negative control.
Extended Data Fig. 3
Extended Data Fig. 3. Individuals’ UMAP for Monocytes and B cells subclusters.
(a). Individual UMAP plots from 11 cHD (left), 33 cSLE (right) based on monocyte SCs (Mono-SCs, n=8). Each color represents a distinct SC. (b). Flow cytometry detection of ISG15 in PBMCs gated on CD14+ monocytes from 17 cSLE patients with different SLEDAI scores, as well as 14 cHD. (c). Percentage of ISG15+ CD14+ monocytes in cHD and cSLE as categorized based on SLEDAI (cHD cells ‘none’ in gray, SLEDAI <=4, in yellow; n=9, and SLEDAI >4, in red; n=8). T-test was used for statistical analysis. P-values are shown for the respective comparisons. (d). Individual UMAP plots from 11 cHD (left), 33 cSLE (right) based on B cells SCs (B-SCs, n=7). Each color represents a distinct SC.
Extended Data Fig. 4
Extended Data Fig. 4. Individuals’ UMAP for T and NK cells subclusters
(a). Individual UMAP plots from 11 cHD (left), 33 cSLE (right) based on T cells SCs (T-SCs, n=6). Each color represents a distinct SC. (b). Percentage of GzB+, or Perforin+ CD8+ T cells within cHD and cSLE as categorized based on SLEDAI categories (cHD cells ‘none’ in gray, SLEDAI <=4 in yellow; n=9 and SLEDAI >4, in red; n=8). (c). Flow cytometry detection of GzB and perforin proteins in PBMCs, gated on CD8+ T cells, from cSLE (n=17) with different SLEDAI scores and cHD (n=14). T-test was used for statistical analysis. P-values are shown for the respective comparisons. (d). Individual UMAP plots from 11 cHD (left), 33 cSLE (right) based on NK SCs (NK-SCs, n=4). Each color represents a distinct SC. (e). Flow staining of ISG15 on PBMCs gated on CD57+ NK cells from six cSLE patients (in purple) with different SLEDAI scores and nine matched cHD (in green). MFI values are represented. (f). Boxplots representing the ESR (left panel), C4 (middle panel) and C3 (right panel) levels across the six cSLE subcluster groups (SCGs) depicted in Fig. 8b. (g). Dotplot representing the correlation between hemoglobin (HGB) levels (g/dL) and proportion of cells from the Erythrocyte cluster across the cSLE samples.
Extended Data Fig. 5
Extended Data Fig. 5. Overview of cSLE and aSLE combined (caSLE) dataset
(a). Number of detected genes across cells in cSLE (n=33), aSLE (n=8), cHD (n=11) and aHD (n=6). Vertical lines represent the mean. (b,c). Bar plot highlighting the cell abundances across cluster (n=26) for cSLE, aSLE, cHD and aHD groups (left panel) and 10X run batches (right panel) before (b) and after (c) BBKNN batch effect correction. Each color represents groups (left) and batch (right). (d). UMAP plot representing the 21 clusters across 340,629 PBMCs from cSLE (n=33), aSLE (n=8), cHD (n=11) and aHD (n=6). Each color represents a distinct cluster. (e). Cluster annotation. Dot plot representing expression values of selected genes (x-axis) across each cluster (y-axis). Dot size represents the percentage of cells expressing the marker of interest. Color intensity indicates the mean expression within expressing cells.
Extended Data Fig. 6
Extended Data Fig. 6. caSLE monocytes analysis.
(a). UMAP plots representing caSLE monocyte subclusters (Mono-caSCs, n=6), groups (cSLE, cHD, aSLE or aHD) and SLEDAI categories. (b). Bar plot highlighting the cell abundances across Mono-caSCs (n=6) for cSLE, cHD, aSLE or aHD groups (left panel) and SLEDAI categories (right panel). (c). Heatmap representing scaled expression values of the top 10 genes defining each of the Mono-SCs (n=6). (d). Individual UMAP plots from cSLE (n=33), aSLE (n=8), 11 cHD (n=11), or aHD (n=6), based on Mono-caSCs (n=6). Each color represents a distinct caSC.
Extended Data Fig. 7
Extended Data Fig. 7. caSLE pDC and cDC cells analysis.
(a). UMAP plots representing caSLE pDC subclusters (pDC-caSCs, n=5), groups (cSLE, cHD, aSLE or aHD), SLEDAI categories and selected genes. (b). Bar plot highlighting the cell abundances across pDC-caSCs (n=5) for cSLE, cHD, aSLE or aHD groups (top panel) and SLEDAI categories (bottom panel). (c). Heatmap representing scaled expression values of the top 10 genes defining each of the pDC-SCs (n=5). (d). UMAP plots representing cDC-caSCs (n=4), groups (cSLE, cHD, aSLE or aHD), SLEDAI categories and selected genes. (e). Bar plot highlighting the cell abundances across cDC-caSCs (n=4) for cSLE, cHD, aSLE or aHD groups (top panel) and SLEDAI categories (bottom panel). (f). Heatmap representing scaled expression values of the top 10 genes defining each of the cDC-caSCs (n=4).
Extended Data Fig. 8
Extended Data Fig. 8. caSLE B cells and plasma cells analysis.
(a). UMAP plots representing caSLE B cell subclusters (B-caSCs, n=8), groups (cSLE, cHD, aSLE or aHD) and SLEDAI categories. (b). Bar plot highlighting the cell abundances across B-caSCs (n=8) of cSLE, cHD, aSLE or aHD groups (left panel) and SLEDAI categories (right panel). (c). Heatmap representing scaled expression values of the top 10 genes defining each of the B-caSCs (n=8). (d). Individual UMAP plots from cSLE (n=33), aSLE (n=8), 11 cHD (n=11), or aHD (n=6), based on B-caSCs (n=8). Each color represents a distinct caSC. (e). UMAP plots representing PC SCs (n=2), Groups (cSLE, cHD, aSLE or aHD), SLEDAI categories and selected genes. (f). Bar plot highlighting the cell abundances across PC SCs (n=2) for cSLE, cHD, aSLE or aHD groups (left panel) and SLEDAI categories (right panel). (g). Heatmap representing scaled expression values of the top 10 genes defining each of the PC-caSC (n=2).
Extended Data Fig. 9
Extended Data Fig. 9. caSLE T cells analysis.
(a). UMAP plots representing caSLE T subclusters (T-caSCs, n=8), groups (cSLE, cHD, aSLE or aHD), and SLEDAI categories. (b). Bar plot highlighting the cell abundances across T-caSCs (n=8) for cSLE, cHD, aSLE or aHD (Groups; upper panel) and SLEDAI categories (lower panel). (c). Individual UMAP plots from cSLE (n=33), aSLE (n=8), 11 cHD (n=11), or aHD (n=6), based on SCs (n=8). Each color represents a distinct caSCs. (d). Heatmap representing scaled expression values of the top 10 genes defining each of the T-caSC (n=8).
Extended Data Fig. 10
Extended Data Fig. 10. caSLE NK cells analysis, correlation of cSC and caSC, and boxplots of caSC abundance throughout caSCGs.
(a). UMAP plots representing caSLE NK subclusters (NK-caSCs, n=4), groups (cSLE, cHD, aSLE or aHD) and SLEDAI categories. (b). Bar plot highlighting the cell abundances across NK-caSCs (n=4) for cSLE, cHD, aSLE or aHD (Groups; left panel) and SLEDAI categories (right panel). (c). Individual UMAP plots from cSLE (n=33), aSLE (n=8), 11 cHD (n=11), or aHD (n=6), based on NK-caSCs (n=4). Each color represents a distinct caSC. (d). Heatmap representing scaled expression values of the top 10 genes defining each of the NK-caSC (n=4). (e). Correlation plot of cluster memberships for each single cell in cSLE vs. caSLE datasets. SC membership information from the caSLE combined dataset (excluding aSLE samples) was correlated with cSLE dataset. (f). Boxplots representing the proportion of ISGhi Monocytes (Mono-caSC0), ISGhi NK cells (NK-caSC3), ISG+ AXL+ cDCs(cDC-caSC2), ISGhi pDCs (pDC-caSC3), ISGhi T cells (T-caSC6), CD4+ Memory T cells (T-caSC3), ISGhi PCs (PC-caSC0), ISGhi B cells (B-caSC3), CD8+ Memory T cells (T-caSC5), IL1B+ ISGhi Monocytes (Mono-caSC4), DN2 B cells (B-caSC5), NK-SC0 (NK-caSC1) SCs across the four caSCGs. Patients with Mono-caSC0 >0.08, NK-caSC3>0.01, cDC-caSC2>0.02, pDC-caSC3>0.0005, T-caSC6 >0.05, PC-caSC0>0.002, B-caSC3 >0.01, T-caSC5 >0.05, Mono-caSC4 >0.025, B-caSC5 >0.01, NK-caSC1> 0.022 are labelled with their sample names. *, P<0.05; **, P<0.01; ***, P<0.001: ****, P<0.0001
Figure 1.
Figure 1.. scRNA-seq reveals altered PBMCs composition in SLE patients.
(a). Overview of the pipeline. Raw data (n=275,588 cells) from 33 cSLE and 11 cHD were first cleaned from the multiplets, using Scrublet, then merged together, resulting in a dataset containing ~258k cells. After batch correction using BBKNN, the Scanpy-based pipeline was ran (see Methods section). (b). UMAP plot representing the 20 clusters across 258,868 PBMCs from 44 individual (33 cSLE and 11 cHD). The putative identity of each cluster was specified on the basis of Fig. 1c and Supplementary Table 2a. The cluster labels were added manually. (c). Cluster annotation. Dot plot represents expression values of selected genes (x-axis) across each cluster (y-axis). Dot size represents the percentage of cells expressing the marker of interest. Color intensity indicates the mean expression within expressing cells. (d). Barplot representing the cell abundance of each cluster (n=20) across the 44 individuals (33 cSLE and 11 aHD). (e). Violin plot comparing the proportion of each cluster (n=20) across the individual (n=44). cSLE are shown in purple, and cHD in green. P values were calculated using Wilcoxon test comparing the mean(cSLE) with mean(cHD). *, P<0.05; **, P<0.01; ***, P<0.001: ****, P<0.0001. (f). Heat map representing the mean expression of IFN-related genes (n=100 unique genes, from Gene ontology and modules) across the clusters (n=20) and groups (cSLE in purple and cHD in green). Color indicates the mean expression within each cluster. Column-side color key represents annotations of IFN genes. IFN, interferon.
Figure 2.
Figure 2.. Monocyte clusters display altered transcriptional profiles in cSLE.
(a). Bar plot highlighting cell abundances across monocyte subclusters (Mono-SCs; n=8) for the cSLE and cHD groups (left panel) and SLEDAI categories (right panel). (b). Heatmap representing scaled expression values of the top 10 genes defining each of the Mono-SC (n=8). (c). UMAP plots representing Mono-SCs (n=8), groups (cSLE or cHD), SLEDAI categories and expression values of selected genes. (d). Individual UMAP plots from five representative cHD (left) and cSLE (right, entire figure provided in Extended Data Fig. 3a) based on Mono-SCs (n=8). Each color represents a distinct SC. (e). Heatmap showing the percentage of double positive cells (i.e. co-expressing “IL1B” and ISGs genes) across SCs (n=8, columns). For visualization purposes, only the clusters showing more than 5% of double positive cells have been considered.
Figure 3.
Figure 3.. Characterization of pDC and cDCs single cell landscape in cSLE.
(a). Bar plot highlighting cell abundances across pDC-SCs (n=4) for the cSLE and cHD groups (left panel) and SLEDAI categories (right panel). (b). UMAP plots representing pDC-SCs (n=4), groups (cSLE or cHD), SLEDAI categories and expression values of selected genes. (c). Heatmap representing scaled expression values of the top 10 genes defining each of the pDC-SC (n=4, see methods). (d). Bar plot highlighting cell abundances across cDC-SCs (n=4) for the cSLE and cHD groups (left panel) and SLEDAI categories (right panel). (e). UMAP plots representing cDC-SCs (n=4), groups (cSLE or cHD), SLEDAI categories and expression values of selected genes. (f). Heatmap representing scaled expression values of the top 10 genes defining each of the cDC-SC (n=4, see methods). (g). Heat map representing the scaled average expression of DC markers based on previous study and of ISGs across the four cDC-SCs. ISG, Interferon Stimulated-Genes.
Figure 4.
Figure 4.. B cells reveals the presence of double-negative (CD19+ IgD CD27 and CXCR5) B cells in cSLE.
(a). Bar plot highlighting cell abundances across B-SCs (n=7) for the cSLE and cHD groups (left panel) and SLEDAI categories (right panel). (b). Heatmap representing scaled expression values of the top 10 genes defining each of the B-SC (n=7, see methods). (c). UMAP plots representing B-SCs (n=7), groups (cSLE or cHD), SLEDAI categories and expression values of selected genes. (d). Heatmap representing scaled expression values of DN2, selected ISGs and other B cell gene markers across the seven B-SCs. (e). Individual UMAP plots from five representative cHD (upper panel) and cSLE (lower panel, entire figure in Extended Data Fig. 3d) based on B-SCs (n=7). Each color represents a distinct SC. (f). Correlation analysis comparing the percentage of DN2 (CD19+ IgD CD27 and CXCR5) as quantified by flow cytometry, with the percentage of B-SC5 within the total B cells as quantified by scRNA-seq.
Figure 5.
Figure 5.. cSLE plasmablast/plasma cells analysis revealed an expansion of ISGhi subcluster.
(a). Bar plot highlighting cell abundances across PC-SCs (n=2) for the cSLE and cHD groups (left panel) and SLEDAI categories (right panel). (b). Heatmap representing scaled expression values of the top 10 genes defining each of the PC-SC (n=2, see methods). (c). UMAP plots representing PC-SCs (n=2), groups (cSLE or cHD), SLEDAI categories and expression values of selected genes.
Figure 6.
Figure 6.. cSLE T cells analysis revealed an expansion of ISGhi subcluster.
(a). Bar plot highlighting the cell abundances across T-SCs (n=6) for cSLE and cHD groups (left panel) and SLEDAI categories (right panel). (b). Heatmap representing scaled expression values of the top 10 genes defining each of the T-SC (n=6; c). (c). Individual UMAP plots from five representative cHD (left) and cSLE (right, entire figure in Extended Data Fig. 4a) based on T-SCs (n=6). Each color represents a distinct SC. (d). Heat map representing the scaled average expression of T cell lineage markers (columns) across the T-SCs (rows; n=6). (e). UMAP plots representing T-SCs (n=6), groups (cSLE or cHD), SLEDAI categories and expression values of selected genes.
Figure 7.
Figure 7.. cSLE NK cells analysis revealed an expansion of ISGhi subcluster.
(a). Bar plot highlighting the cSLE and cHD groups (left panel) and SLEDAI categories (right panel) cell abundances across the four NK-SCs. (b). Heatmap representing scaled expression values of the top 10 genes defining each of the NK-SC (n=4). (c). UMAP plots representing NK-SCs (n=4), groups (cSLE or cHD), SLEDAI categories as well as expression values of selected genes.
Figure 8.
Figure 8.. Subcluster-based clinical stratification of children and adult cohorts.
(a). Heatmap representing scaled expression values of lupus related monogenic disorder (LRMD)-associated genes (n=19), across the 37 subclusters (SCs). (b). Heat map representing frequencies of SCs (n=37) from childhood cohort, across cSLE (n=33, in purple) and cHD (n=11, in green) samples. Groups (cHD and cSLE), race (African American; AA, Hispanic; H Asian; As and Caucasian; C), mycophenolate mofetil (MMF) treatment and SLEDAI categories are indicated by color on the column-side key. Components of SLEDAI score on the visit date for SLE patients are color-coded on the bottom. Six main groups of samples are generated and denoted as subcluster groups (SCGs). Euclidian distance and ward.D2 clustering algorithm were used. (c). Overview of the pipeline. Raw data from cSLE (n=33; dark purple), aSLE (n=8; light purple), cHD (n=11; dark green) and aHD (n=6; light green) were first cleaned from the multiplets using Scrublet, then merged together, resulting in a dataset containing ~ 333k PBMCs. After batch correction, the Scanpy-based pipeline was then run (see Methods section). (d). Heat map representing frequencies of subclusters (caSCs, n=39) generated from childhood-adult combined cohorts across cSLE (n=33), aSLE (n=8), cHD (n=11) and aHD (n=6). Groups, race, MMF, SLEDAI, and SCGs are indicated by color on the column-side key. SCG are the groups determined in Fig. 6b. SLEDAI components distribution on the visit date for SLE patients are color-coded on the bottom. SLEDAI scores for aSLE patients are denoted in the bottom of the SLEDAI component. Four main groups of samples are generated and denoted as Childhood-Adult combined Group (caSCG). Euclidian distance and ward.D2 clustering algorithm were used.

References

    1. Arbuckle MR et al. Development of autoantibodies before the clinical onset of systemic lupus erythematosus. N. Engl. J. Med 349, 1526–1533 (2003). - PubMed
    1. Elkon KB & Wiedeman A Type I IFN system in the development and manifestations of SLE: Current Opinion in Rheumatology 24, 499–505 (2012). - PubMed
    1. Tsokos GC Systemic lupus erythematosus. N. Engl. J. Med 365, 2110–2121 (2011). - PubMed
    1. Navarra SV et al. Efficacy and safety of belimumab in patients with active systemic lupus erythematosus: a randomised, placebo-controlled, phase 3 trial. The Lancet 377, 721–731 (2011). - PubMed
    1. Baechler EC et al. Interferon-inducible gene expression signature in peripheral blood cells of patients with severe lupus. Proc. Natl. Acad. Sci. U.S.A 100, 2610–2615 (2003). - PMC - PubMed

Publication types