Clinical Trial
. 2020 Oct;21(10):1244-1255.
doi: 10.1038/s41590-020-0744-z. Epub 2020 Aug 3.

Follicular helper T cell profiles predict response to costimulation blockade in type 1 diabetes

Affiliations
Clinical Trial

Follicular helper T cell profiles predict response to costimulation blockade in type 1 diabetes

Natalie M Edner et al. Nat Immunol. 2020 Oct.

Abstract

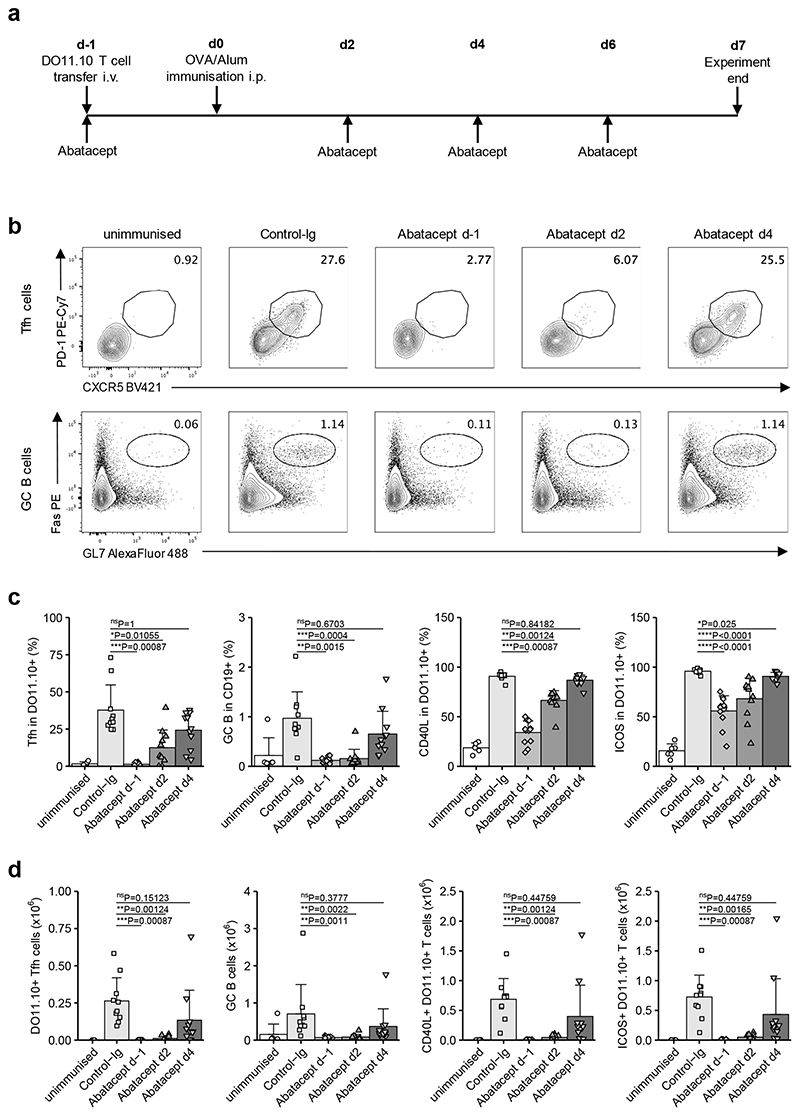
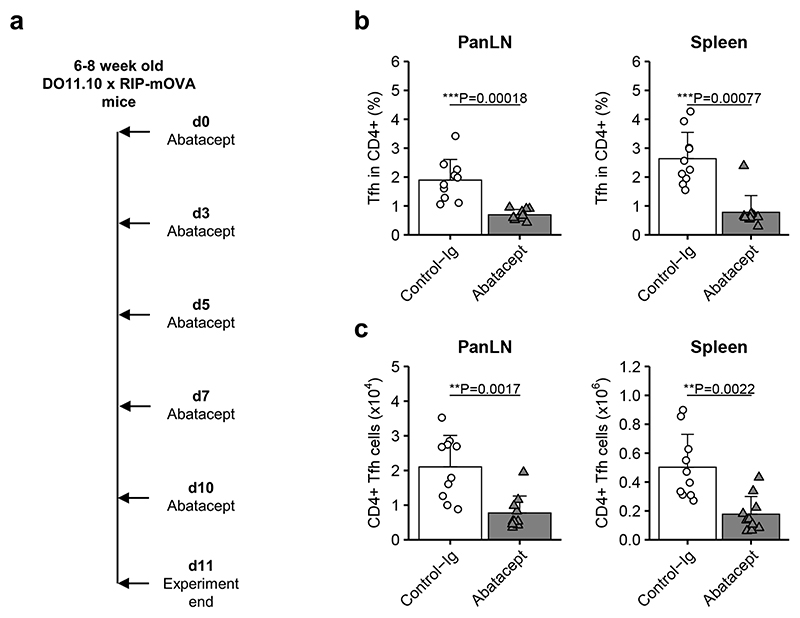
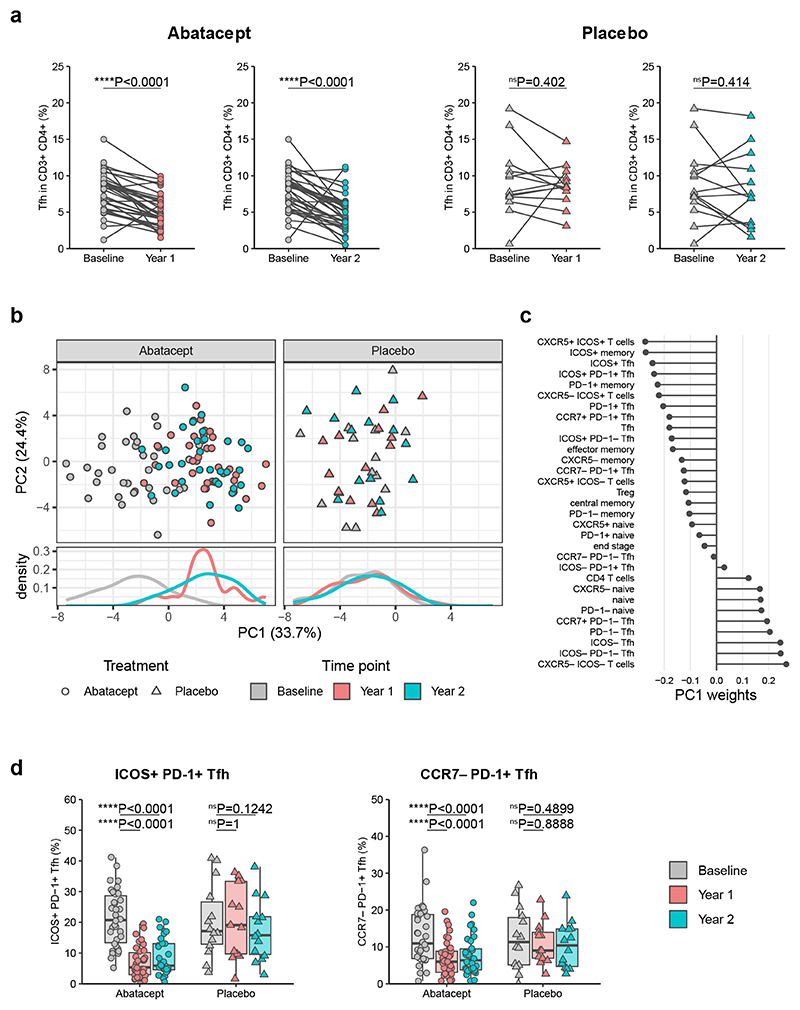
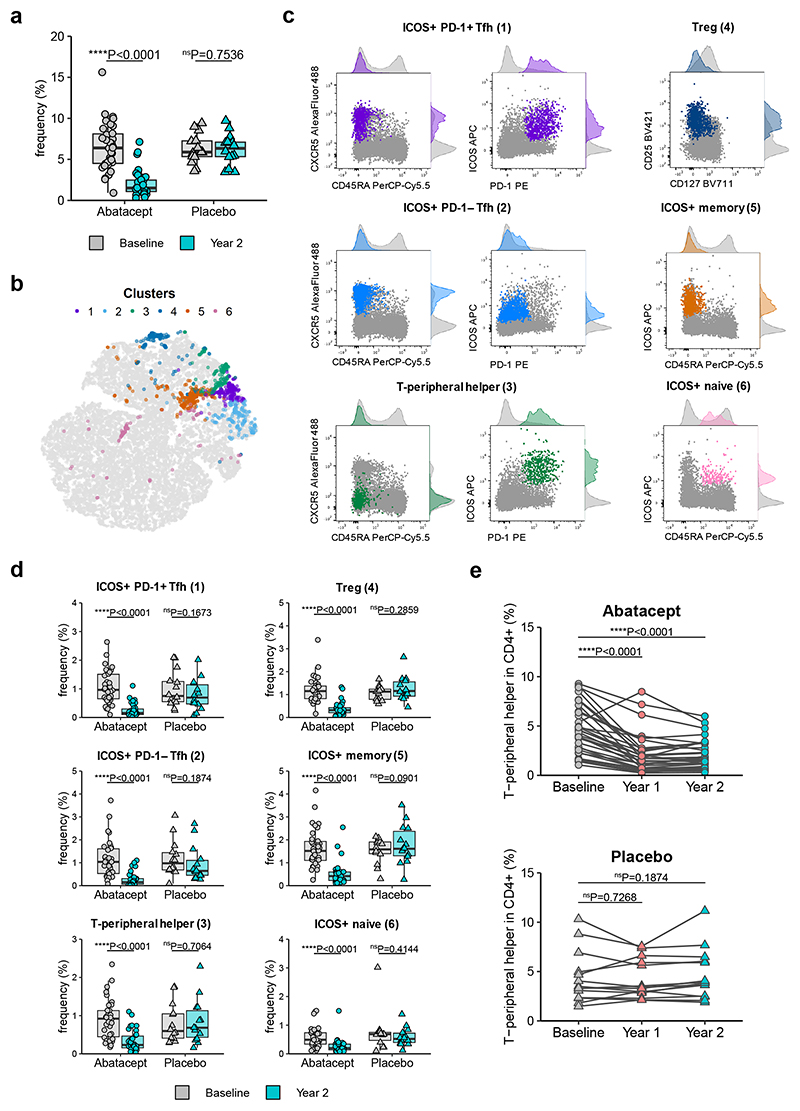
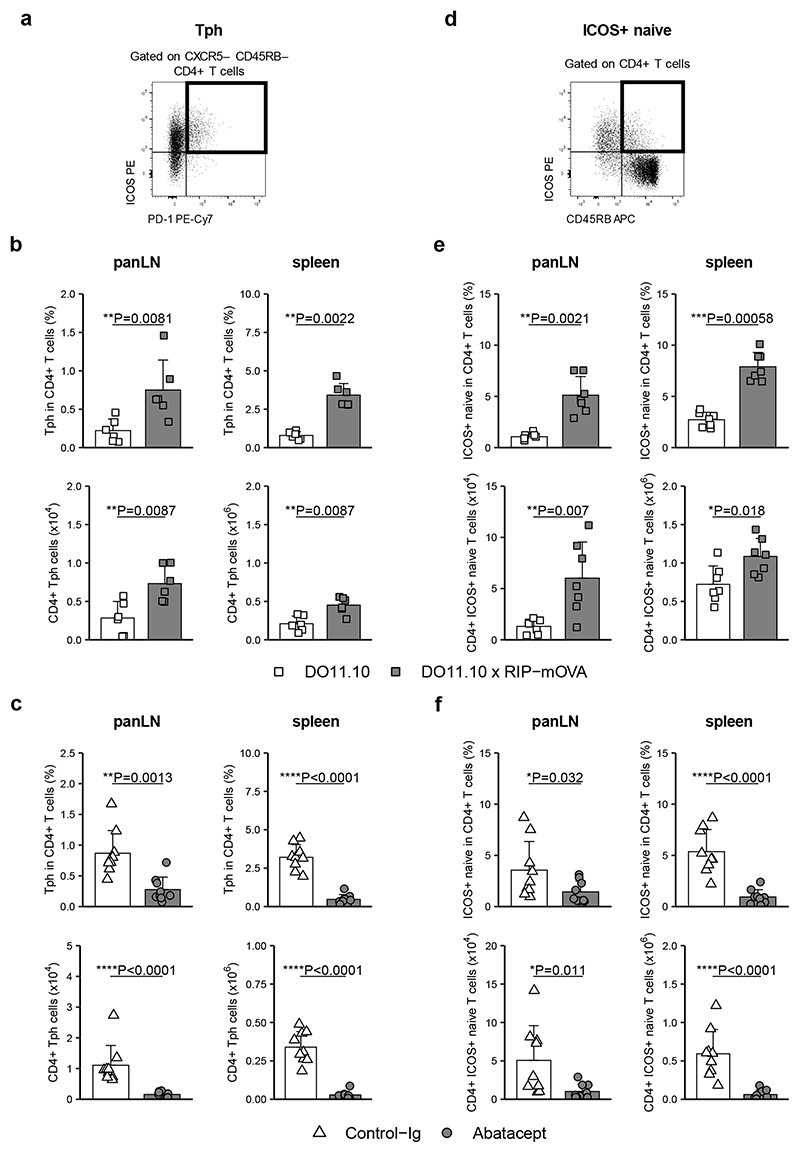
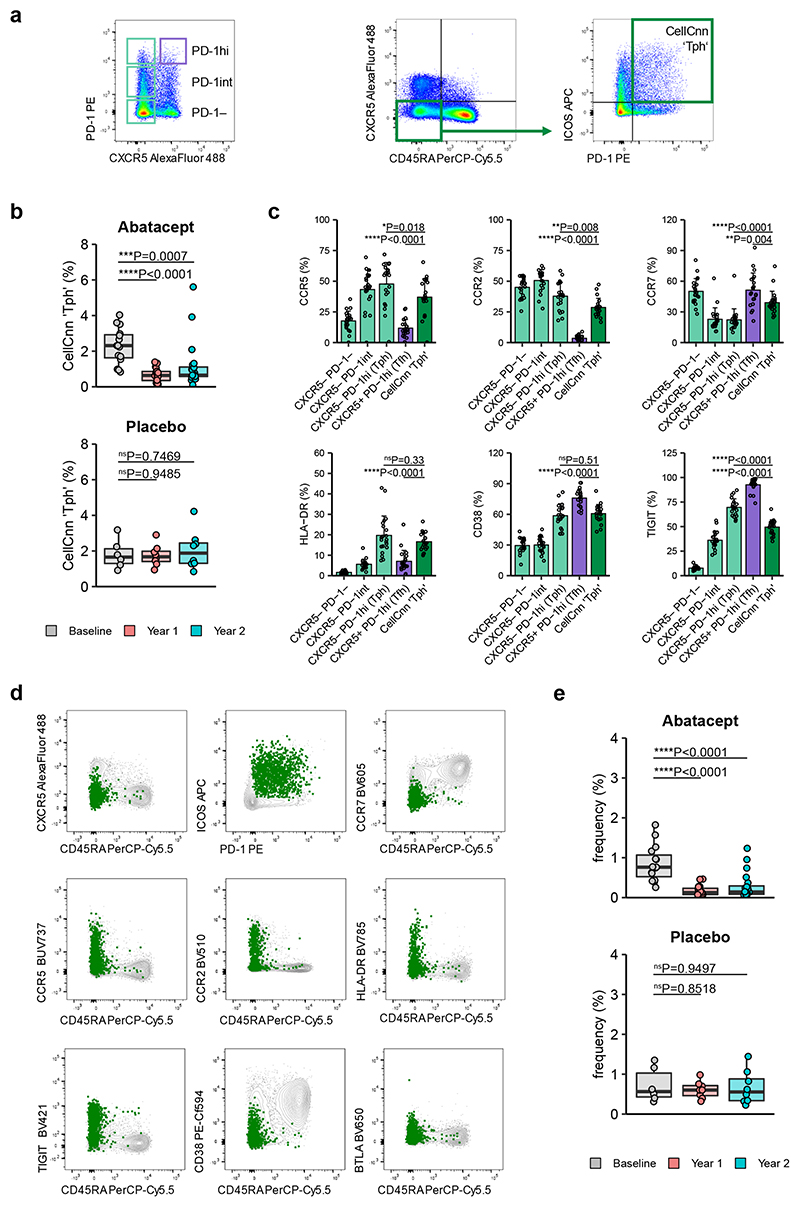
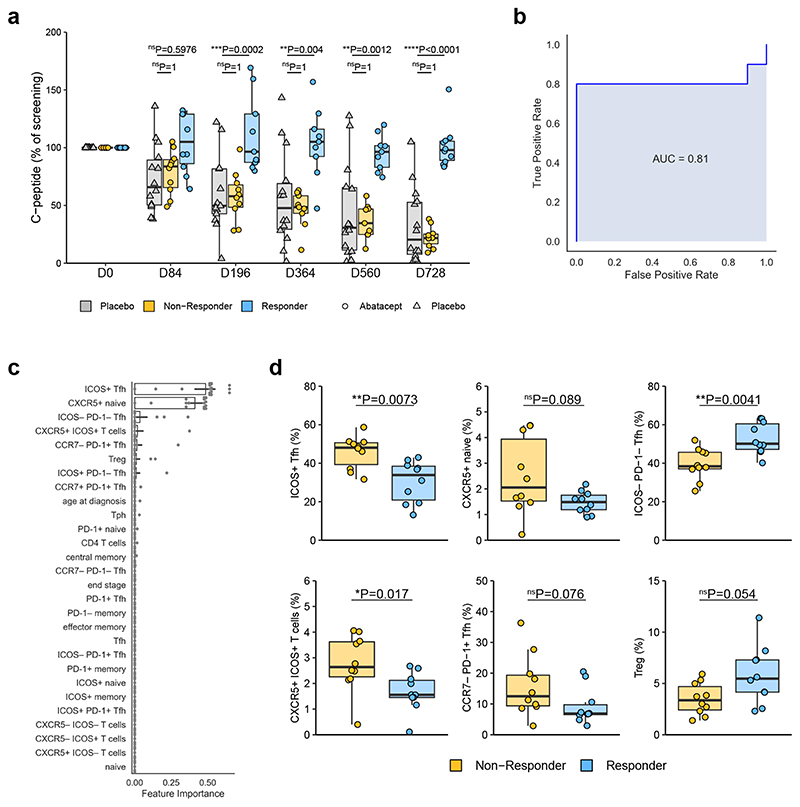
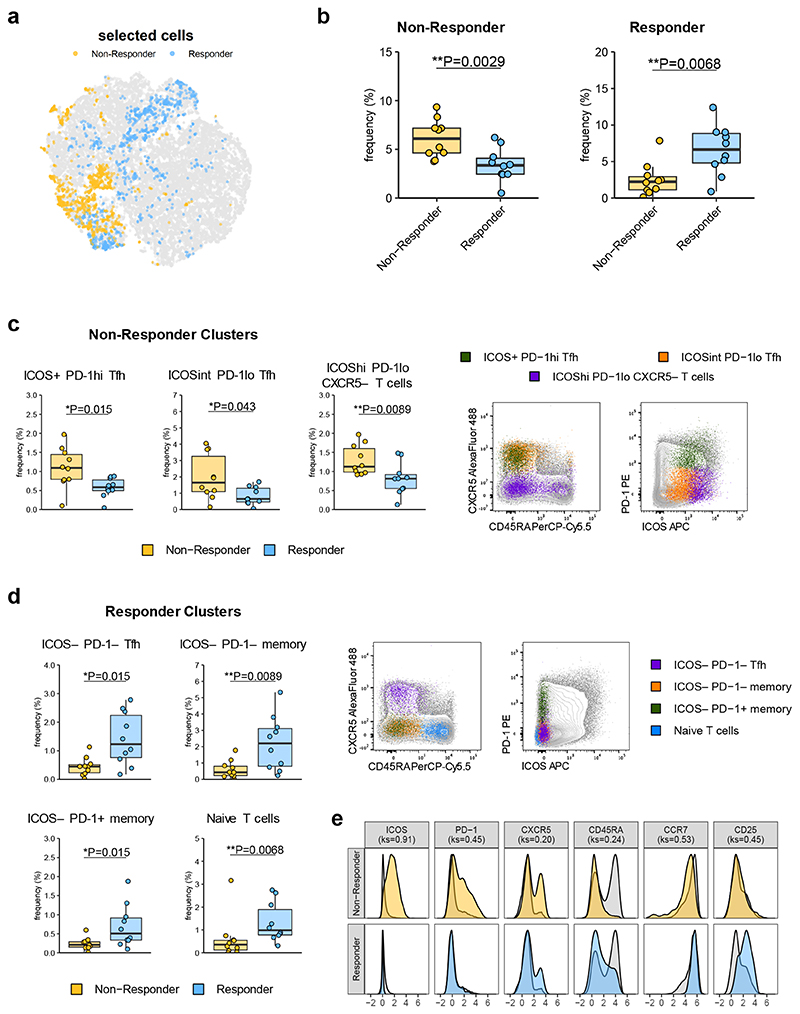
Follicular helper T (TFH) cells are implicated in type 1 diabetes (T1D), and their development has been linked to CD28 costimulation. We tested whether TFH cells were decreased by costimulation blockade using the CTLA-4-immunoglobulin (Ig) fusion protein (abatacept) in a mouse model of diabetes and in individuals with new-onset T1D. Unbiased bioinformatics analysis identified that inducible costimulatory molecule (ICOS)+ TFH cells and other ICOS+ populations, including peripheral helper T cells, were highly sensitive to costimulation blockade. We used pretreatment TFH profiles to derive a model that could predict clinical response to abatacept in individuals with T1D. Using two independent approaches, we demonstrated that higher frequencies of ICOS+ TFH cells at baseline were associated with a poor clinical response following abatacept administration. Therefore, TFH analysis may represent a new stratification tool, permitting the identification of individuals most likely to benefit from costimulation blockade.


Conflict of interest statement

Competing interests

AstraZeneca plc contributed to the funding of the study. P.A. and L.J. declare an interest in developing costimulation blockade reagents at AstraZeneca plc. L.S.K.W. and N.T. are inventors on a patent application related to these findings.

Figures

Figure 1
Figure 1. Time-sensitive inhibition of Tfh by Abatacept in immunised mice
DO11.10 T cells (2 x 10) were injected i.v. into Cd28−/− mice that were immunised i.p. with 200 μg of OVA/alum 24 h later. Abatacept or Control-Ig were administered i.p. every two to three days starting at the indicated time points. Control-Ig treatment was initiated at d-1. At day 7 after immunisation, spleens were harvested for analysis. (a) Representation of treatment scheme. (b) Representative flow cytometry plots for CXCR5+PD-1+ Tfh cells in gated CD4+DO11.10+ cells (top) and Fas+GL7+ GC B cells in gated CD19+ cells (bottom). (c) Collated data for Tfh cells, GC B cells, and CD40L and ICOS frequencies in gated CD4+DO11.10+ cells. (d) Collated data for absolute numbers of DO11.10+ Tfh, GC B cells, CD40L+CD4+DO11.10+ cells and ICOS+CD4+DO11.10+ cells. Data are compiled from five independent experiments; n=6 mice unimmunised, 10 mice Control-Ig, 12 mice Abatacept d-1, 11 mice each Abatacept d2 and Abatacept d4. Mean + SD are shown. (c) and (d) Kruskal-Wallis test for multiple comparisons followed by pairwise two-tailed Mann-Whitney U test with Bonferroni correction; ****, p < 0.0001; ***, p < 0.001; **, p < 0.01; *, p < 0.05; ns, not significant.
Figure 2
Figure 2. Abatacept decreases Tfh during an ongoing autoimmune response in mice
Abatacept or Control-Ig were injected every two to three days i.p. into 6-8 week old DO11.10 x RIP-mOVA mice. At day 11, pancreas-draining lymph nodes (panLN) and spleens were harvested for analysis. (a) Representation of treatment scheme. (b,c) Collated data for frequencies (b) and absolute numbers (c) of Tfh cells in gated CD4+ cells. Data are compiled from two independent experiments; n=10 mice in each treatment group. Mean + SD are shown. Two-tailed Mann-Whitney U test; ***, p < 0.001; **, p < 0.01.
Figure 3
Figure 3. Abatacept decreases Tfh in patients with new onset type 1 diabetes
Frozen PBMC samples from patients with recent onset T1D that received Abatacept or placebo were thawed and stained for flow cytometry analysis. Samples were taken at baseline, one year and two years after treatment initiation. (a) Collated data for Tfh (CD45RACXCR5+) frequencies in CD3+CD4+ cells from recipients of Abatacept (left) or placebo (right). (b) Principal component analysis on population frequencies obtained from flow cytometry analysis. Analysis was performed on all samples simultaneously and split into treatment groups for visualisation purposes. (c) Contributions of individual populations to PC1. (d) Collated data for ICOS+PD-1+ and CCR7PD-1+ frequencies in CD4+CD45RACXCR5+ cells. Shown are boxplots with black horizontal line denoting median value, while box represents interquartile ranges (IQR, Q1-Q3 percentile) and whiskers show minimum (Q1– 1.5 * IQR) and maximum (Q3 + 1.5 * IQR) values. Abatacept, n = 34 patients; Placebo, n = 13 patients (Year 1) or 14 patients (Baseline and Year 2). Two-tailed Wilcoxon signed-rank test; ****, p < 0.0001; ns, not significant.
Figure 4
Figure 4. Data-driven analysis reveals additional Abatacept-sensitive populations in type 1 diabetes patients
CellCnn analysis followed by k-means clustering of filter-specific cells was applied to flow cytometry data of samples taken at baseline and two years after Abatacept or placebo treatment initiation. (a) Frequency of filter specific cells in each analysed sample. (b) t-SNE projection of down-sampled, pooled flow cytometry data of all samples used for CellCnn analysis. K-means clusters of filter-specific cells are highlighted. (c) Representative flow cytometry overlays of cluster-specific cells (colour) on original flow cytometry data (grey). Examples shown are from a baseline sample. (d) Frequency of cluster-specific cells in each analysed sample. (e) Collated data for frequency of manually gated T-peripheral helper cells (ICOS+PD-1+CXCR5CD45RA in CD4+CD3+). Abatacept, n = 34 patients; Placebo, n = 13 patients (Year 1) or 14 patients (Baseline and Year 2). In (a) and (d) boxplots are shown with black horizontal line denoting median value, while box represents interquartile ranges (IQR, Q1-Q3 percentile) and whiskers show minimum (Q1– 1.5 * IQR) and maximum (Q3 + 1.5 * IQR) values. Two-tailed Wilcoxon signed-rank test; ****, p < 0.0001; ns, not significant.
Figure 5
Figure 5. “Tph” and “ICOS+ naive” cells are elevated in a mouse model of diabetes and sensitive to costimulation blockade
Cells isolated from panLN and spleens were stained with a panel of markers to identify Tph (CD4+CD45RBCXCR5ICOS+PD-1+) and ICOS+ naive T cells (CD4+CD45RB+ICOS+). Representative flow cytometry plots for gating strategy of Tph (a) and ICOS+ naive T cells (d) in spleen. Collated data for frequencies (top) and absolute numbers (bottom) of Tph (b) and ICOS+ naive T cells (e) in panLN (left) and spleen (right) of DO11.10 and DO11.10 x RIP-mOVA mice. (c,f) DO11.10 x RIP-mOVA mice were treated with Abatacept and Control-Ig according to treatment scheme depicted in Fig. 2a. Shown are collated data for frequencies (top) and absolute numbers (bottom) of Tph (c) and ICOS+ naive T cells (f) in panLN (left) and spleen (right). Data are compiled from 2 (c, f), 3 (b) or 4 (e) independent experiments; n=6 (b), 7 (e) or 9 (c, f) mice. Mean + SD are shown. Two-tailed Mann-Whitney U test; ****, p < 0.0001; ***, p < 0.001; **, p < 0.01; *, p < 0.05.
Figure 6
Figure 6. Tph cells identified through CellCnn display marker expression consistent with a Tph profile
Frozen PBMC samples from recent onset T1D patients that received Abatacept or placebo were thawed and analysed by flow cytometry for Tph and Tfh markers. (a) Representative gating strategy for CXCR5 vs PD-1 populations (left) and Tph previously identified through CellCnn analysis (right). (b) Collated data for frequency of cells in the CellCnn ‘Tph’ gate. (c) Expression of Tph markers on “Tph” identified by CellCnn compared with classically identified CXCR5PD1hi Tph gated as shown in (a). Data was obtained from baseline samples and shown are mean + SD. (d, e) CellCnn analysis of samples identifies a cluster of Tph-phenotype cells. Shown is expression of indicated markers within cluster (green) and all cells (grey) of representative sample (d) and frequency of cluster-specific cells in Abatacept- or Placebo-treated T1D patients (e). (b, e) Abatacept, n=15 (Baseline) or 20 (Year 1 and Year 2) patients; Placebo, n=6 (Baseline) or 8 (Year 1 and Year 2) patients; (c) n=21 patients. In (b) and (e) boxplots are shown with black horizontal line denoting median value, while box represents interquartile ranges (IQR, Q1-Q3 percentile) and whiskers show minimum (Q1– 1.5 * IQR) and maximum (Q3 + 1.5 * IQR) values. Two-tailed Mann-Whitney U test; ****, p < 0.0001; ***, p < 0.001; **, p < 0.01; *, p < 0.05; ns, not significant.
Figure 7
Figure 7. Baseline Tfh phenotype is associated with clinical response to Abatacept
(a) C-peptide AUC (as % of screening C-peptide AUC) of placebo treated and top 10 (at day 728) responder and non-responder Abatacept-treated patients. Responder, n=9 (D196, D364, D560) or 10 (all other time points) patients; Non-Responder, n=9 (D364, D560) or 10 (all other time points) patients; Placebo, n=13 (D196) or 14 (all other time points) patients. (b) A gradient boosting model was constructed using nested leave-one-out cross validation to predict clinical response following Abatacept treatment. ROC curve of the predictive model is shown. (c) Features ranked by importance for predicting clinical response following Abatacept treatment. Bar shows mean and black lines represent 95% confidence intervals, n=20 patients. (d) Frequencies of indicated flow cytometry gated populations at baseline (n=10 patients in each group). In (a) and (d) boxplots are shown with black horizontal line denoting median value, while box represents interquartile ranges (IQR, Q1-Q3 percentile) and whiskers show minimum (Q1– 1.5 * IQR) and maximum (Q3 + 1.5 * IQR) values. (a) Two-way ANOVA with Bonferroni correction; (d) Two-tailed Mann-Whitney U test; ****, p < 0.0001; ***, p < 0.001; **, p < 0.01; *, p < 0.05; ns, not significant.
Figure 8
Figure 8. Data-driven analysis identifies cell signatures linked to clinical response to Abatacept
CellCnn analysis followed by k-means clustering of filter-specific cells was applied to flow cytometry data of samples taken at baseline from top 10 responder and non-responder Abatacept treated patients. (a) t-SNE projection of down-sampled, pooled flow cytometry data of all samples used for CellCnn analysis. Filter-specific cells for responder and non-responder filter are highlighted. (b) Frequencies of filter-specific cells in each sample for responder and non-responder filter. (c) Frequencies and representative flow cytometry overlays for clusters found in non-responder filter-specific cells. (d) Frequencies and representative flow cytometry overlays for clusters found in responder filter-specific cells. (e) Histograms of marker expression of filter-specific cells (yellow; non-responder, blue; responder) or all cells (grey). n=10 patients in each group. In (b), (c) and (d) boxplots are shown with black horizontal line denoting median value, while box represents interquartile ranges (IQR, Q1-Q3 percentile) and whiskers show minimum (Q1– 1.5 * IQR) and maximum (Q3 + 1.5 * IQR) values. (b), (c) and (d) two-tailed Mann–Whitney U test; (e) two-tailed Kolmogorov-Smirnov (ks) test; **, p < 0.01; *, p < 0.05. All representative overlay plots are from the same baseline sample.

Comment in

References

    1. Blair HA, Deeks ED. Abatacept: A Review in Rheumatoid Arthritis. Drugs. 2017;77:1221–1233. - PubMed
    1. Mease PJ, et al. Efficacy and safety of abatacept, a T-cell modulator, in a randomised, double-blind, placebo-controlled, phase III study in psoriatic arthritis. Ann Rheum Dis. 2017;76:1550–1558. - PMC - PubMed
    1. Brunner HI, et al. Subcutaneous Abatacept in Patients With Polyarticular-Course Juvenile Idiopathic Arthritis: Results From a Phase III Open-Label Study. Arthritis & rheumatology. 2018;70:1144–1154. - PMC - PubMed
    1. Lenschow DJ, et al. Differential effects of anti-B7-1 and anti-B7-2 monoclonal antibody treatment on the development of diabetes in the nonobese diabetic mouse. The Journal of experimental medicine. 1995;181:1145–1155. - PMC - PubMed
    1. Orban T, et al. Co-stimulation modulation with abatacept in patients with recent-onset type 1 diabetes: a randomised, double-blind, placebo-controlled trial. Lancet. 2011;378:412–419. - PMC - PubMed

Publication types

MeSH terms