. 2020 Oct;26(10):1549-1556.
doi: 10.1038/s41591-020-1008-z. Epub 2020 Aug 3.

Implications of TP53 allelic state for genome stability, clinical presentation and outcomes in myelodysplastic syndromes

Elsa Bernard  1   2 Yasuhito Nannya  3 Robert P Hasserjian  4 Sean M Devlin  5 Heinz Tuechler  6 Juan S Medina-Martinez  1   2 Tetsuichi Yoshizato  3 Yusuke Shiozawa  3 Ryunosuke Saiki  3 Luca Malcovati  7   8 Max F Levine  1   2 Juan E Arango  1   2 Yangyu Zhou  1   2 Francesc Solé  9 Catherine A Cargo  10 Detlef Haase  11 Maria Creignou  12 Ulrich Germing  13 Yanming Zhang  14 Gunes Gundem  1 Araxe Sarian  2 Arjan A van de Loosdrecht  15 Martin Jädersten  12 Magnus Tobiasson  12 Olivier Kosmider  16 Matilde Y Follo  17 Felicitas Thol  18 Ronald F Pinheiro  19 Valeria Santini  20 Ioannis Kotsianidis  21 Jacqueline Boultwood  22 Fabio P S Santos  23 Julie Schanz  11 Senji Kasahara  24 Takayuki Ishikawa  25 Hisashi Tsurumi  26 Akifumi Takaori-Kondo  27 Toru Kiguchi  28 Chantana Polprasert  29 John M Bennett  30 Virginia M Klimek  31 Michael R Savona  32 Monika Belickova  33 Christina Ganster  11 Laura Palomo  9 Guillermo Sanz  34   35 Lionel Ades  36 Matteo Giovanni Della Porta  37   38 Harold K Elias  31 Alexandra G Smith  39 Yesenia Werner  1 Minal Patel  2 Agnès Viale  40 Katelynd Vanness  40 Donna S Neuberg  41 Kristen E Stevenson  41 Kamal Menghrajani  31 Kelly L Bolton  31 Pierre Fenaux  36 Andrea Pellagatti  22 Uwe Platzbecker  42 Michael Heuser  18 Peter Valent  43 Shigeru Chiba  44 Yasushi Miyazaki  45 Carlo Finelli  46 Maria Teresa Voso  47 Lee-Yung Shih  48 Michaela Fontenay  16 Joop H Jansen  49 José Cervera  50 Yoshiko Atsuta  51 Norbert Gattermann  13 Benjamin L Ebert  52 Rafael Bejar  53 Peter L Greenberg  54 Mario Cazzola  7   8 Eva Hellström-Lindberg  12 Seishi Ogawa  3 Elli Papaemmanuil  55   56
Affiliations

Implications of TP53 allelic state for genome stability, clinical presentation and outcomes in myelodysplastic syndromes

Elsa Bernard et al. Nat Med. 2020 Oct.

Erratum in

  • Author Correction: Implications of TP53 allelic state for genome stability, clinical presentation and outcomes in myelodysplastic syndromes.
    Bernard E, Nannya Y, Hasserjian RP, Devlin SM, Tuechler H, Medina-Martinez JS, Yoshizato T, Shiozawa Y, Saiki R, Malcovati L, Levine MF, Arango JE, Zhou Y, Solé F, Cargo CA, Haase D, Creignou M, Germing U, Zhang Y, Gundem G, Sarian A, van de Loosdrecht AA, Jädersten M, Tobiasson M, Kosmider O, Follo MY, Thol F, Pinheiro RF, Santini V, Kotsianidis I, Boultwood J, Santos FPS, Schanz J, Kasahara S, Ishikawa T, Tsurumi H, Takaori-Kondo A, Kiguchi T, Polprasert C, Bennett JM, Klimek VM, Savona MR, Belickova M, Ganster C, Palomo L, Sanz G, Ades L, Della Porta MG, Smith AG, Werner Y, Patel M, Viale A, Vanness K, Neuberg DS, Stevenson KE, Menghrajani K, Bolton KL, Fenaux P, Pellagatti A, Platzbecker U, Heuser M, Valent P, Chiba S, Miyazaki Y, Finelli C, Voso MT, Shih LY, Fontenay M, Jansen JH, Cervera J, Atsuta Y, Gattermann N, Ebert BL, Bejar R, Greenberg PL, Cazzola M, Hellström-Lindberg E, Ogawa S, Papaemmanuil E. Bernard E, et al. Nat Med. 2021 Mar;27(3):562. doi: 10.1038/s41591-021-01253-5. Nat Med. 2021. PMID: 33564192 No abstract available.
  • Author Correction: Implications of TP53 allelic state for genome stability, clinical presentation and outcomes in myelodysplastic syndromes.
    Bernard E, Nannya Y, Hasserjian RP, Devlin SM, Tuechler H, Medina-Martinez JS, Yoshizato T, Shiozawa Y, Saiki R, Malcovati L, Levine MF, Arango JE, Zhou Y, Solé F, Cargo CA, Haase D, Creignou M, Germing U, Zhang Y, Gundem G, Sarian A, van de Loosdrecht AA, Jädersten M, Tobiasson M, Kosmider O, Follo MY, Thol F, Pinheiro RF, Santini V, Kotsianidis I, Boultwood J, Santos FPS, Schanz J, Kasahara S, Ishikawa T, Tsurumi H, Takaori-Kondo A, Kiguchi T, Polprasert C, Bennett JM, Klimek VM, Savona MR, Belickova M, Ganster C, Palomo L, Sanz G, Ades L, Della Porta MG, Elias HK, Smith AG, Werner Y, Patel M, Viale A, Vanness K, Neuberg DS, Stevenson KE, Menghrajani K, Bolton KL, Fenaux P, Pellagatti A, Platzbecker U, Heuser M, Valent P, Chiba S, Miyazaki Y, Finelli C, Voso MT, Shih LY, Fontenay M, Jansen JH, Cervera J, Atsuta Y, Gattermann N, Ebert BL, Bejar R, Greenberg PL, Cazzola M, Hellström-Lindberg E, Ogawa S, Papaemmanuil E. Bernard E, et al. Nat Med. 2021 May;27(5):927. doi: 10.1038/s41591-021-01367-w. Nat Med. 2021. PMID: 33948021 No abstract available.

Abstract

Tumor protein p53 (TP53) is the most frequently mutated gene in cancer1,2. In patients with myelodysplastic syndromes (MDS), TP53 mutations are associated with high-risk disease3,4, rapid transformation to acute myeloid leukemia (AML)5, resistance to conventional therapies6-8 and dismal outcomes9. Consistent with the tumor-suppressive role of TP53, patients harbor both mono- and biallelic mutations10. However, the biological and clinical implications of TP53 allelic state have not been fully investigated in MDS or any other cancer type. We analyzed 3,324 patients with MDS for TP53 mutations and allelic imbalances and delineated two subsets of patients with distinct phenotypes and outcomes. One-third of TP53-mutated patients had monoallelic mutations whereas two-thirds had multiple hits (multi-hit) consistent with biallelic targeting. Established associations with complex karyotype, few co-occurring mutations, high-risk presentation and poor outcomes were specific to multi-hit patients only. TP53 multi-hit state predicted risk of death and leukemic transformation independently of the Revised International Prognostic Scoring System (IPSS-R)11. Surprisingly, monoallelic patients did not differ from TP53 wild-type patients in outcomes and response to therapy. This study shows that consideration of TP53 allelic state is critical for diagnostic and prognostic precision in MDS as well as in future correlative studies of treatment response.


Conflict of interest statement

Competing interests

The authors declare the following competing interests.

Figures

Extended Data Fig. 1 |
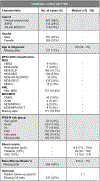
Extended Data Fig. 1 |. Study cohort characteristics.
Table describing the baseline characteristics of the study cohort. 1Q: first quartile; 3Q: third quartile; OS: overall survival; #: AML classification per WHO 2016 and previously RAEB-T cases. $: Median follow-up time is calculated for censored patients.
Extended Data Fig. 2 |
Extended Data Fig. 2 |. Validation cohort characteristics.
Table describing the baseline characteristics of the validation cohort. 1Q: first quartile; 3Q: third quartile; OS: overall survival; $: Median follow-up time is calculated for censored patients.
Extended Data Fig. 3 |
Extended Data Fig. 3 |. Landscape of chromosomal aberrations in MDS.
a, Landscape of chromosomal arm-level aberrations across 3,324 patients. Aberrations include copy-neutral loss of heterozygosity (cnloh), deletion (del) and gain. Chromosomes or chromosome arms with more than 5 aberrations are depicted on the x-axis. Aberrations were assessed using the integration of conventional G-banding analysis (CBA) data and NGS derived allele specific copy-number profiles (see Methods). NGS aberrant segments were restricted to segments larger than 3 megabases. b, Frequency distribution of chromosomal aberrations ordered by type of aberrations. First top three plots represent arm-level copy-neutral loss of heterozygosity (cnloh), deletion (del) and gain. Fourth bottom plot represents other types of aberrations to include the presence of marker chromosome (mar), rearrangements where r_i_j denotes a rearrangement between chromosome i and j, isochromosome 17q (iso17q), whole genome amplification (WGA) and presence of ring chromosome (ring). All aberrations observed in more than 3 patients are depicted. Of note, cnloh is detectable with NGS but not with CBA. On the opposite, rearrangements, presence of marker or ring chromosome and WGA were only assessed from CBA data. In 393 cases with missing CBA data, those specific aberrations were imputed from other molecular markers.
Extended Data Fig. 4 |
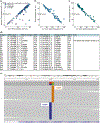
Extended Data Fig. 4 |. Evidence of biallelic TP53 targeting in the cases with multiple TP53 hits.
a, Scatter plot of the two maximum TP53 variant allele frequency (VAF) values from cases with multiple TP53 mutations and no copy-neutral LOH or deletion at TP53 locus (n=90). Points are annotated according to the level of information of the mutation pairs. In 67% (n=60) of pairs the sum of the two VAFs exceeded 50% so that the mutations were considered to be in the same cells as per the pigeonhole principle (triangle and diamond points). In 18 cases, the genomic distance between two mutations was within sequencing read length and it was therefore possible to phase the mutations. In all those cases the mutations were observed to be unphased, that is, in trans (square and diamond points). Within those 18 pairs of unphased mutations, 10 pairs had a sum of VAFs above 50%, that is, mutations were necessarily on different alleles and in the same cells, implying biallelic targeting (diamond points). b, c, Scatter plots of the VAF of TP53 mutations and minor allele frequency of 17p heterozygous SNPs from cases with one TP53 mutation and 17p deletion (b., n=69) or 17p copy-neutral LOH (c., n=61). The high correlations in (a.), (b.) and (c.) (R2 of 0.77, 0. 94 and 0.97, respectively) are indicative of biallelic targeting of TP53. d, Table of pairs of TP53 mutations from the same patients that could be phased. All pairs were in trans, that is, mutations were supported by different alleles. e, Representative IGV example of unphased mutations (patient p12 from table (d.)).
Extended Data Fig. 5 |
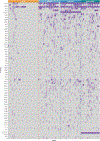
Extended Data Fig. 5 |. Heatmap of chromosomal aberrations per TP53 allelic state.
Each column represents a patient from the TP53 subgroups of monoallelic mutation (top orange band, 1mut), multiple mutations (top light blue band, >1mut), mutation(s) and deletion (top blue band, mut+del) and mutation(s) and copy-neutral loss of heterozygosity (top dark blue band, mut+cnloh). Aberrations observed at a frequency higher than 2% in either monoallelic or multi-hit TP53 state are depicted on the y-axis. Aberrations include from top to bottom the annotation of complex karyotype (complex), the presence of marker chromosome (mar), deletion (del), gain (plus), rearrangement (with r_i_j rearrangement between chromosome i and j), copy-neutral loss of heterozygosity (cnloh), whole genome amplification (WGA) and the presence of ring chromosome (ring). The deletions of 17p of two cases from the 1mut TP53 subgroup did not affect the TP53 locus.
xtended Data Fig. 6 |
xtended Data Fig. 6 |. TP53 allelic state segregates patient outcomes across WHO subtypes and IPSS-R risk groups.
a, Proportion of WHO subtypes per TP53 allelic state of monoallelic mutation (1mut) and multiple hits (multi). t-MDS: therapy-related MDS; SLD: single lineage dysplasia; RS: ring sideroblast; MLD: multiple lineage dysplasia; EB: excess blasts; AML-MRC: AML with myelodysplasia-related changes; U: unclassified. Multi-hit TP53 is enriched for t-MDS compared to monoallelic TP53 state (21% vs. 8%, OR=2.9, p=0.002 two-sided Fisher exact test) and for MDS-EB2 (31% vs. 13%, OR=3.1, p=5×10⁻⁵ two-sided Fisher exact test). Contrarily, monoallelic TP53 is enriched for MDS-del5q (15% vs. 2%, OR=8.4, p=6×10⁻⁶ two-sided Fisher exact test). b, Proportion of IPSS-R risk groups per TP53 allelic state. Multi-hit TP53 is strongly enriched for the very-poor category compared to monoallelic TP53 state (74% vs. 9%, OR=28, p=2×10⁻³⁵ two-sided Fisher exact test). c, Kaplan-Meier probability estimates of overall survival (OS) across main WHO subtypes per TP53 allelic state of wild-type TP53 (WT), monoallelic TP53 (1mut) and multiple TP53 hits (multi). WHO subtypes MDS-SLD and MDS-MLD are merged together as MDS-SLD/MLD and WHO subtypes MDS-EB1 and MDS-EB2 are merged together as MDS-EB1/2. d, Kaplan-Meier probability estimates of overall survival across IPSS-R risk groups per TP53 allelic state. IPSS-R very-good and good risk groups are merged together (leftmost panel), and IPSS-R very-poor and poor risk groups are merged together as well (rightmost panel). In (c.) and (d.), annotated p-values are from two-sided log-rank tests and numbers indicate cases with OS data per allelic state.
Extended Data Fig. 7 |
Extended Data Fig. 7 |. Outcomes across TP53 subgroups and VAF strata.
a, b, Kaplan-Meier probability estimates of overall survival (a.) and cumulative incidence of AML transformation (AMLt) (b.) across TP53 subgroups of wild-type TP53 (WT), single TP53 mutation (1mut), multiple TP53 mutations (>1mut), TP53 mutation(s) and deletion (mut+del), TP53 mutation(s) and copy-neutral loss of heterozygosity (mut+cnloh). c-d, Kaplan-Meier probability estimates of overall survival (c.) and cumulative incidence of AMLt (d.) per TP53 allelic state and range of variant allele frequency (VAF) of TP53 mutations. Annotated p-values are from two-sided log-rank tests in (a.) and (c.) and from two-sided Gray’s tests in (b.) and (d.). The number of cases with outcome data per group is indicated in parentheses.
Extended Data Fig. 8 |
Extended Data Fig. 8 |. Maintained differences in genome instability levels and outcomes between TP53 states per mutation type.
a, Proportion of different types of mutation per TP53 subgroup. Truncated mutations (pink) include frameshift indels, nonsense or nonstop mutations and splice-site variants. Mutations annotated as hotspot (purple) are missense mutations at amino acid positions 273, 248, 220 and 175. Mutations annotated as other-missense (green) are additional missense mutations or inframe indels. Odds ratio and two-sided Fisher’s test p-values for the proportion of truncated versus non-truncated mutations between the multi-hit TP53 subgroups and the monoallelic TP53 subgroup (1mut) are indicated on the right side. b, Number per patient of unique chromosomes other than 17 with aberrations per TP53 subgroup of single gene mutation (1mut), mutation and deletion (mut+del) and mutation and copy-neutral loss of heterozygosity (mut+cnloh) and across mutation types. Note that 5 patients with both several mutations and deletion or cnloh with ambiguity between the mutation type categories have been excluded for this analysis. The number of patients within each category is indicated in parentheses. In boxplots, the median is indicated by the tick horizontal line, and the first and third quartiles by the box edges. The lower and upper whiskers extend from the hinges to the smallest and largest values, respectively, no further than 1.5x the interquartile range from the hinges. Data beyond the whiskers are plotted individually as dots. The annotated p-values are derived from the two-sided Wilcoxon rank-sum test, each compared to the 1mut group within the same mutation type. c. Kaplan-Meier probability estimates of overall survival (OS) per TP53 subgroup across mutation types. Annotated p-values are from two-sided log-rank tests. The number of cases per subgroup with OS data is indicated in parentheses.
Extended Data Fig. 9 |
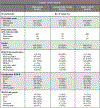
Extended Data Fig. 9 |. Characteristics of treated cohort subsets.
Table describing the baseline characteristics of the subset of patients that i) received hypomethylating agent (HMA), ii) received Lenalidomide in the context of del(5q) or iii) underwent hematopoietic stem cell transplantation (HSct).
Extended Data Fig. 10 |
Extended Data Fig. 10 |. Clinical workflow for the assessment of TP53 allelic state.
Schematic of a simple clinical workflow based on the number of TP53 mutations, the presence or absence of deletion 17p per cytogenetic analysis, and the presence or absence of cnLOH or focal deletion at 17p per NGS based assay or SNP array. Mutations were considered if VAF≥2%. VAF: variant allele frequency; CK: complex karyotype; OS: overall survival; AML: transformation to acute myeloid leukemia.
Fig. 1 |
Fig. 1 |. Integration of TP53 mutations and allelic imbalances at the TP53 locus identifies TP53 states with evidence of mono- or biallelic targeting.
a, Number of patients (from patients with any hit at the TP53 locus) with 0, 1, 2 or 3 TP53 mutations. Colors represent the status of chromosome 17 at the TP53 locus, to include cnLOH, deletion (del), isochromosome 17q rearrangement (iso17q), gain or no detected aberration (normal). Unbalanced translocations leading to 17p deletion are encoded as ‘del’. b, Frequency of TP53 subgroups within TP53-mutated patients. TP53 subgroups are defined as cases with (1) single gene mutation (1mut); (2) several mutations with normal status of chromosome 17 at the TP53 locus (>1mut); (3) mutation(s) and chromosomal deletion at the TP53 locus (mut + del); and (4) mutation(s) and cnLOH at the TP53 locus (mut + cnLOH). c, Density estimation of VAF of TP53 mutations across TP53 subgroups (from top to bottom, 1mut, >1mut, mut + del, mut + cnLOH). d, Distribution of TP53 mutations along the gene body. Mutations from patients with monoallelic TP53 are depicted at the top and those from patients with multiple TP53 hits at the bottom. Missense mutations are shown as green circles. Truncated mutations corresponding to nonsense or nonstop mutations, frameshift deletions or insertions and splice site variants are shown as pink circles. Other types of mutations to include in-frame deletions or insertions are shown as orange circles. TAD, transactivation domain; OD, oligomerization domain.
Fig. 2 |
Fig. 2 |. TP53 allelic state correlates with contrasting levels of genome stability and patterns of co-mutation.
a, Number of chromosomal aberrations per patient on chromosomes other than 17 across TP53 subgroups (1mut, >1mut, mut + del and mut + cnLOH, with 125, 90, 85 and 78 patients, respectively) and types of aberrations—rearrangement (rearr), gain or deletion (del). In all boxplots, the median is indicated by the horizontal line and the first and third quartiles by the box edges. The lower and upper whiskers extend from the hinges to the smallest and largest values, respectively, no further than 1.5× interquartile range from the hinges. ****P < 0.0001, two-sided Wilcoxon rank-sum test, each compared to the same aberration within the 1mut group. b, Number of unique chromosomes other than 17 affected by a chromosomal aberration (rearr, gain or del) per TP53 subgroup for 1mut (n = 125), >1mut (n = 90), mut + del (n = 85) and mut + cnLOH (n = 78). Dots represent the median across patients and lines extend from first to third quartiles. ****P < 0.0001, two-sided Wilcoxon rank-sum test, compared to the 1mut group. Wilcoxon W statistic= 9,950, 10,040 and 9,239 and P = 2 × 10⁻²², 2 × 10⁻²⁸ and 1 × 10⁻²⁷ for >1mut, mut + del and mut + cnLOH, respectively. c, Interaction between TP53 allelic state and complex karyotype; 13% (16/125) of monoallelic TP53 patients (1mut) had a complex karyotype and 91% (231/253) of multi-hit TP53 patients (multi) had a complex karyotype. d, Number of driver mutations on genes other than TP53 per TP53 subgroup of 1mut (n = 125), >1mut (n = 90), mut + del (n = 85) and mut + cnLOH (n = 78). Dots represent the median across patients and lines extend from first to third quartiles. ****P < 0.0001, two-sided Wilcoxon rank-sum test compared to the 1mut group. W = 8,515, 8,499 and 7,785 and P = 6 × 10⁻¹, 6 × 10⁻¹⁴ and 3 × 10⁻¹³ for >1mut, mut + del and mut + cnLOH, respectively e, Proportion of cases per TP53 allelic state with driver mutations in genes most frequently co-mutated with TP53. Genes mutated in at least 5% of monoallelic (n = 125) or multi-hit (n = 253) patients are represented. ***P < 0.001, **P < 0.01, *P < 0.05, two-sided Fisher’s exact test with Benjamini–Hochberg multiple testing correction.
Fig. 3 |
Fig. 3 |. TP53 allelic state associates with distinct clinical phenotypes and shapes patient outcomes.
a–d, boxplots indicating the levels of cytopenia, that is, hemoglobin (a), platelets (b), absolute neutrophil count (ANc) (c) and percentage of bone marrow blasts (d) per TP53 allelic state of wild-type TP53 (Wt, n = 2,922), monoallelic TP53 (1mut, n = 125) or multiple TP53 hits (multi, n = 253). In all boxplots, the median is indicated by the horizontal line and the first and third quartiles by the box edges. the lower and upper whiskers extend from the hinges to the smallest and largest values, respectively, no further than 1.5× interquartile range from the hinges. the y-axis values are square-rooted. ****P < 0.0001, ***P < 0.001, two-sided Wilcoxon rank-sum test. e,f, Kaplan–Meier probability estimates of overall survival (e) and cumulative AMLt (f) per TP53 allelic state. The numbers of cases with outcome data per allelic state are indicated in parentheses. P values are derived from two-sided log-rank and Gray’s tests. g, Results of cox proportional hazards regression for overall survival (OS) performed on 2,719 patients with complete data for OS and with 1,290 observed deaths. Explicative variables are hemoglobin, platelets, ANC, bone marrow blasts, cytogenetic IPSS-R risk scores (very good, good, intermediate (the reference), poor and very poor) and TP53 allelic state (monoallelic, multi-hit and wild-type is the reference). Hemoglobin, platelets, ANC and bone marrow blasts are scaled by their sample mean; age is scaled by a factor of 10; the x-axis is log10 scaled. Dots and lines represent the estimated hazard ratios and 95% confidence intervals (CI), respectively. ****P < 0.0001, ***P < 0.001, **P < 0.01, NS, not significant. P > 0.05, Wald test. h, Results of cause-specific Cox proportional hazards regression for AMLt performed on 2,464 patients with complete data for AMLt and with 411 observed transformations. Covariates are as in g. Dots and lines represent estimated hazard ratios and 95% CI, respectively. ****P < 0.0001, **P < 0.01, NS, not significant, P > 0.05, Wald test.
Fig. 4 |
Fig. 4 |. TP53 allelic state demarcates outcomes in therapy-related MDS and on different therapies.
a, Kaplan–Meier probability estimates of overall survival per TP53 allelic state of wild-type TP53 (WT), monoallelic TP53 (1mut) and multiple TP53 hits (multi), and across types of MDS, that is, de novo MDS (solid lines) or therapy-related MDS (dashed lines). Among de novo cases, 101 had a monoallelic TP53 mutation (solid orange line), 184 were multi-hit TP53 (solid blue line) and 2,552 were TP53 wild-type (solid gray line). Among therapy-related cases, ten had a monoallelic TP53 mutation (dashed orange line), 52 were multi-hit TP53 (dashed blue line) and 162 were TP53 wild-type (dashed gray line). Annotated P values are from two-sided log-rank tests. bd, Kaplan–Meier probability estimates of overall survival (OS) following commencement of treatment with HMA (b) or lenalidomide for patients with del(5q) (c) or HSct (d) per TP53 allelic state. OS was measured from the start of treatment or HSCT to the time of death from any cause. Patients alive at the last follow-up date were censored at that time. The number of cases with OS data per TP53 state is indicated in parentheses. Annotated P values are from two-sided log-rank tests.

Comment in

References

    1. Kandoth C et al. Mutational landscape and significance across 12 major cancer types. Nature 502, 333–339 (2013). - PMC - PubMed
    1. Zehir A et al. Mutational landscape of metastatic cancer revealed from prospective clinical sequencing of 10,000 patients. Nat. Med. 23, 703–713 (2017). - PMC - PubMed
    1. Haase D et al. TP53 mutation status divides myelodysplastic syndromes with complex karyotypes into distinct prognostic subgroups. Leukemia 33, 1747–1758 (2019). - PMC - PubMed
    1. Bejar R et al. Clinical effect of point mutations in myelodysplastic syndromes. N. Engl. J. Med. 364, 2496–2506 (2011). - PMC - PubMed
    1. Kitagawa M, Yoshida S, Kuwata T, Tanizawa T & Kamiyama R p53 expression in myeloid cells of myelodysplastic syndromes. Association with evolution of overt leukemia. Am. J. Pathol. 145, 338–344 (1994). - PMC - PubMed

Publication types

MeSH terms

Substances