. 2020 Aug 3;61(1):22.
doi: 10.1186/s40529-020-00299-x.

Investigation of the effects of P1 on HC-pro-mediated gene silencing suppression through genetics and omics approaches

Affiliations

Investigation of the effects of P1 on HC-pro-mediated gene silencing suppression through genetics and omics approaches

Sin-Fen Hu et al. Bot Stud. .

Abstract

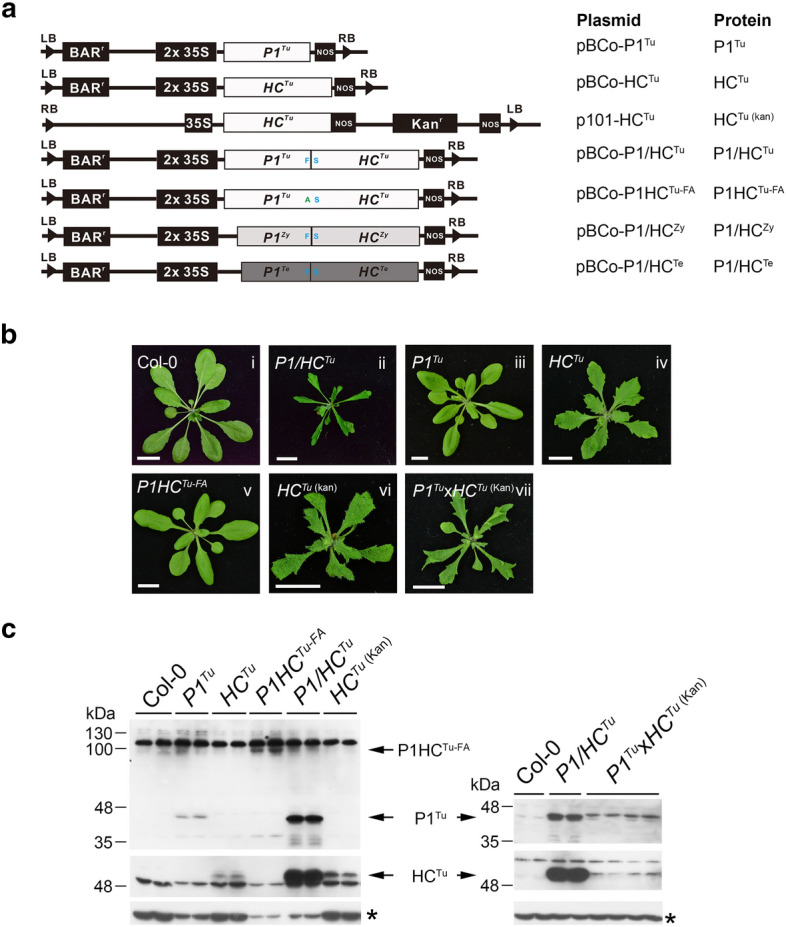
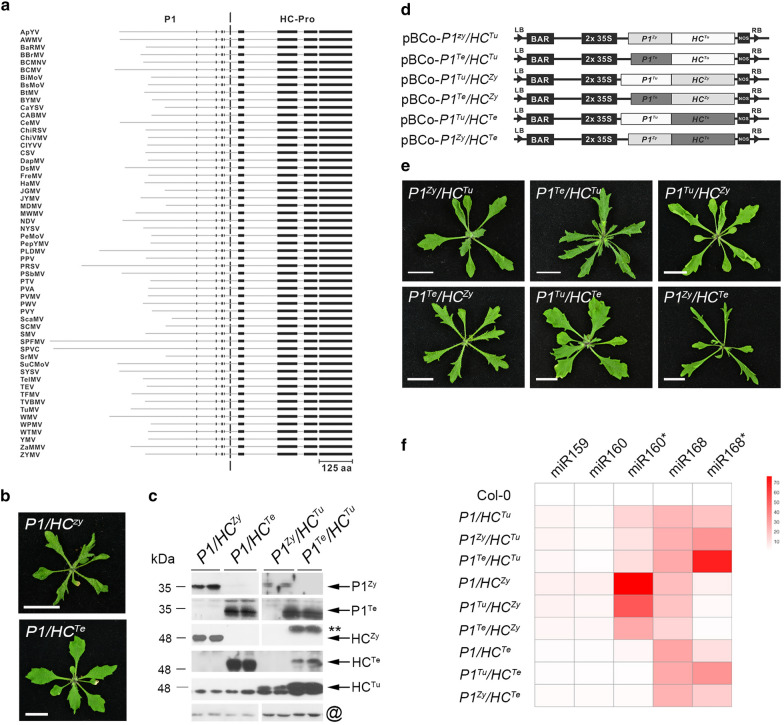
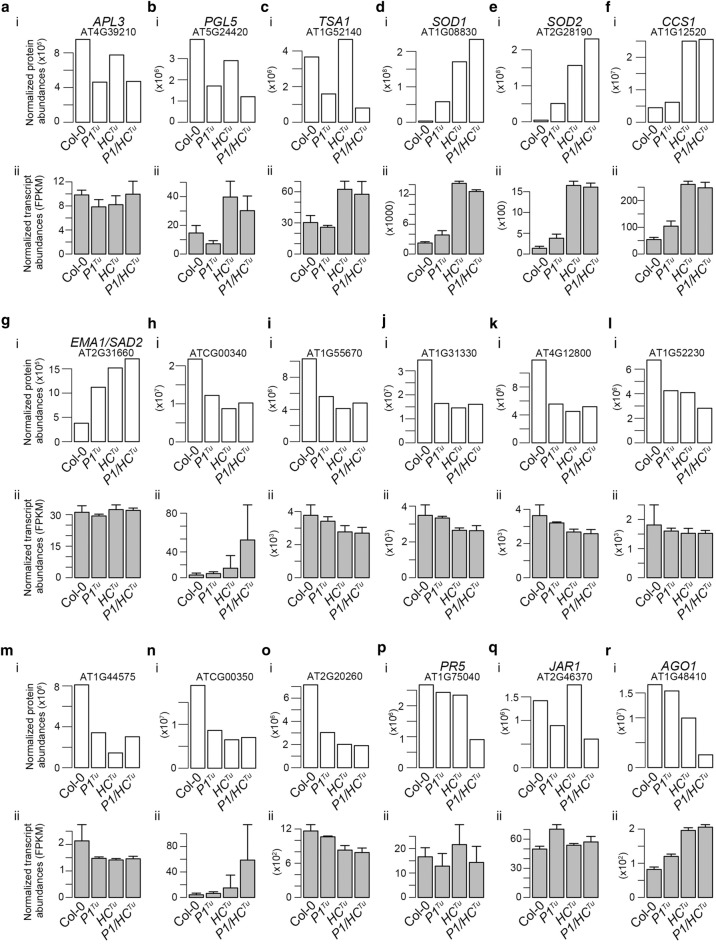
Background: Posttranscriptional gene silencing (PTGS) is one of the most important mechanisms for plants during viral infection. However, viruses have also developed viral suppressors to negatively control PTGS by inhibiting microRNA (miRNA) and short-interfering RNA (siRNA) regulation in plants. The first identified viral suppressor, P1/HC-Pro, is a fusion protein that was translated from potyviral RNA. Upon infecting plants, the P1 protein itself is released from HC-Pro by the self-cleaving activity of P1. P1 has an unknown function in enhancing HC-Pro-mediated PTGS suppression. We performed proteomics to identify P1-interacting proteins. We also performed transcriptomics that were generated from Col-0 and various P1/HC-Pro-related transgenic plants to identify novel genes. The results showed several novel genes were identified through the comparative network analysis that might be involved in P1/HC-Pro-mediated PTGS suppression.

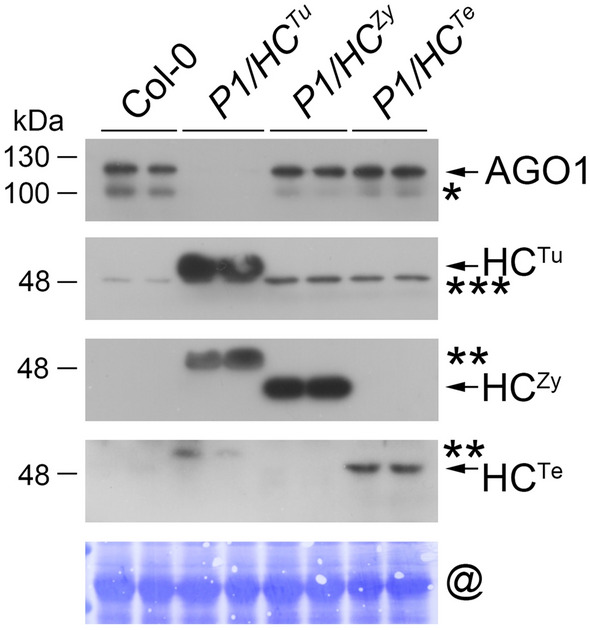
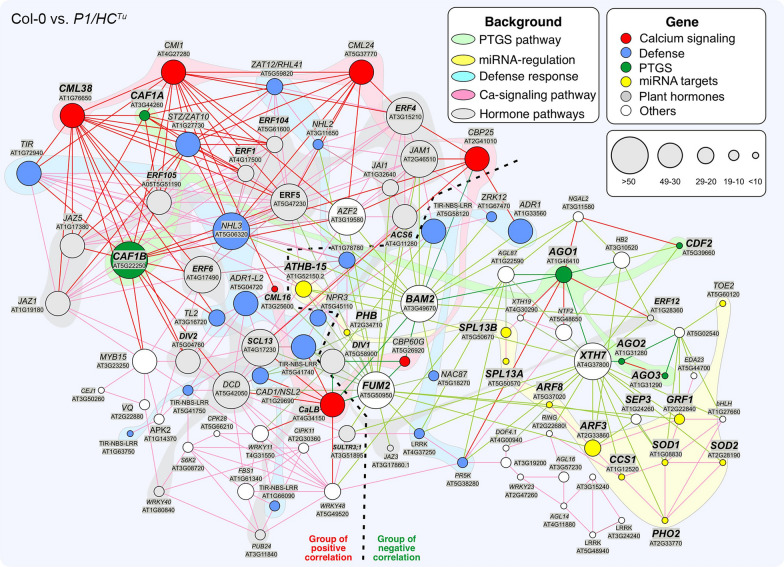
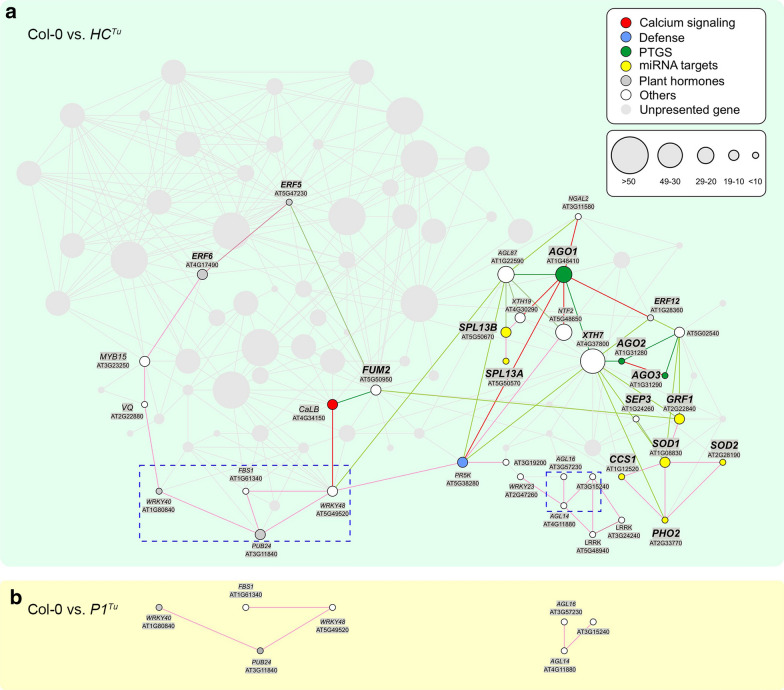
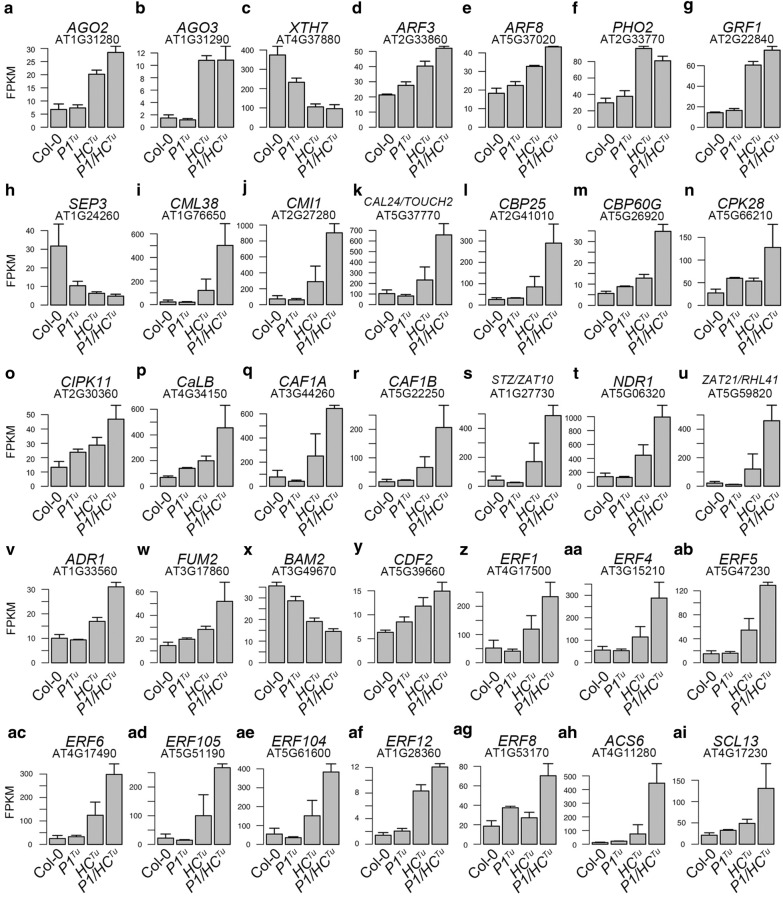
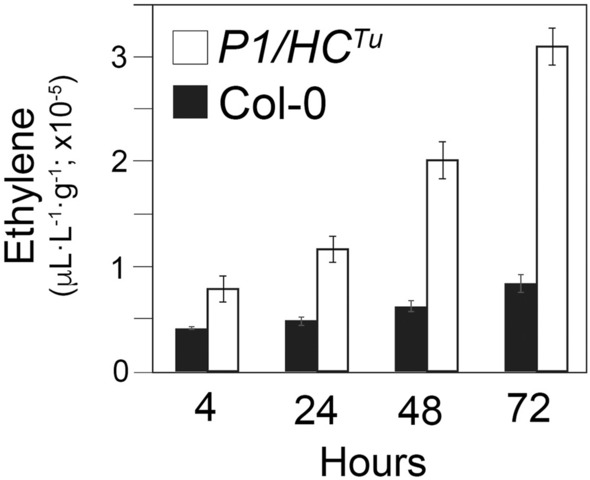
Results: First, we demonstrated that P1 enhances HC-Pro function and that the mechanism might work through P1 binding to VERNALIZATION INDEPENDENCE 3/SUPERKILLER 8 (VIP3/SKI8), a subunit of the exosome, to interfere with the 5'-fragment of the PTGS-cleaved RNA degradation product. Second, the AGO1 was specifically posttranslationally degraded in transgenic Arabidopsis expressing P1/HC-Pro of turnip mosaic virus (TuMV) (P1/HCTu plant). Third, the comparative network highlighted potentially critical genes in PTGS, including miRNA targets, calcium signaling, hormone (JA, ET, and ABA) signaling, and defense response.

Conclusion: Through these genetic and omics approaches, we revealed an overall perspective to identify many critical genes involved in PTGS. These new findings significantly impact in our understanding of P1/HC-Pro-mediated PTGS suppression.

Keywords: Comparative network; MicroRNA; Omics; P1/HC-Pro; Posttranscriptional gene silencing; Viral suppressor.


Conflict of interest statement

The authors declare that they have no competing interests.

Figures

Fig. 1
Fig. 1
P1 enhances the HCTu-mediated phenotype and HCTu suppression in miRNA-mediated regulation. a Schematic binary plasmids containing the various constructs that were used in this study. b Phenotypes of the different transgenic plants. The photographs were taken of 3-week-old seedlings. Bar, 1 cm. c Detection of P1 and HC-Pro of TuMV in various transgenic plants by western blotting. The asterisk (tubulin) is an internal control
Fig. 2
Fig. 2
Variation in potyvirus P1/HC-Pro and recombined P1/HC-Pro plants. a Schematic diagram of P1 and HC-Pro amino acid sequence similarity among fifty-seven Potyviruses. The black boxes indicate conserved sequence regions. b The morphologic phenotype of P1/HCZy and P1/HCTe plants. Bar, 1 cm. c. Detection of P1 and HC-Pro in P1/HCZy, P1/HCTe, P1Zy/HCTu, and P1Te/HCTu plants. The @ symbol indicates CDC2 as an internal control. Two-asterisk (**) indicate cross-reaction of the α-HCZy antibodies. d Schematic of the binary plasmids containing the various recombined P1/HC-Pro constructs used in this study. e Phenotypes of various recombinant P1/HC-Pro transgenic plants. The photographs were taken of 3-week-old seedlings. Bar, 1 cm. f Heatmap of abnormal miRNA and miRNA* accumulation in various recombinant P1/HC-Pro plants. The values of heatmap were convert from miRNA northern blot. Significant upregulation (Student’s t test; P value < 0.05) is labeled in red. Gray indicates differential expression that is not significant. The values on the right indicate the results of the log2 (each sample/Col-0) formula
Fig. 3
Fig. 3
Abnormal accumulation of miRNA/miRNA*s and target mRNAs. a Heatmaps of miRNA and miRNA* and b miRNA target gene expression in various transgenic plants. The values of heatmap for miRNA were convert from miRNA northern blot. The values of heatmap for target RNAs were convert from transcriptome profiles. Significant upregulation (Student’s t test; P value < 0.05) is labeled in red. Gray indicates differential expression that is not significant. The values on the right indicate the results of the log2 (each sample/Col-0) formula
Fig. 4
Fig. 4
The protein and transcript levels of critical genes in various transgenic plants. (a–r) Genes that had a significant difference in protein levels (panel ii) between Col-0 and P1/HCTu plants were identified and their transcript levels were observed (panel i) in Col-0, P1Tu, HCTu, and P1/HCTu plants. The fragments per kilobase of transcript per million (FPKM) were used to represent the normalized transcript expression. The bars represent standard deviations (n = 3). Normalized abundances were used to represent the protein amounts
Fig. 5
Fig. 5
AGO1 protein detection in different viral P1/HC-Pro transgenic Arabidopsis plants. One asterisk (*) indicates the AGO1 isoform. Two-asterisk (**) indicates cross-reaction of the α-HCZy or α-HCTe antibodies. Three-asterisk (***) indicates common bands. The @ symbol indicates RUBISCO as an internal control
Fig. 6
Fig. 6
The gene-to-gene network of Col-0 vs. P1/HCTu plants. The gene profiles of twofold DEGs between Col-0 and P1/HCTu plants were used to generate the Pearson correlation network. The different circle sizes indicate the numbers of correlated genes. A positive correlation (> 0.95) between the two genes is indicated by a red line, whereas a green line indicates a negative correlation (< −0.9). The red circles indicate the genes involved in calcium signaling and are grouped with a red background. The blue circles indicate the genes involved in the defense response and are grouped with a blue background. The green circles indicate the genes involved in the PTGS pathway and are grouped with a green background. The yellow circles indicate the genes that are the miRNA targets and are grouped with a yellow background. The gray circles indicate the genes involved in the JA, ABA, and ethylene biosynthesis pathways and are grouped with a gray background
Fig. 7
Fig. 7
The comparative networks for Col-0 vs. P1Tu and Col-0 vs. HCTu plants. a The gene profiles of twofold DEGs between Col-0 and HCTu plants were used to generate the Pearson correlation networks. b The gene profiles of twofold DEGs between Col-0 and P1Tu plants were used to generate the network. The different circle sizes indicate the number of correlated genes. A positive correlation (> 0.95) between the two genes is indicated by a red line, whereas a green line indicates a negative correlation (< −0.9). The unpresented genes and correlation lines are indicated in gray
Fig. 8
Fig. 8
Transcript expression comparisons of critical genes in the networks. (a-ai) Genes that showed a significant connection, function, or position in the network were selected to demonstrate their transcript expression. The fragments per kilobase of transcript per million (FPKM) were used to represent the normalized transcript expression. The bars represent standard deviations (n = 3)
Fig. 9
Fig. 9
Time courses of endogenous ethylene detection in Col-0 and P1/HCTu plants. The bars represent standard deviations (n = 3)

References

    1. Agudelo-Romero P, de la Iglesia F, Elena SF. The pleiotropic cost of host-specialization in Tobacco etch potyvirus. Infect Genet Evol. 2008;8:806–814. - PubMed
    1. Alazem M, He MH, Moffett P, Lin NS. Abscisic acid induces resistance against Bamboo mosaic virus through Argonaute2 and 3. Plant Physiol. 2017;174:339–355. - PMC - PubMed
    1. Anandalakshmi R, Pruss GJ, Ge X, Marathe R, Mallory AC, Smith TH, Vance VB. A viral suppressor of gene silencing in plants. Proc Natl Acad Sci USA. 1998;95:13079–13084. - PMC - PubMed
    1. Anandalakshmi R, Marathe R, Ge X, Herr JMJ, Mau C, Mallory A, Pruss G, Bowman L, Vance VB. A calmodulin-related protein that suppresses posttranscriptional gene silencing in plants. Science. 2000;290:142–144. - PubMed
    1. Bouché N. New insights into miR398 functions in Arabidopsis. Plant Signal Behav. 2010;5:684–686. - PMC - PubMed

LinkOut - more resources