. 2021 Apr;53(2):536-557.
doi: 10.3758/s13428-020-01452-x.

The Free-movement pattern Y-maze: A cross-species measure of working memory and executive function

Affiliations

The Free-movement pattern Y-maze: A cross-species measure of working memory and executive function

Madeleine Cleal et al. Behav Res Methods. 2021 Apr.

Abstract

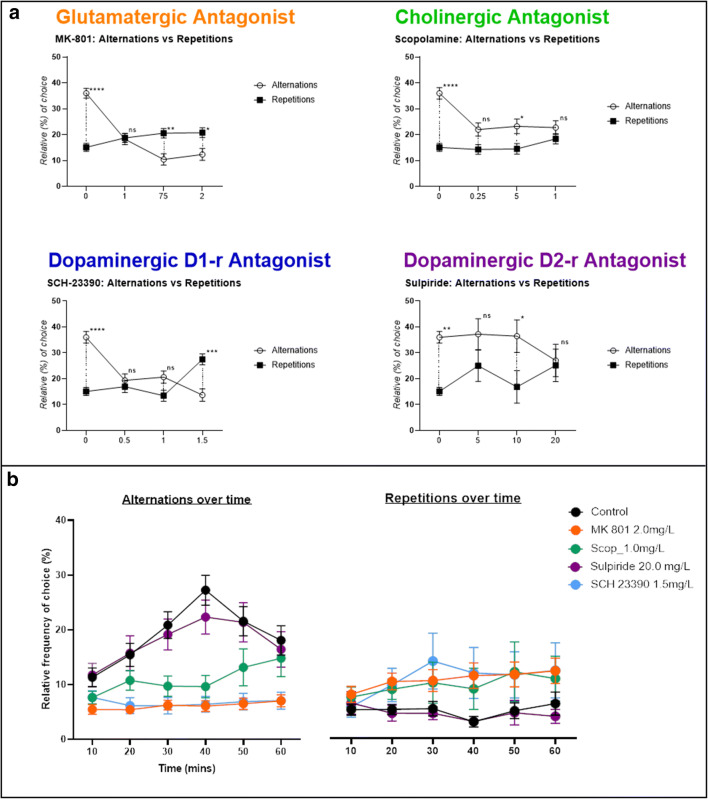
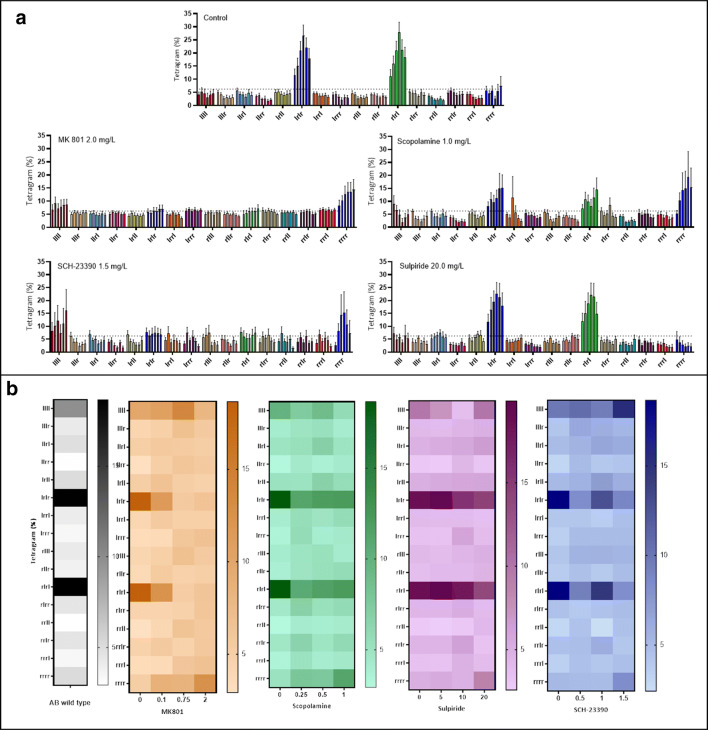
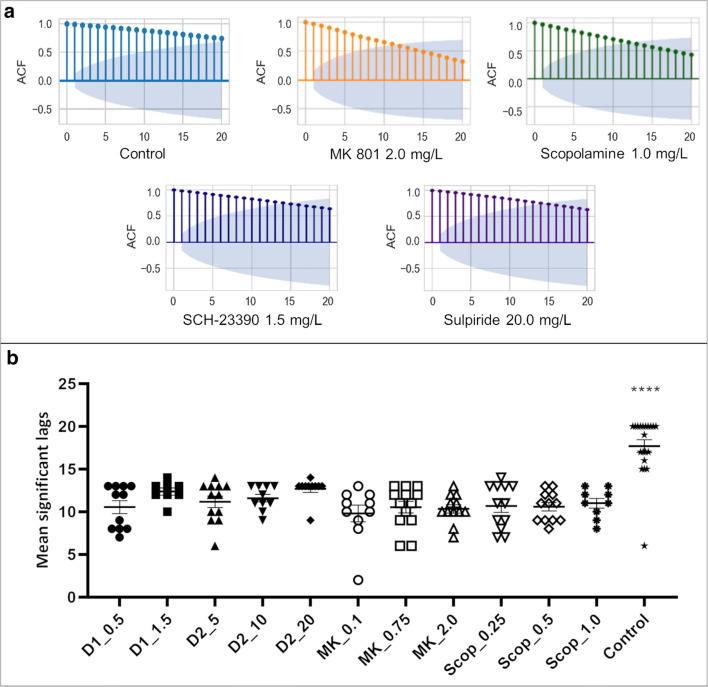
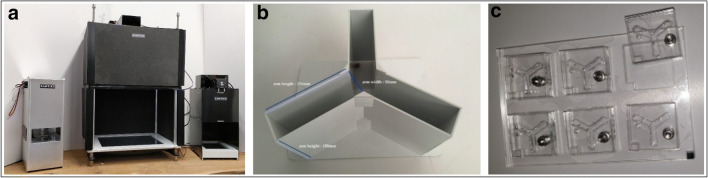
Numerous neurodegenerative and psychiatric disorders are associated with deficits in executive functions such as working memory and cognitive flexibility. Progress in developing effective treatments for disorders may benefit from targeting these cognitive impairments, the success of which is predicated on the development of animal models with validated behavioural assays. Zebrafish offer a promising model for studying complex brain disorders, but tasks assessing executive function are lacking. The Free-movement pattern (FMP) Y-maze combines aspects of the common Y-maze assay, which exploits the inherent motivation of an organism to explore an unknown environment, with analysis based on a series of sequential two-choice discriminations. We validate the task as a measure of working memory and executive function by comparing task performance parameters in adult zebrafish treated with a range of glutamatergic, cholinergic and dopaminergic drugs known to impair working memory and cognitive flexibility. We demonstrate the cross-species validity of the task by assessing performance parameters in adapted versions of the task for mice and Drosophila, and finally a virtual version in humans, and identify remarkable commonalities between vertebrate species' navigation of the maze. Together, our results demonstrate that the FMP Y-maze is a sensitive assay for assessing working memory and cognitive flexibility across species from invertebrates to humans, providing a simple and widely applicable behavioural assay with exceptional translational relevance.

Keywords: Drosophila; Executive function; FMP Y-maze; Translational research; Working memory; Zebrafish.


Figures

Fig. 1
Fig. 1
FMP Y-maze diagram depicting maze dimensions and zones used for automated logging of arm entries and exits
Fig. 2
Fig. 2
Aquatic FMP Y-maze for zebrafish. (a) Zantiks behavioural unit for automated animal tracking. (b) Top view of two FMP Y-mazes for zebrafish inserted into a black water-tight tank, L50:W20:H140 mm, filled with 3 L of aquarium water. A mesh lid was used to cover the top of the tank to prevent fish from jumping out during the trial without interfering with the tracking software. (c) In trial image of zebrafish in the FMP Y-maze (n = 2)
Fig. 3
Fig. 3
(Top) Frequency distribution of global tetragram strategy over the course of 1 h exploration in the FMP Y-maze (n = 18). The dashed line represents random selection at 6.25%. Dominant strategy uses alternations (LRLR, RLRL). (Bottom) Use of each tetragram sequence in 10-minute time bins, demonstrating a clear dominant use of alternations throughout the trial that fluctuate over time. Error bars represent mean ± SEM
Fig. 4
Fig. 4
Time series analysis of movement patterns of an individual zebrafish, zf11, (n = 1), showing, from left to right, time series plot of the cumulative sum of step lengths for n = 250 time points. Lag plot of data at lag-0 (ω(k)) and lag-1 (ω(k+1)) demonstrating a positive linear correlation. Autocorrelation function plot showing the first 20 lags of 250 lag plots. ACF show slow decay towards zero, with 18 lag points outside of the 95% C.I., depicted by the blue cone. ACF between data points is indicative of dependency between successive turn choices, demonstrating memory of previous events
Fig. 5
Fig. 5
Effects of three concentrations of (a) MK 801: control, n = 18; 0.1 mg/L, n = 13; 0.75 mg/L, n = 13; 2.0 mg/L, n = 13). (b) Scopolamine: control, n = 18; 0.25 mg/L, n = 13; 0.5 mg/L, n = 13; 1.0 mg/L, n = 13. (c) SCH-23390: control, n = 18; 0.5 mg/L, n = 12; 1.0 mg/L, n = 12; 1.5 mg/L, n = 12. (d) Sulpiride: control, n = 18; 5 mg/L, n = 12; 10 mg/L, n = 11; 20 mg/L, n = 11) on locomotor activity, in the form of total turns (left), percentage of repetitions used in the global strategy (middle) and the percentage of alternations used as part of the global strategy (right). Data were analysed using a GLMM with total turns as a covariate and ID as a random effect. Bars represent relative frequency of choice, error bars are mean ± SEM. *p < 0.05, **p < 0.01, ***p < 0.001, ****p < 0.0001 compared to control group
Fig. 6
Fig. 6
a Comparison of total alternations compared to total repetitions for control group (0), low, mid and high concentration of antagonist. Analysis was performed using a two-way ANOVA conducted on the whole data set for each drug treatment separately, followed by Šidák’s post hoc test applied to alternations × repetitions. b Change in total alternations (left) and repetitions (right) during 1 hour of exploration divided into 6 equal time bins of 10 minutes per bin. Graphs represent control group versus high concentration of each antagonist treated group. Data were analysed using GLMM. Error bars are mean ± SEM. *p < 0.05, **p < 0.01, ***p < 0.001, ****p < 0.0001, alternations compared to repetitions at each concentration
Fig. 7
Fig. 7
a Change in frequency distribution of each of the 16 tetragram sequences as a factor of time; each bar represents a 10-minute time bin. b Heat map of changes in global use of each tetragram sequence for each concentration of antagonist compared to control group
Fig. 8
Fig. 8
(Top) ACF plot showing the first 20 lags of 250-lag plots. Each plot shows slow decay towards zero, with 18 lag points outside of the 95% C.I., depicted by the blue cone. ACF plots are individual animal responses in the FMP Y-maze and are therefore representative of the control group and drug treatment groups exposed to the highest concentration of antagonist for MK 801, scopolamine, SCH-23390 and sulpiride, respectively. (Bottom) comparison of the mean significant lags of drug-treated groups at low, mid- and high concentrations compared to control group. Bars are mean, error bars are mean ± SEM. ****p < 0.0001, significance is control group compared to treatment groups
Fig. 9
Fig. 9
(Left) Zantiks behaviour systems, from left to right, MWP system, LT system and AD system, used for Drosophila, mice and zebrafish, respectively. Units are completely automated, with a computer built into the base allowing for image/light projection and a camera positioned above to record live imaging of test animals. This setup reduces experimenter disturbance during testing. (Middle) Mouse Y-maze insert. One mouse per maze. (Right) Drosophila Y-maze inserts, six identical mazes with sliding cover to prevent animals from escaping. Six flies can be run per experiment
Fig. 10
Fig. 10
a Comparison of zebrafish, mouse and fly global tetragram usage over 1 hour of free exploration. b Frequency distribution of global tetragram strategy for 1 hour of exploration in the FMP Y-maze for mice (top, n = 15) and c Drosophila (bottom, n = 30). The dashed line represents random selection at 6.25%. Dominant strategy uses alternations (LRLR, RLRL) for mice and zebrafish and repetitions (LLLL, RRRR) for Drosophila. Bars represent relative frequency of choice, error bars are mean ± SEM
Fig. 11
Fig. 11
Time series analysis of an individual mouse (top) and fly (bottom) showing time series plot of step length (n = 250 steps), lag plot shows a positive correlation for both organisms (middle), ACF plot of the first 20 lag plots both demonstrate over 15 lags of significant autocorrelation
Fig. 12
Fig. 12
(Left) Schematic of human virtual maze structure showing interconnected Y-shaped mazes, each of equal length and diameter. (Right) Screen shot taken from the human FMP Y-maze from the perspective of the participant, as they explore the maze
Fig. 13
Fig. 13
a Tetragram frequency distribution of human participants from a 5-minute trial (n = 24). b Time series analysis of an individual participant showing time series plot (left), lag plot with weak positive correlation (middle) and ACF plot of the first 20 lags, showing significant autocorrelation at lags 1 and 2, which then exponentially decay to zero (right). c Relative means of alternations used in the FMP Y-maze of all organisms, demonstrating an increase in percentage use of alternation from zebrafish to mice and peaking with humans. Data were analysed using one-way ANOVA followed by Tukey’s post hoc multiple comparisons test comparing each organism with all other organisms. d Alternation used for each time bin (trial time divided into six equal time segments) for humans, mice, fish and flies. Data were analysed by two-way ANOVA, followed by Šidák’s post hoc test comparing time × organism. Error bars are mean ± SEM. *p < 0.05, **p < 0.01, ***p < 0.001, ****p < 0.0001, effect of time on alternations

References

    1. Aarsland D, Creese B, Politis M, Chaudhuri KR, Ffytche DH, Weintraub D, Ballard C. Cognitive decline in Parkinson disease. Nature Reviews Neurology. 2017;13(4):217–231. doi: 10.1038/nrneurol.2017.27. - DOI - PMC - PubMed
    1. Adler CM, Goldberg TE, Malhotra AK, Pickar D, Breier A. Effects of ketamine on thought disorder, working memory, and semantic memory in healthy volunteers. Biological Psychiatry. 1998;43(11):811–816. doi: 10.1016/S0006-3223(97)00556-8. - DOI - PubMed
    1. Anderson BJ, Rapp DN, Baek DH, McCloskey DP, Coburn-Litvak PS, Robinson JK. Exercise influences spatial learning in the radial arm maze. Physiology and Behavior. 2000;70(5):425–429. doi: 10.1016/S0031-9384(00)00282-1. - DOI - PubMed
    1. Aoki R, Tsuboi T, Okamoto H. Y-maze avoidance: An automated and rapid associative learning paradigm in zebrafish. Neuroscience Research. 2015;91:69–72. doi: 10.1016/j.neures.2014.10.012. - DOI - PubMed
    1. Arendash GW, Gordon MN, Diamond DM, Austin LA, Hatcher JM, Jantzen P, DiCarlo G, Wilcock D, Morgan D. Behavioral assessment of Alzheimer’s transgenic mice following long-term Aβ vaccination: Task specificity and correlations between Aβ deposition and spatial memory. DNA and Cell Biology. 2001;20(11):737–744. doi: 10.1089/10445490152717604. - DOI - PubMed

Publication types

LinkOut - more resources