Review
. 2021 Jan;13(1):e1503.
doi: 10.1002/wsbm.1503. Epub 2020 Aug 3.

Single-cell proteomic analysis

Affiliations
Review

Single-cell proteomic analysis

Thai Pham et al. WIREs Mech Dis. 2021 Jan.

Abstract

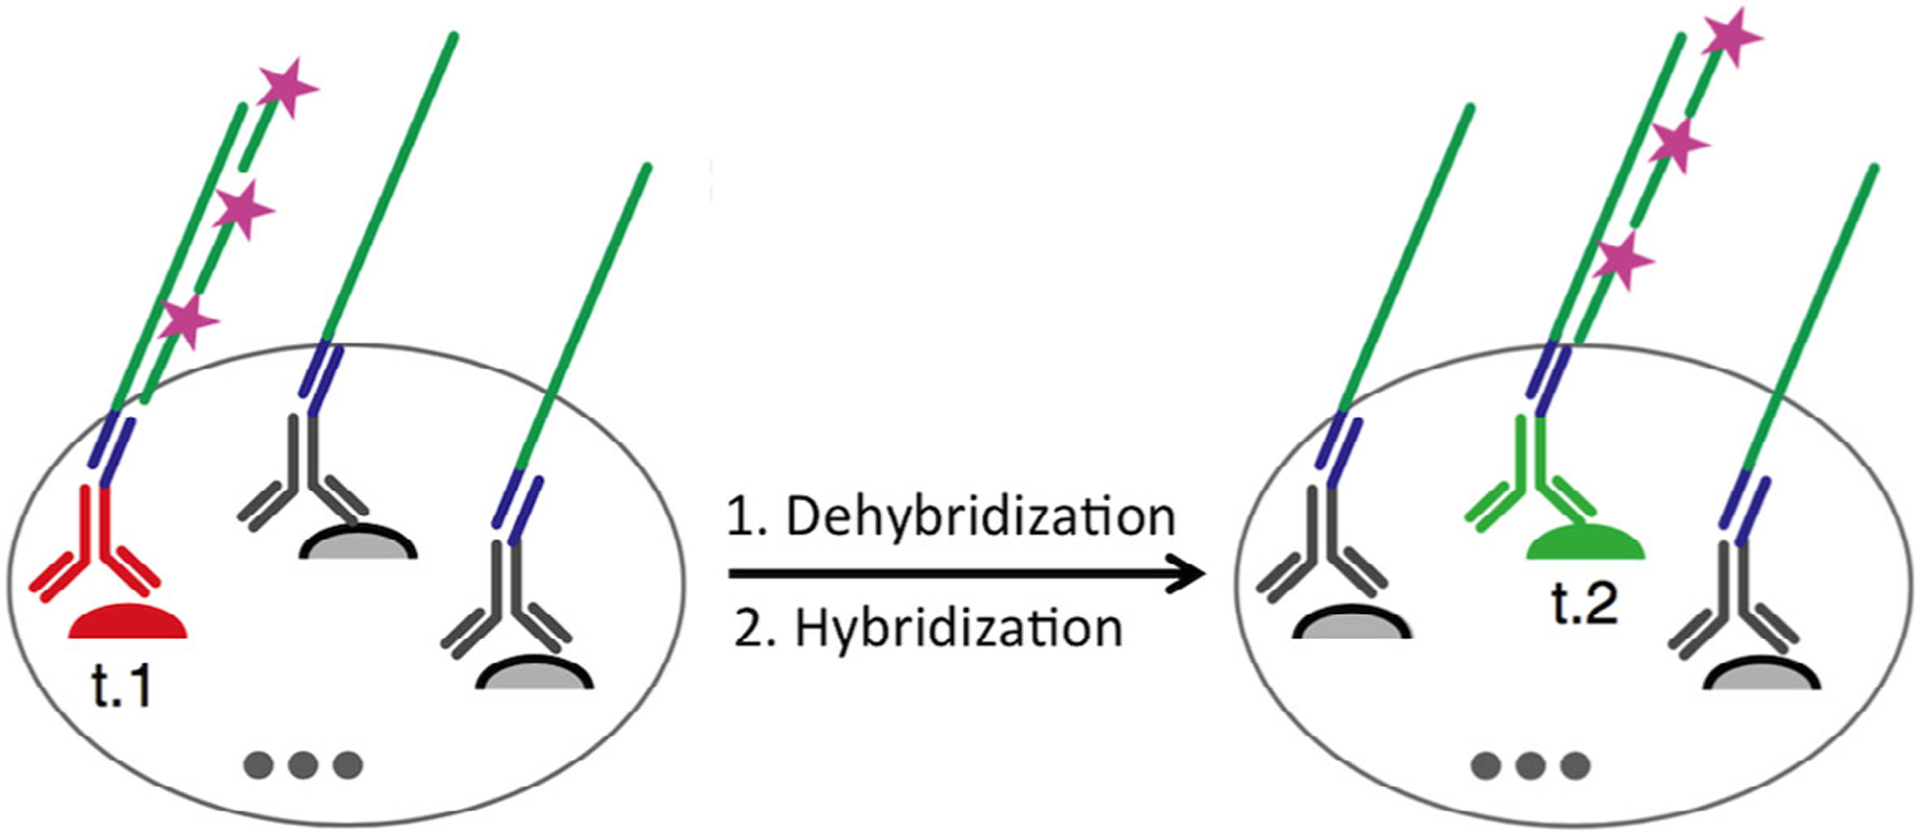
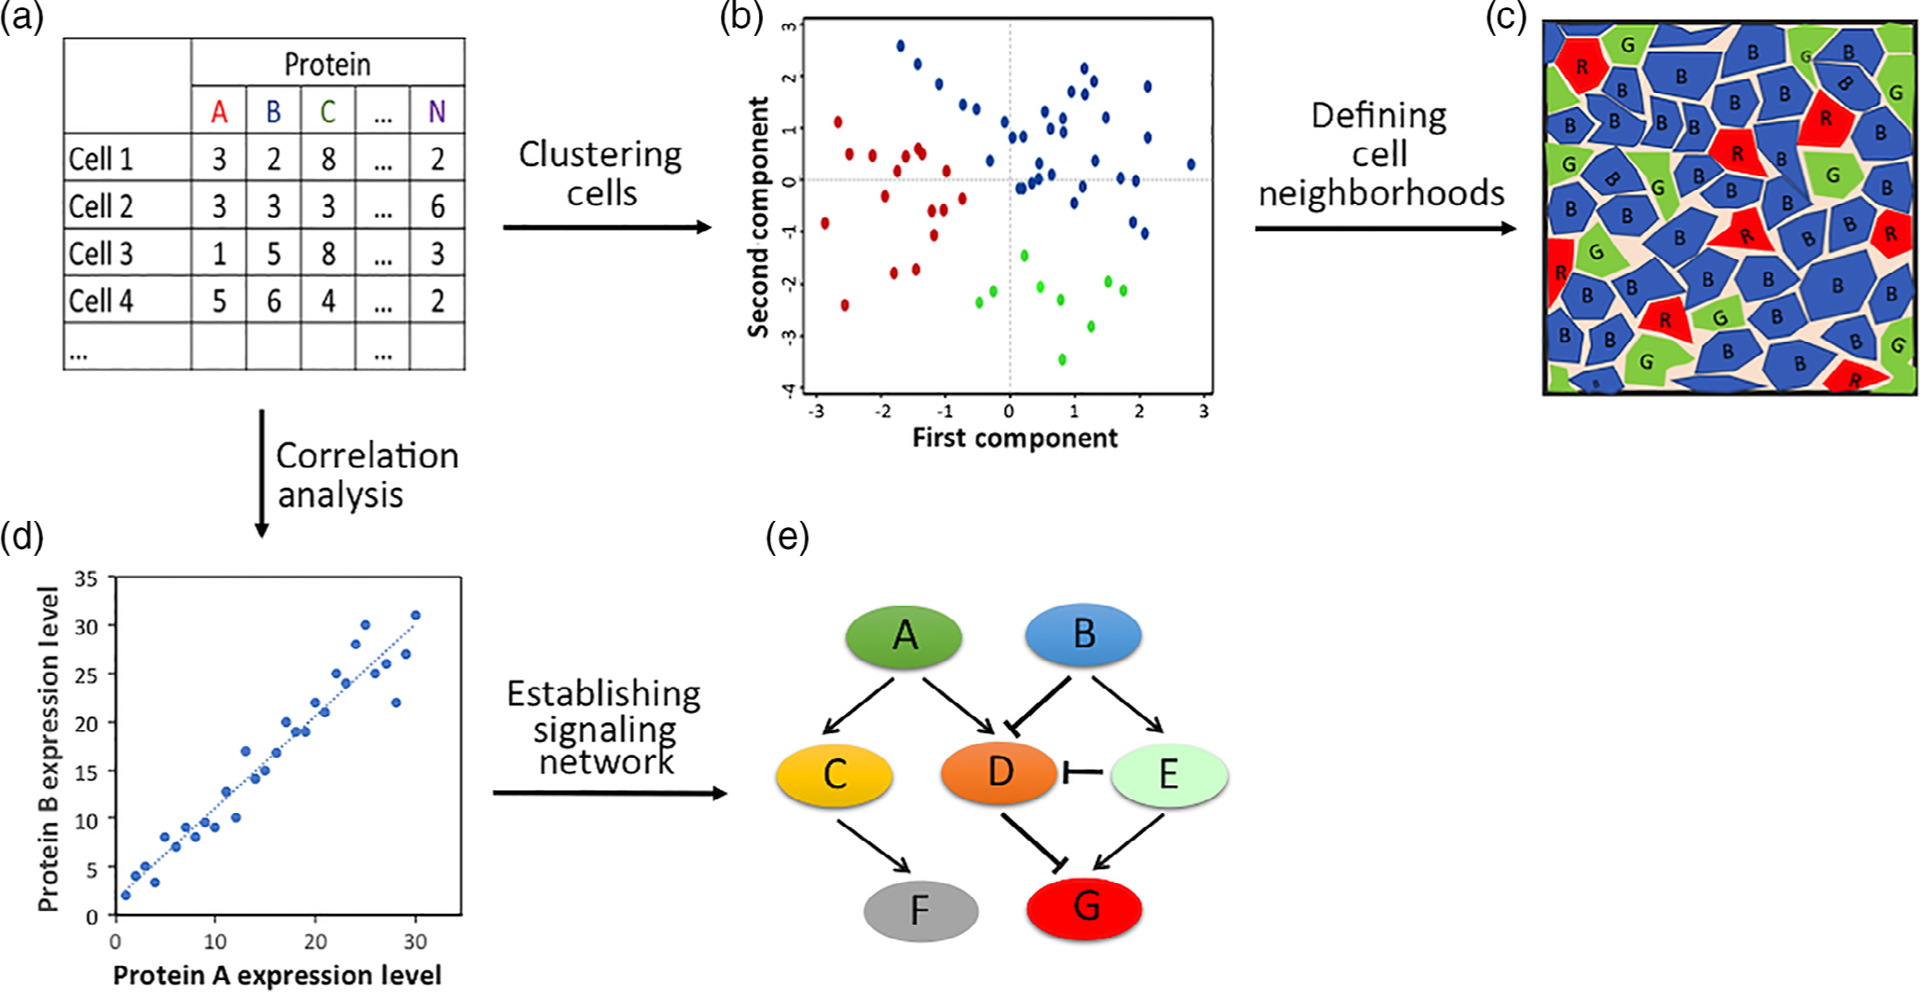
The ability to comprehensively profile proteins in every individual cell of complex biological systems is crucial to advance our understanding of normal physiology and disease pathogenesis. Conventional bulk cell experiments mask the cell heterogeneity in the population, while the single-cell imaging methods suffer from the limited multiplexing capacities. Recent advances in microchip-, mass spectrometry-, and reiterative staining-based technologies have enabled comprehensive protein profiling in single cells. These approaches will bring new insights into a variety of biological and biomedical fields, such as signaling network regulation, cell heterogeneity, tissue architecture, disease diagnosis, and treatment monitoring. In this article, we will review the recent advances in the development of single-cell proteomic technologies, describe their advantages, discuss the current limitations and challenges, and propose potential solutions. We will also highlight the wide applications of these technologies in biology and medicine. This article is categorized under: Cancer > Molecular and Cellular Physiology.

Keywords: imaging; mass spectrometry; microchip; systems biology.


Conflict of interest statement

CONFLICT OF INTEREST

The authors have declared no conflicts of interest for this article.

Figures

FIGURE 1
FIGURE 1
Multiplexed single-cell protein analysis with single-cell barcode chips (SCBC). (a) Image of SBSC. The control and flow channels are shown in blue and red, respectively. (b) Image of the microchambers together with the fluorescence signals detected in each chamber. (c) DNA-encoded antibody library technology, which enables the capture and detection of proteins secreted from individual cells (Reprinted with permission from Ma et al. (2011). Copyright 2011 Nature Publishing Group)
FIGURE 2
FIGURE 2
Schematic procedure for multiplexed single cell protein detection on MIST array. The secreted proteins from single cells are captured by antibodies immobilized on microbeads and detected by ELISA assay. Each microbead and the corresponding protein target are identified by the unique identification code generated by reiterative cycles of bead labeling and signal removal (Reprinted with permission from Zhao et al. (2018). Copyright 2018 WILEY-VCH Verlag GmbH & Co. KGaA, Weinheim)
FIGURE 3
FIGURE 3
Illustration of the cleavable DNA barcoded antibody
FIGURE 4
FIGURE 4
Workflow of mass cytometry. Antibodies conjugated with varied metal isotopes are first applied to stain the protein targets. Subsequently, cells are nebulized into single-cell droplet, and passed through an inductively couple plasma (ICP) time-of-flight (TOF) mass spectrometer to obtain an elemental mass spectrum for every single cell (Reprinted with permission from Bendall and Nolan (2012). Copyright 2012 Nature Publishing Group)
FIGURE 5
FIGURE 5
Workflow of single-cell Western blots. The process begins as individual cells are settled and lysed in the microwell, followed with single-cell PAGE, immobilization of proteins onto the gel by UV, and in-gel probing with fluorescent antibodies. Through reiterative cycles of antibody removal and protein relabeling, comprehensive protein analysis can be achieved in single cells (Reprinted with permission from Sinkala et al. (2017). Copyright 2017 Nature Publishing Group)
FIGURE 6
FIGURE 6
Imaging mass cytometry and ion beam imaging. Tissues are stained with a mixture of metal isotope labeled antibodies. Then, a laser or ion beam is applied to transfer the specimen pixel-by-pixel into a mass spectrometer. The mass data of the identified metal isotopes are translated into protein abundances with computer software
FIGURE 7
FIGURE 7
Approaches to erase fluorescence signals in reiterative immunofluorescence. (a) Fluorescence signals are eliminated using photobleaching or chemical bleaching. (b) Stripping solution is applied to elute antibodies from their protein targets. (c) The fluorescent oligonucleotides hybridized to oligonucleotide-conjugated antibodies are removed with DNA strand displacement reactions. (d) In the CO-Detection by indEXing (CODEX) approach, the fluorophores introduced by incorporation of the cleavable fluorescent nucleotide is removed by chemical cleavage of the linker to release the fluorophores from the incorporated nucleotides. (e) The signals generated by cleavable fluorescent antibodies are erased by chemical cleavage of the linker to release the fluorophores from antibodies
FIGURE 8
FIGURE 8
Highly sensitive in situ proteomics with cleavable fluorescent streptavidin (CFS). In each cycle, the protein target is first stained with cleavable biotin conjugated antibodies, and then labeled with CFS. The staining signal is amplified layer-by-layer using cleavable biotin conjugated orthogonal antibodies and CFS. After image capture, a chemical cleavage reaction is applied to remove fluorophores and the unbound biotins. Finally, the leftover streptavidin is blocked by biotin. Through reiterative analysis cycles, a large number of proteins can be quantified in situ with high sensitivity (Reprinted with permission from Liao et al. (2020). Copyright 2010 Multidisciplinary Digital Publishing Institute (MDPI))
FIGURE 9
FIGURE 9
Highly sensitive in situ proteomics using immunostaining with signal amplification by exchange reaction (Immuno-SABER). The proteins of interest are recognized by DNA-tagged antibodies, which subsequently recruit DNA concatemers and a large number of fluorescent oligonucleotides. Through cycles of dehybridization and hybridization of the fluorescent oligonucleotides, highly sensitive multiplexed in situ protein profiling can be achieved (Reprinted with permission from Saka et al. (2019). Copyright 2019 Nature Publishing Group)
FIGURE 10
FIGURE 10
(a) A large number of proteins are quantified in every single cells of a biological system. (b) Heterogeneous cells are partitioned into different subgroups, with each subgroup consisting of cells possessing similar protein expression profiles. (c) Specific cell neighborhoods with unique cell subgroup compositions are identified. (d) Pairwise protein expression correlation analysis is carried out with each spot presenting one cell and its protein expression levels shown in x and y axes. (e) A regulatory network is generated with activating and inhibitory interactions

References

    1. Aebersold R, & Mann M (2003). Mass spectrometry-based proteomics. Nature, 422(6928), 198–207. 10.1038/nature01511 - DOI - PubMed
    1. Agasti SS, Liong M, Peterson VM, Lee H, & Weissleder R (2012). Photocleavable DNA barcode–antibody conjugates allow sensitive and multiplexed protein analysis in single cells. Journal of the American Chemical Society, 134(45), 18499–18502. 10.1021/ja307689w - DOI - PMC - PubMed
    1. Altelaar AFM, Munoz J, & Heck AJR (2012). Next-generation proteomics: Towards an integrative view of proteome dynamics. Nature Reviews Genetics, 14, 35–48. 10.1038/nrg3356 - DOI - PubMed
    1. Altschuler SJ, & Wu LF (2010). Essay cellular heterogeneity: Do differences make a difference? Cell, 141(4), 559–563. 10.1016/j.cell.2010.04.033 - DOI - PMC - PubMed
    1. Amir ED, Davis KL, Tadmor MD, Simonds EF, Levine JH, Bendall SC, … Pe’er D (2013). viSNE enables visualization of high dimensional single-cell data and reveals phenotypic heterogeneity of leukemia. Nature Biotechnology, 31, 545. 10.1038/nbt.2594 - DOI - PMC - PubMed

Publication types