. 2020 May;25(3):347-370.
doi: 10.1111/infa.12332. Epub 2020 Mar 31.

Visual short-term memory for overtly attended objects during infancy

Affiliations

Visual short-term memory for overtly attended objects during infancy

Aaron G Beckner et al. Infancy. 2020 May.

Abstract

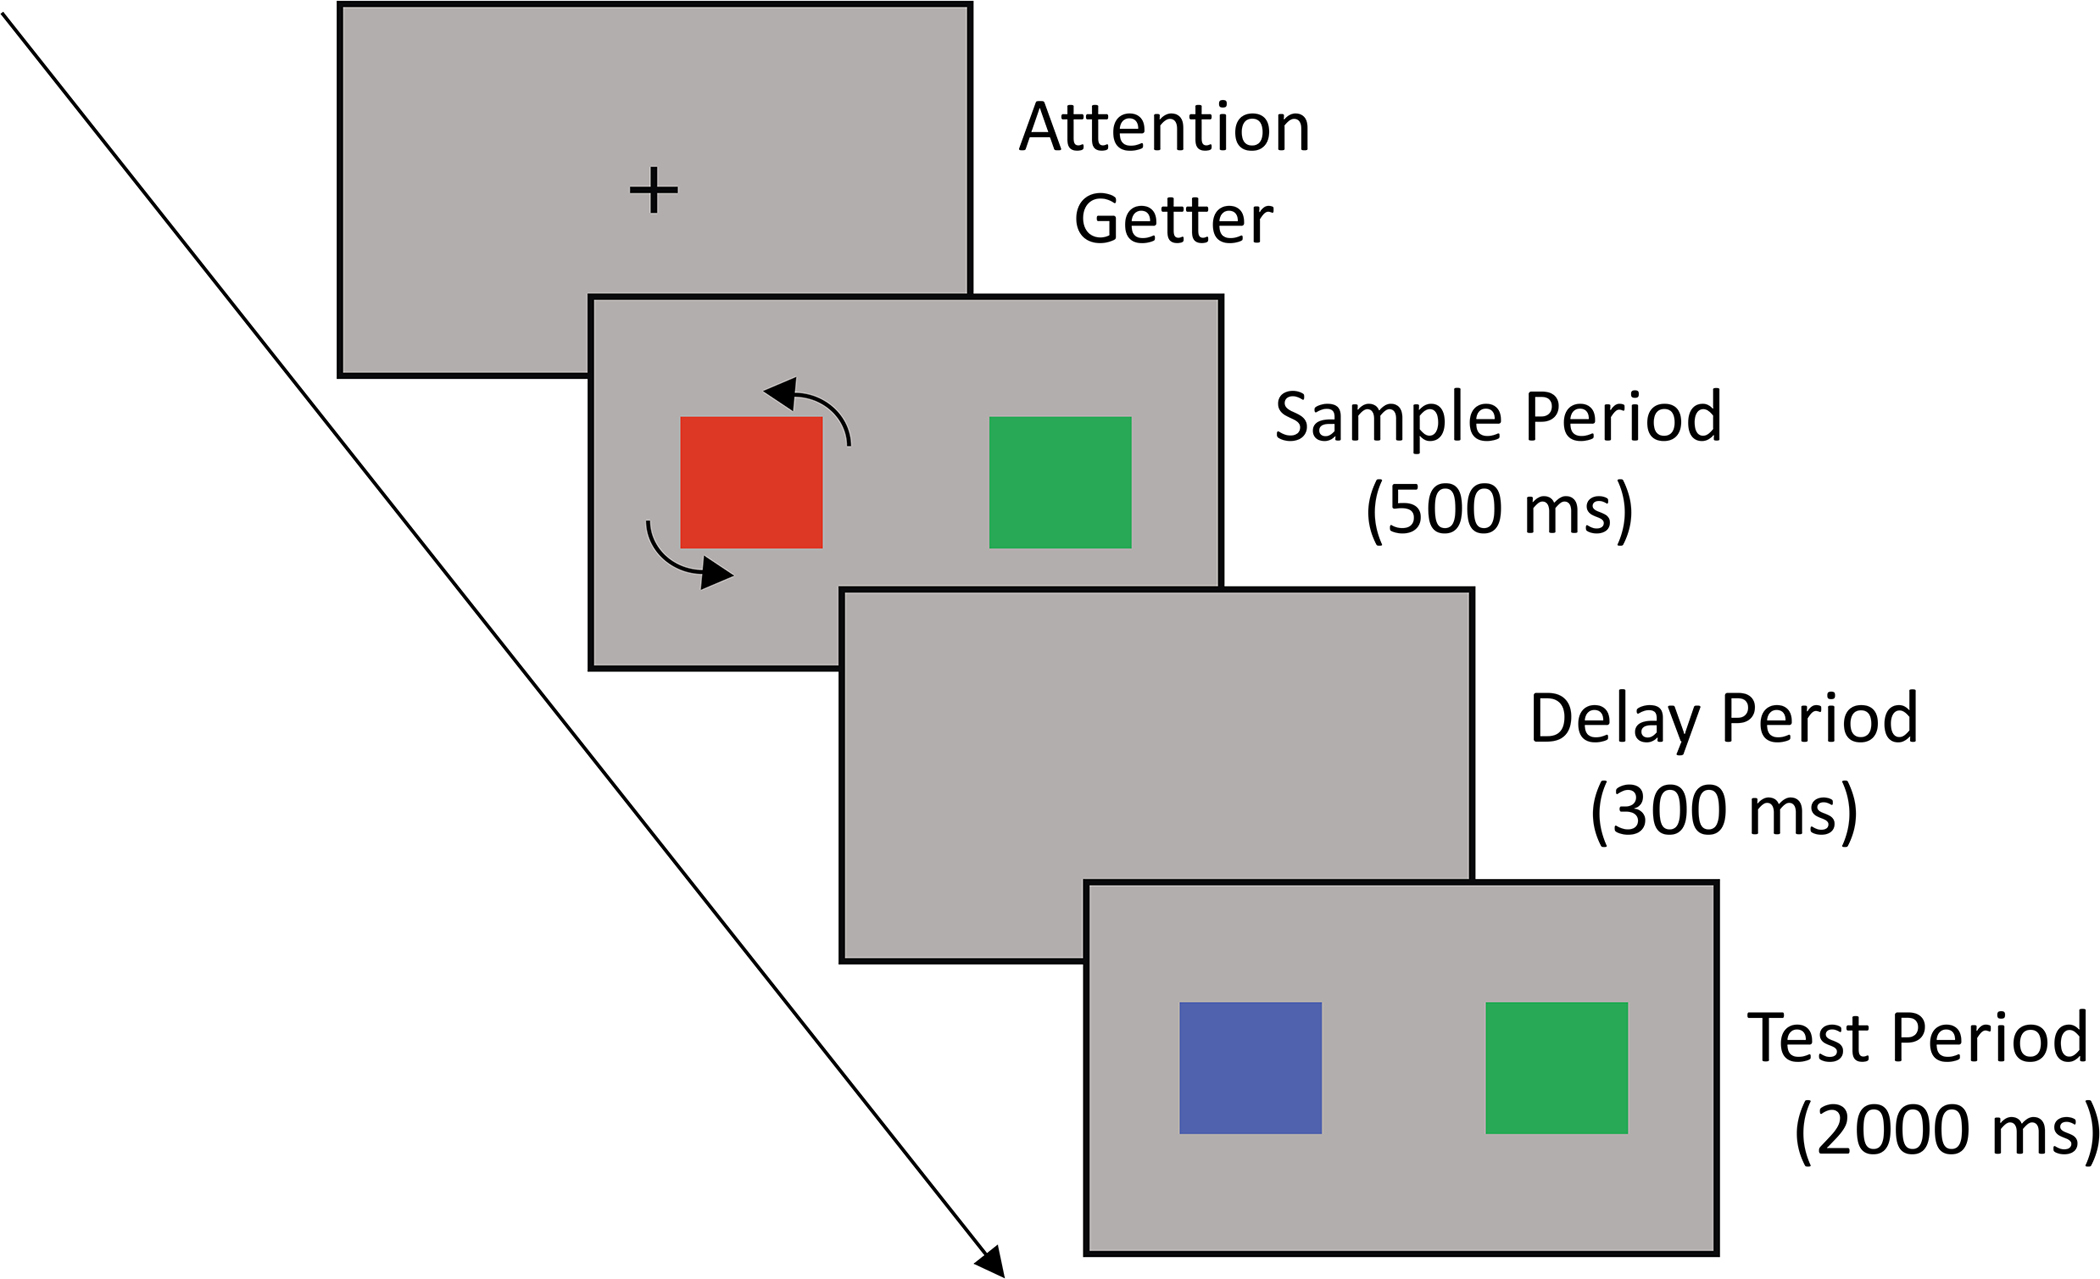
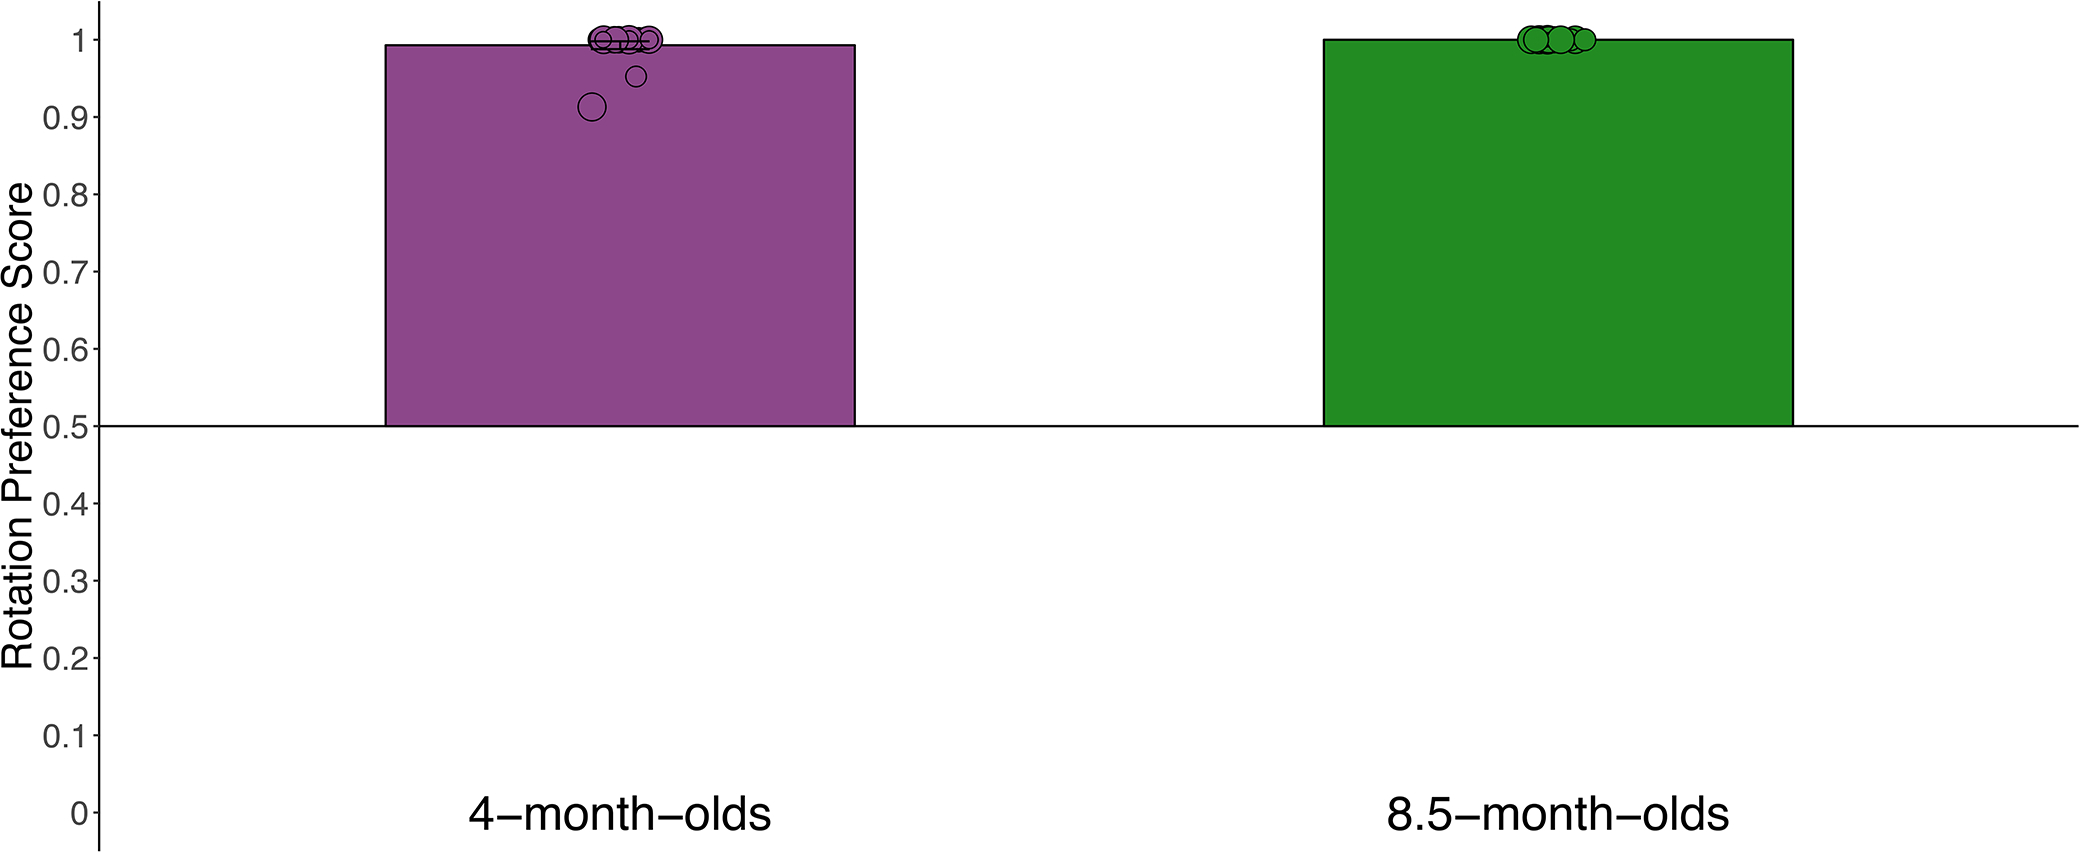
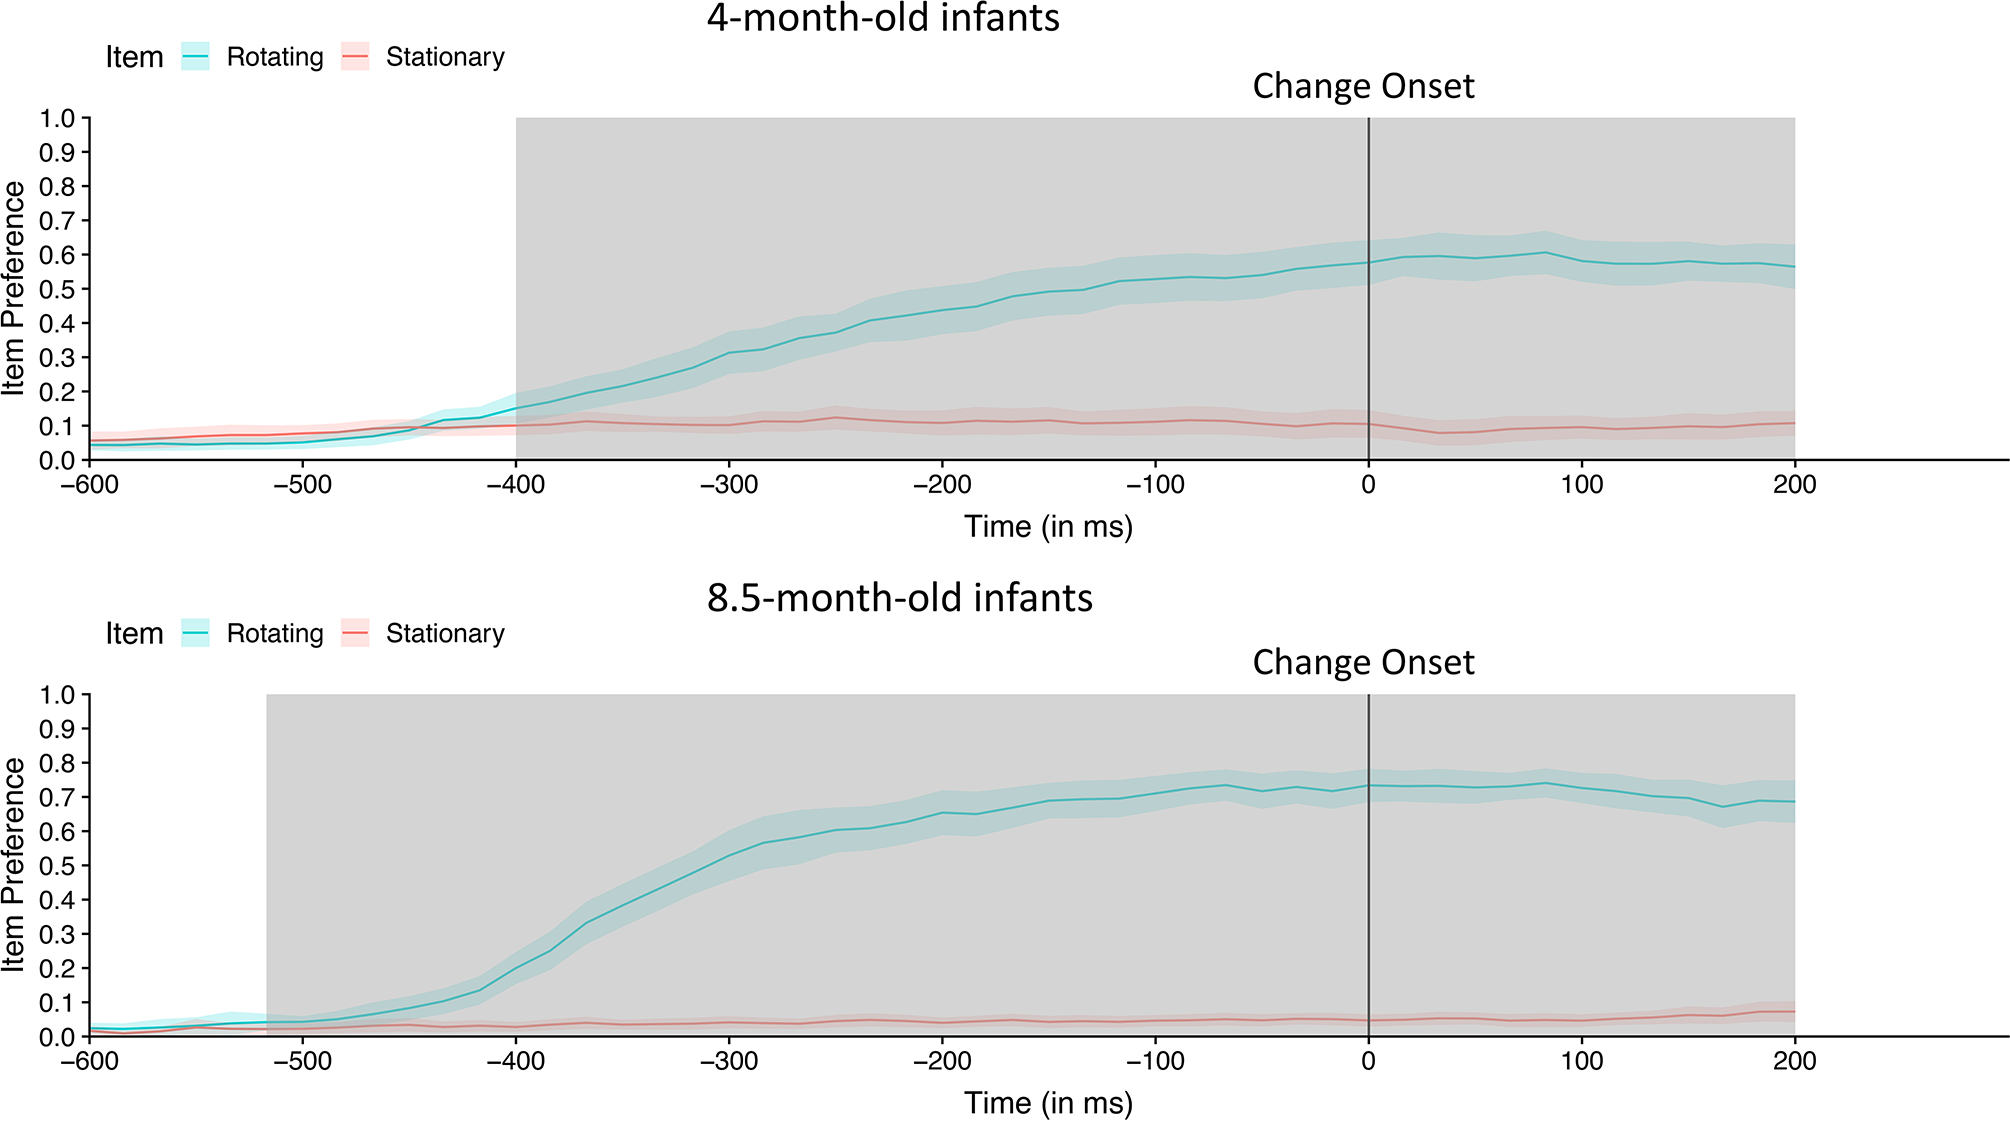
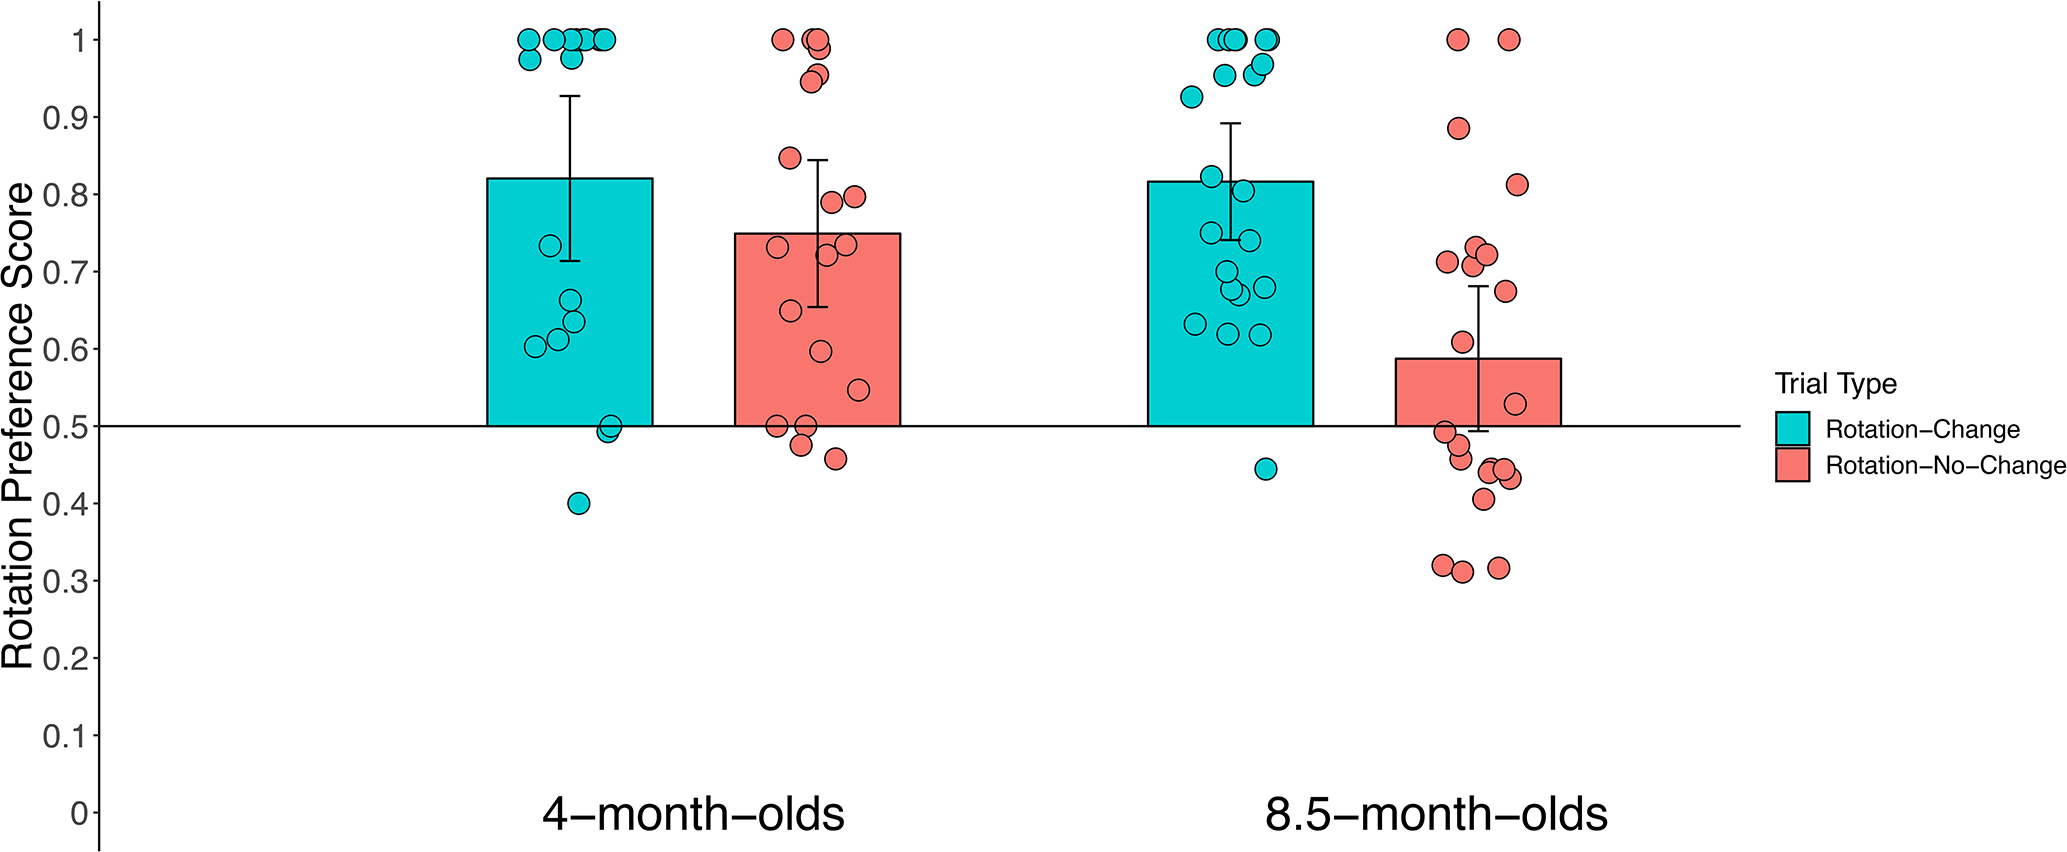
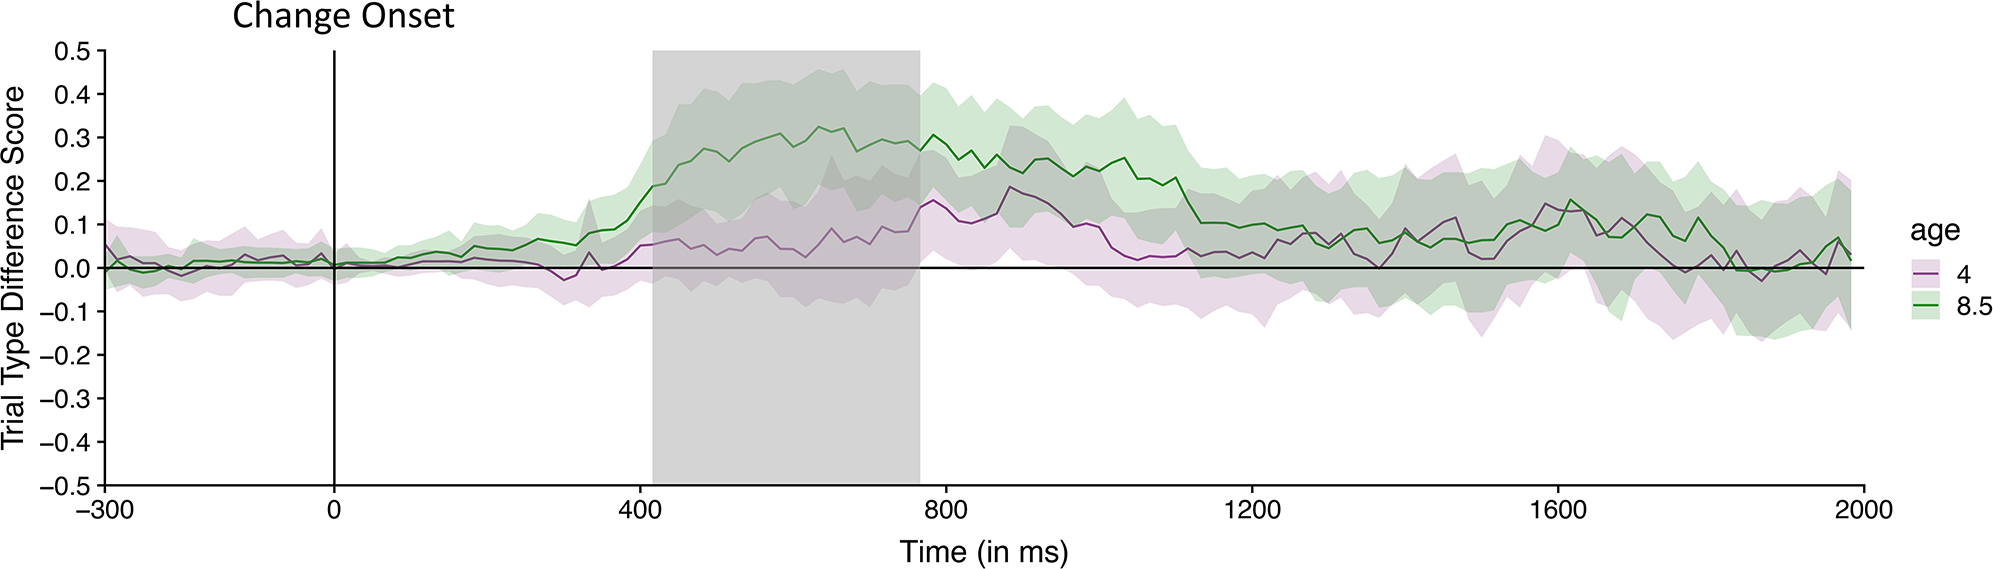
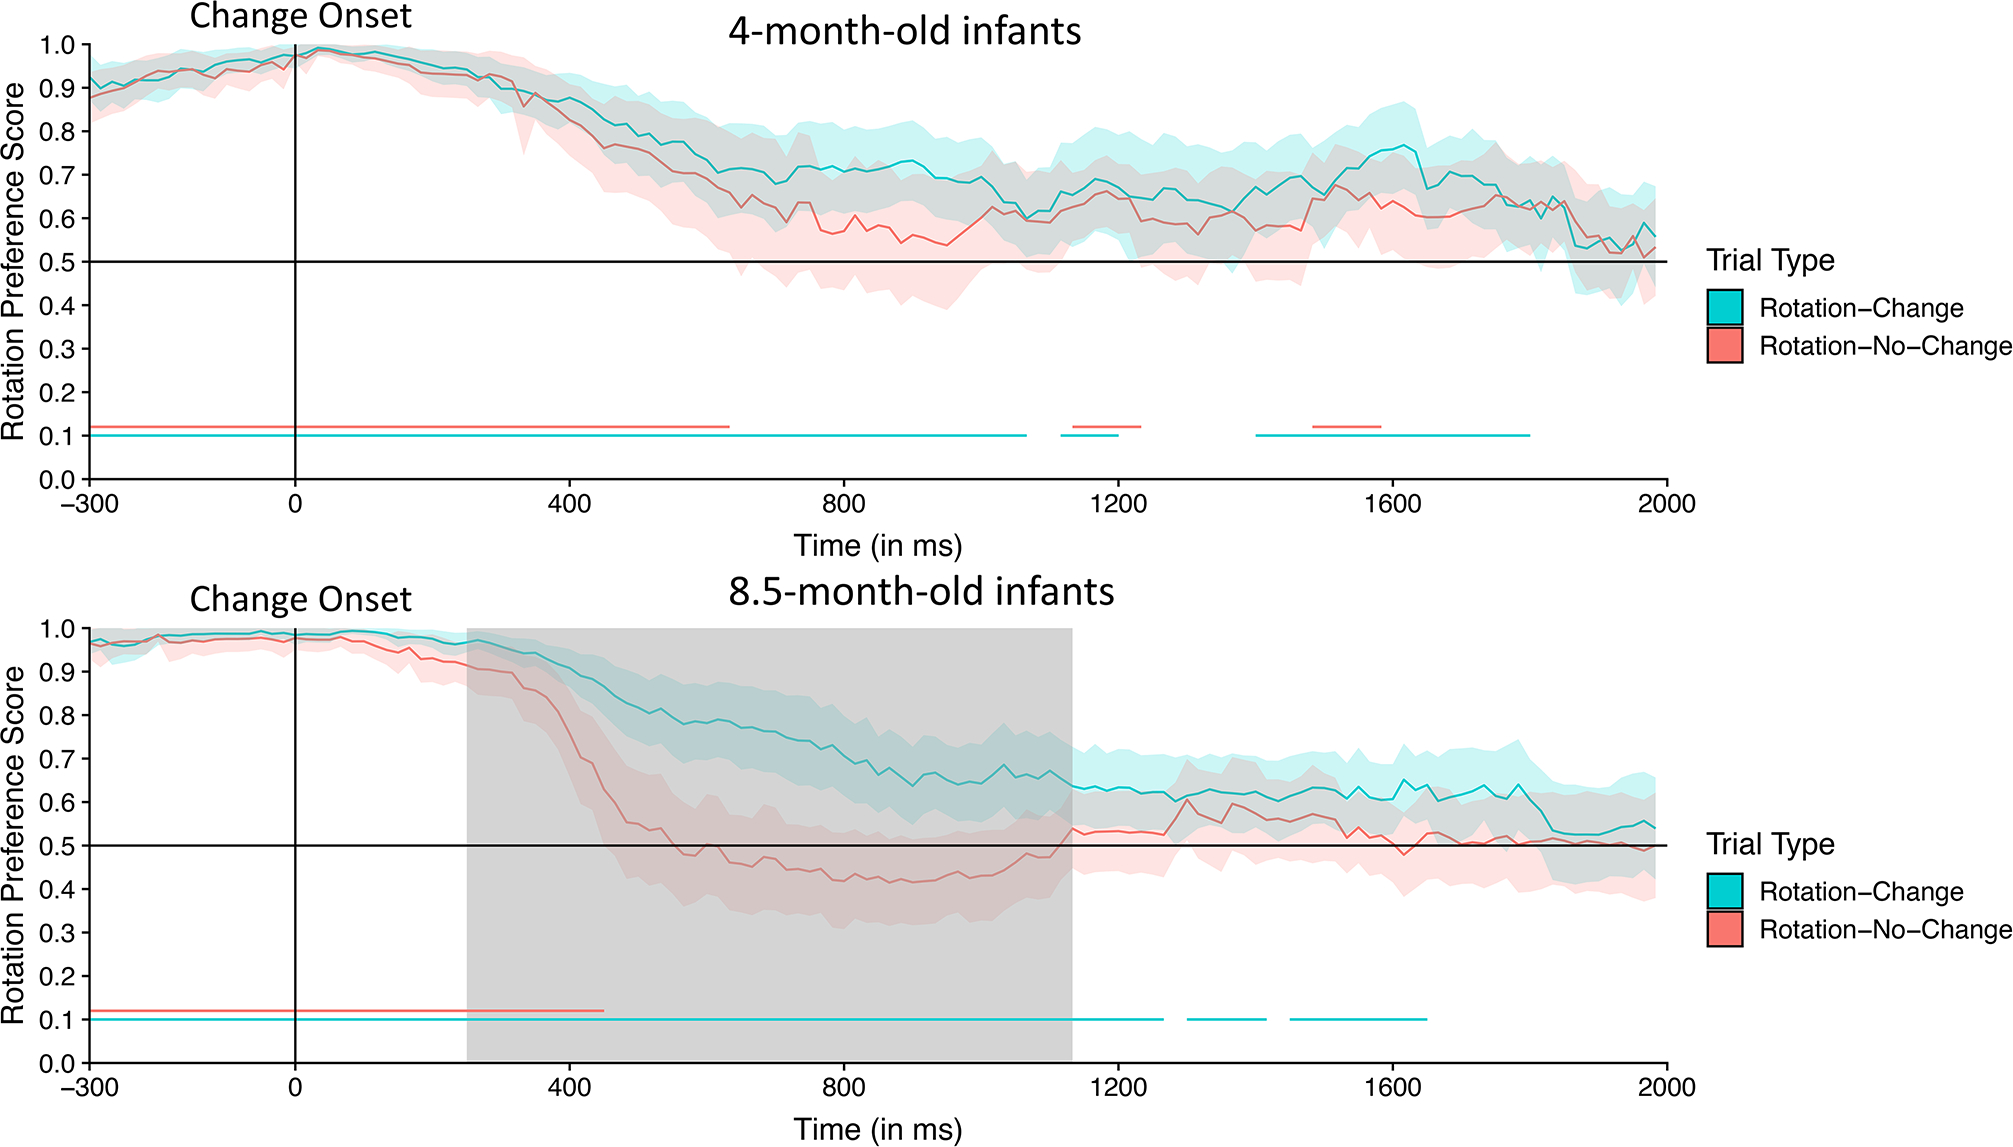
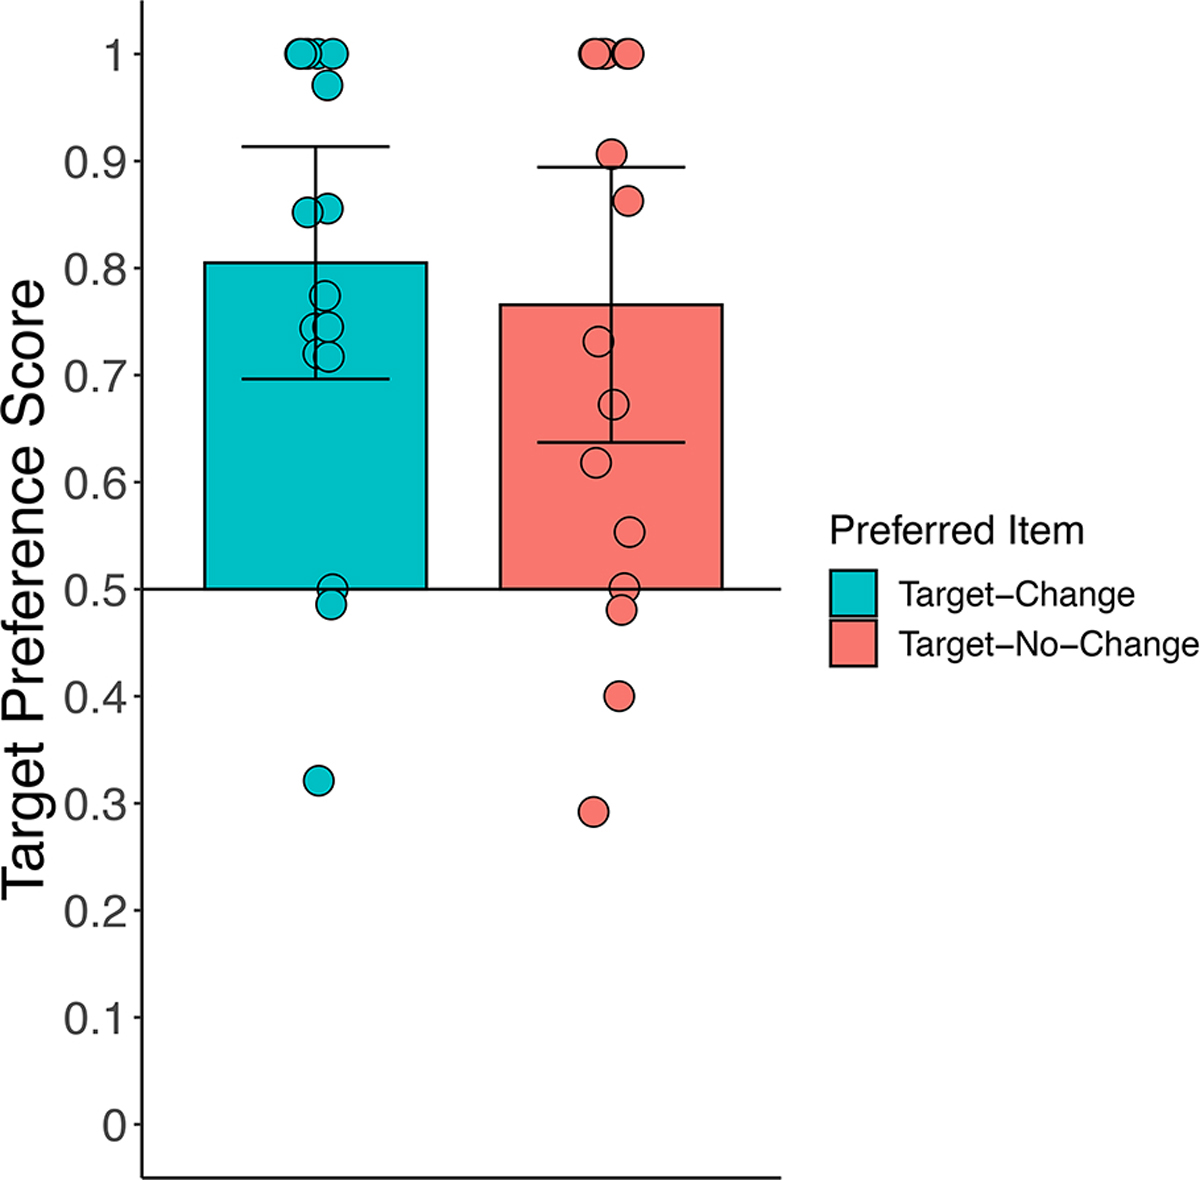
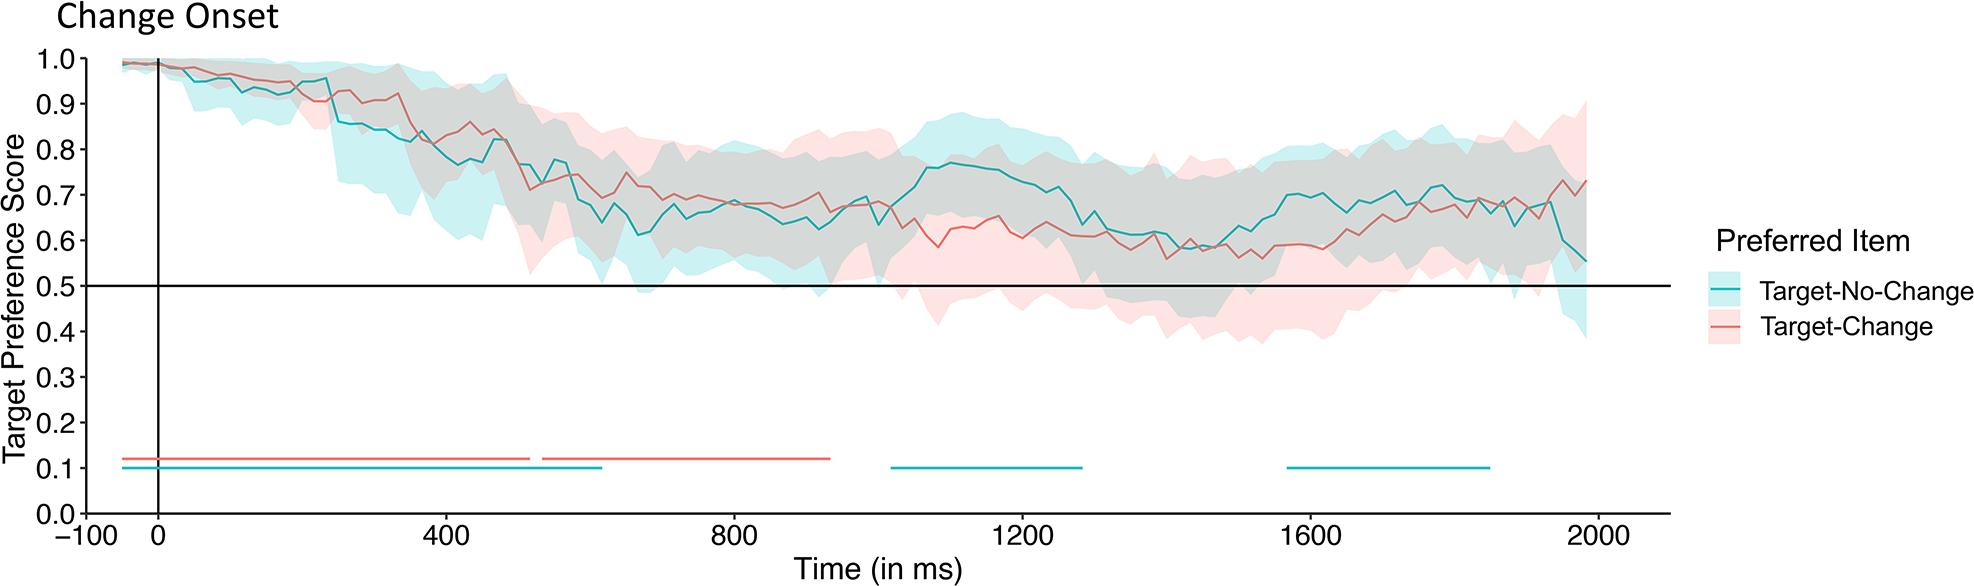
We investigated limitations in young infants' visual short-term memory (VSTM). We used a one-shot change detection task to ask whether 4- and 8.5-month-old infants (N = 59) automatically encode fixated items in VSTM. Our task included trials that consisted of the following sequence: first a brief (500 ms) presentation with a sample array of two items, next a brief (300 ms) delay period with a blank screen, and finally a test array (2,000 ms) identical to the sample array except that the color of one of the two items is changed. In Experiment 1, we induced infants to fixate one item by rotating it during the sample (the other item remained stationary). In Experiment 2, none of the items rotated. In both experiments, 4-month-old infants looked equally at the fixated item when it did and did not change color, providing no evidence that they encoded in VSTM the fixated item. In contrast, 8.5-month-old infants in Experiment 1 preferred the fixated item when it changed color from sample to test. Thus, 4-month-old infants do not appear to automatically encode fixated items in VSTM.


Figures

Figure 1.
Figure 1.
Schematic illustration of experimental stimuli for a single trial in Experiment 1. The depicted trial is a rotation-change trial (because the item that rotates during the sample changes color from sample to test). If this were a rotation-no-change changed trial, the non-rotating (green) item would be a new color during test, and the rotating item would remain red during test.
Figure 2.
Figure 2.
Rotation preference score by age during the attention capture analysis window (200 ms after the onset of the sample array until 200 ms after the onset of the test array) in Experiment 1. The height of the bar represented the mean for each age group, and individual points represent median preference scores for each infant. Error bars—which are difficult to detect due to lack of variability in infants’ responding—represent 95 % confidence intervals and the horizontal line bisecting the y-axis represents chance. Note that all 8.5-month-old infants had a median rotation preference score of 1 so there is no error bar.
Figure 3.
Figure 3.
Time-course of looking to the rotating item (blue line) and non-rotating item (red line) during the attention capture analysis window (200 ms after the onset of the sample array to 200 ms after the onset of the test array) for 4-month-old (top) and 8.5-month-old (bottom) infants in Experiment 1. Each point on the line represents the subject-weighted proportion of trials at each 16.67 ms time point that infants looked at the rotating (blue line) and stationary item (red line); the shading around the lines represents 95% confidence interval for each time point. The two proportions do not equal 1 because infants could be fixating neither item (e.g., looking at the center, being off-task). Permutation analyses identified clusters of time points during which infants fixated rotating item on a statistically significant greater proportion of trials than they fixated the stationary item; those clusters are indicated by gray shading.
Figure 4.
Figure 4.
Rotation preference scores for the previously rotating item during the post-change analysis window for trials in which that item changed color (Rotation-Change trials; blue bars) or remained the same color (Rotation-No-Change trials; red bars) for each age group in Experiment 1. The height of the bar represents the mean score for that trial type for that group of infants, and individual circles represent median preference scores for each infant. Error bars represent 95% confidence intervals, and the horizontal line bisecting the y-axis represents chance.
Figure 5.
Figure 5.
Time-course of looking to the rotating item on trials in which the rotating item changed color (Rotation-Change trials; blue line) and trials in which the item did not change (Rotation-Change No-Change trials; red line) during the time-course analysis window (300 ms before the change onset to the end of the trial) for the 4-month-old (top) and 8.5-month-old (bottom) infants in Experiment 1. The lines represent the mean preference for the location of the rotating item at each 16.67 ms time point before and after the test array appears (indicated by the vertical “Change Onset” line); the shading represents the 95% confidence interval for each time point. Clusters of time points in which infants’ preference was significantly greater than chance (.50; horizontal line bisecting the graph) is indicated by the colored lines at the bottom of each plot; a blue line indicates the time points on Rotation-Change trials in which infants’ preferred the rotating item more than expected by chance, and the red line indicates the time points on Rotation-No-Change trials in which infants preferred the rotating item more than expected by chance. Cluster of time points in which 8.5-month-old infants’ rotation preference preference was significantly greater on Rotation-Change than on Rotation-No-Change trials are indicated by the gray shaded area; at no point did the 4-month-old infants’ preference differ in the two types of trials.
Figure 6.
Figure 6.
Time-course of the difference in infants’ rotation preference score for Rotation-Change and Rotation-No-Change trials for the 4-month-old infants (purple) and 8.5-month-old infants (green) during the time-course analysis window (300 ms before the change onset to the end of the trial) in Experiment 1. The lines represent the difference in preference at each 16.67 ms time point before and after the test array appears (indicated by the vertical “Change Onset” line); the shading around these lines represents the 95% confidence interval. Chance performance (0, indicating no difference between the two types of trials) is indicated by the horizontal line bisecting the vertical axis. The gray area represents clusters of time points during which the difference score for the 8.5-month-old infants was significantly greater than that for the 4-month-old infants.
Figure 7.
Figure 7.
Target preference scores for the preferred item during the post-change analysis window for trials in which that item changed color (Target-Change trials; blue bars) or remained the same color (Target-No-Change trials; red bars) for Experiment 2. The height of the bar represents the mean score for that trial type for that group of infants, and individual circles represent median preference scores for each infant. Error bars represent the 95% confidence intervals, and the horizontal line bisecting the y-axis represents chance.
Figure 8.
Figure 8.
Time-course of looking to the target (as determined by preference during the sample plus delay period) on trials in which the target changed color (Target-Change trials; blue line) and trials in which the target did not change (Target-No-Change trials; red line) during the time-course analysis window (50 ms before the change onset to the end of the trial) for the 4-month-old infants in Experiment 2. The lines represent the mean preference for the target item at each 16.67 ms time point before and after the test array appears (indicated by the vertical “Change Onset” line); the shading represents the 95% confidence interval for each time point. Clusters of time points in which infants’ preference was significantly greater than chance (.50; horizontal line bisecting the graph) is indicated by the colored lines at the bottom the plot; a blue line indicates the time points on Target-Change trials in which infants’ preferred the rotating item more than expected by chance, and the red line indicates the time points on Target-No-Change trials in which infants preferred the rotating item more than expected by chance. At no point did the 4-month-old infants’ preference differ in the two types of trials.

References

    1. Awh E, Barton B, & Vogel EK (2007). Visual working memory represents a fixed number of items regardless of complexity. Psychological Science, 18(7), 622–628. - PubMed
    1. Bremner JG, Slater AM, Mason UC, Spring J, & Johnson SP (2013). Trajectory perception and object continuity: effects of shape and color change on 4-month-olds’ perception of object identity. Developmental Psychology, 49(6), 1021–1026. - PMC - PubMed
    1. Cantrell LM, Kanjlia S, Harrison M, Luck SJ, & Oakes LM (2019). Cues to individuation facilitate 6-month-old infants’ visual short-term memory. In Developmental Psychology (Vol. 55, Issue 5, pp. 905–919). American Psychological Association. 10.1037/dev0000683 - DOI - PMC - PubMed
    1. Catherwood D, Skoien P, Green V, & Holt C (1996). Assessing the primary moments in infant encoding of compound visual stimuli. Infant Behavior & Development, 19(1), 1–11.
    1. Cohen LB (1972). Attention-getting and attention-holding processes of infant visual preferences. Child Development, 43(3), 869–879. - PubMed

Publication types