

PleThora: Pleural effusion and thoracic cavity segmentations in diseased lungs for benchmarking chest CT processing pipelines
- PMID: 32749075
- PMCID: PMC7722027
- DOI: 10.1002/mp.14424
PleThora: Pleural effusion and thoracic cavity segmentations in diseased lungs for benchmarking chest CT processing pipelines
Abstract
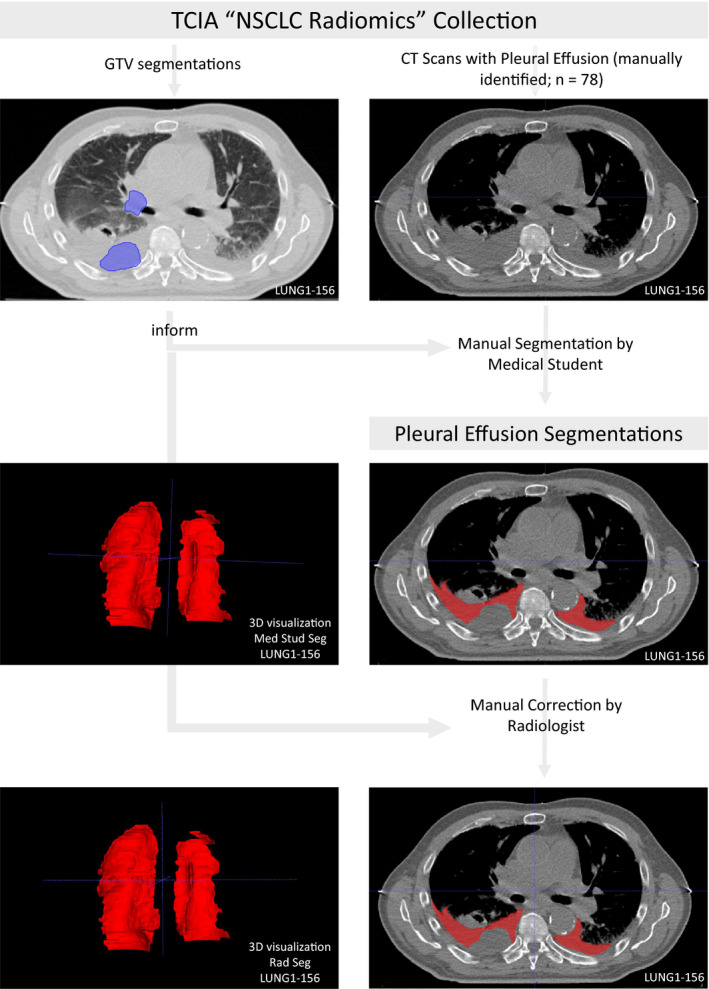
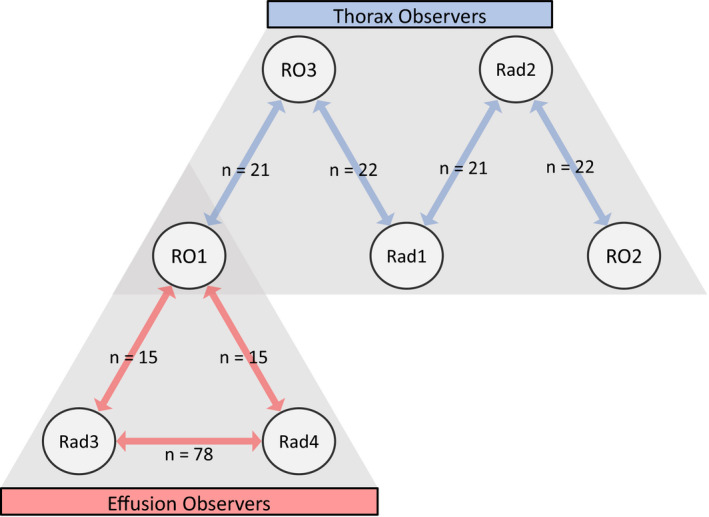
This manuscript describes a dataset of thoracic cavity segmentations and discrete pleural effusion segmentations we have annotated on 402 computed tomography (CT) scans acquired from patients with non-small cell lung cancer. The segmentation of these anatomic regions precedes fundamental tasks in image analysis pipelines such as lung structure segmentation, lesion detection, and radiomics feature extraction. Bilateral thoracic cavity volumes and pleural effusion volumes were manually segmented on CT scans acquired from The Cancer Imaging Archive "NSCLC Radiomics" data collection. Four hundred and two thoracic segmentations were first generated automatically by a U-Net based algorithm trained on chest CTs without cancer, manually corrected by a medical student to include the complete thoracic cavity (normal, pathologic, and atelectatic lung parenchyma, lung hilum, pleural effusion, fibrosis, nodules, tumor, and other anatomic anomalies), and revised by a radiation oncologist or a radiologist. Seventy-eight pleural effusions were manually segmented by a medical student and revised by a radiologist or radiation oncologist. Interobserver agreement between the radiation oncologist and radiologist corrections was acceptable. All expert-vetted segmentations are publicly available in NIfTI format through The Cancer Imaging Archive at https://doi.org/10.7937/tcia.2020.6c7y-gq39. Tabular data detailing clinical and technical metadata linked to segmentation cases are also available. Thoracic cavity segmentations will be valuable for developing image analysis pipelines on pathologic lungs - where current automated algorithms struggle most. In conjunction with gross tumor volume segmentations already available from "NSCLC Radiomics," pleural effusion segmentations may be valuable for investigating radiomics profile differences between effusion and primary tumor or training algorithms to discriminate between them.
Keywords: computer-aided decision support systems; image processing; image segmentation techniques; informatics in imaging; quantitative imaging.
© 2020 The Authors. Medical Physics published by Wiley Periodicals LLC on behalf of American Association of Physicists in Medicine.
Conflict of interest statement
The authors declare no conflict of interest relevant to this publication or the data therein described.
Figures


References
-
- Zhang G, Jiang S, Yang Z, et al. Automatic nodule detection for lung cancer in CT images: a review. Comput Biol Med. 2018;103:287–300. - PubMed
-
- Ardila D, Kiraly AP, Bharadwaj S, et al. End‐to‐end lung cancer screening with three‐dimensional deep learning on low‐dose chest computed tomography. Nat Med. 2019;25:954–961. - PubMed
-
- Hu S, Hoffman EA, Reinhardt JM. Automatic lung segmentation for accurate quantitation of volumetric X‐ray CT images. IEEE Trans Med Imaging. 2001;20:490–498. - PubMed
-
- Tong Y, Udupa JK, Odhner D, Wu C, Schuster SJ, Torigian DA. Disease quantification on PET/CT images without explicit object delineation. Med Image Anal. 2019;51:169–183. - PubMed
MeSH terms
Grants and funding
- R01 CA214825/CA/NCI NIH HHS/United States
- R25 EB025787/EB/NIBIB NIH HHS/United States
- UL1 TR003167/TR/NCATS NIH HHS/United States
- R56 DE025248/DE/NIDCR NIH HHS/United States
- R25EB025787-01/HHS | NIH | National Institute of Biomedical Imaging and Bioengineering (NIBIB)
- 1R01DE025248/HHS | National Institutes of Health (NIH)
- 1R01CA214825/HHS | National Institutes of Health (NIH)
- R01 AG066749/AG/NIA NIH HHS/United States
- R56DE025248/HHS | National Institutes of Health (NIH)
- P30 CA016672/CA/NCI NIH HHS/United States
- P50 CA097007/CA/NCI NIH HHS/United States
- NSF1557679/National Science Foundation (NSF)
- R01 DE028290/DE/NIDCR NIH HHS/United States
- R01 DE025248/DE/NIDCR NIH HHS/United States
- NSF1933369/National Science Foundation (NSF)
- UL1TR003167/HHS | National Institutes of Health (NIH)
- RP170668/Cancer Prevention and Research Institute of Texas (CPRIT)
- P30CA016672/HHS | NIH | National Cancer Institute (NCI)
- R01DE028290/HHS | National Institutes of Health (NIH)
- P50CA097007/HHS | NIH | National Cancer Institute (NCI)
- UTHealth Center for Clinical and Translational Sciences
- R01 CA218148/CA/NCI NIH HHS/United States
- R01AG066749/HHS | National Institutes of Health (NIH)
- 1R01CA218148/HHS | NIH | National Cancer Institute (NCI)
- BIL KLS-4300-08-2017/Swiss Cancer League
LinkOut - more resources
Full Text Sources
Medical
Research Materials
