Meta-Analysis
. 2020 Oct;297(1):87-96.
doi: 10.1148/radiol.2020200443. Epub 2020 Aug 4.

Incidence of Pseudoprogression during Immune Checkpoint Inhibitor Therapy for Solid Tumors: A Systematic Review and Meta-Analysis

Affiliations
Meta-Analysis

Incidence of Pseudoprogression during Immune Checkpoint Inhibitor Therapy for Solid Tumors: A Systematic Review and Meta-Analysis

Hyo Jung Park et al. Radiology. 2020 Oct.

Abstract

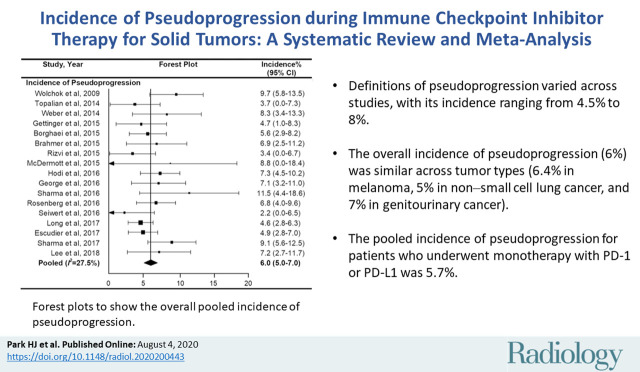
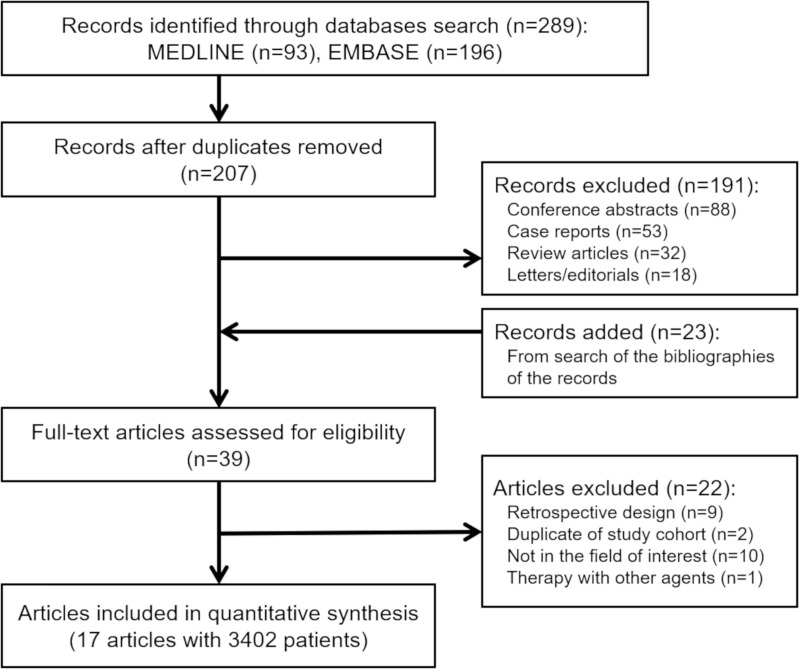
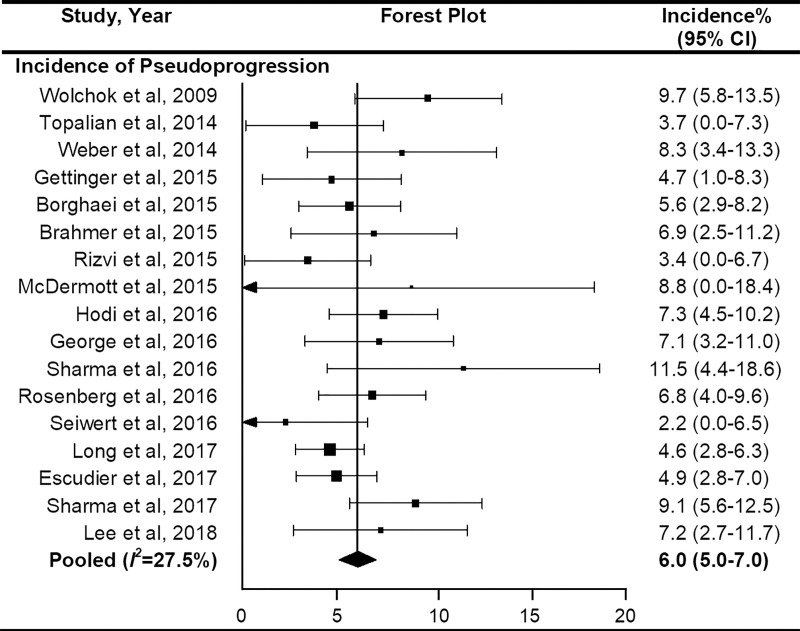
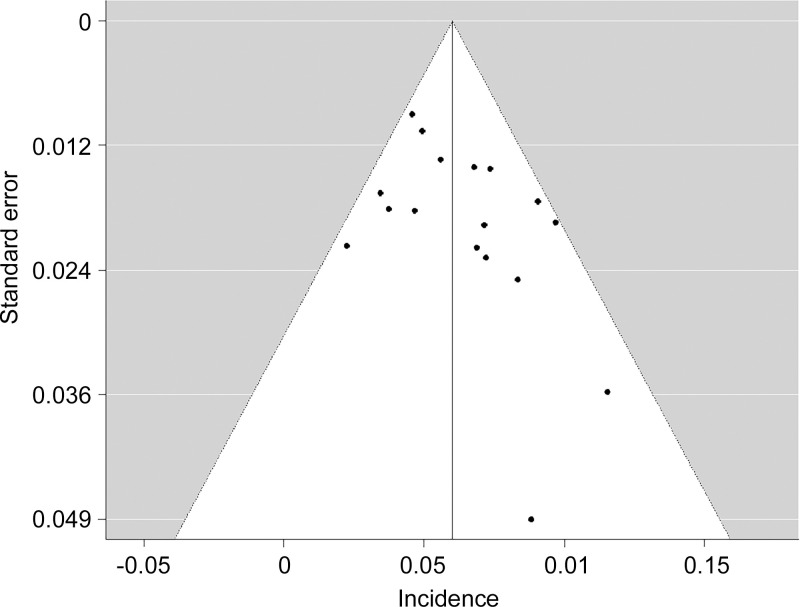
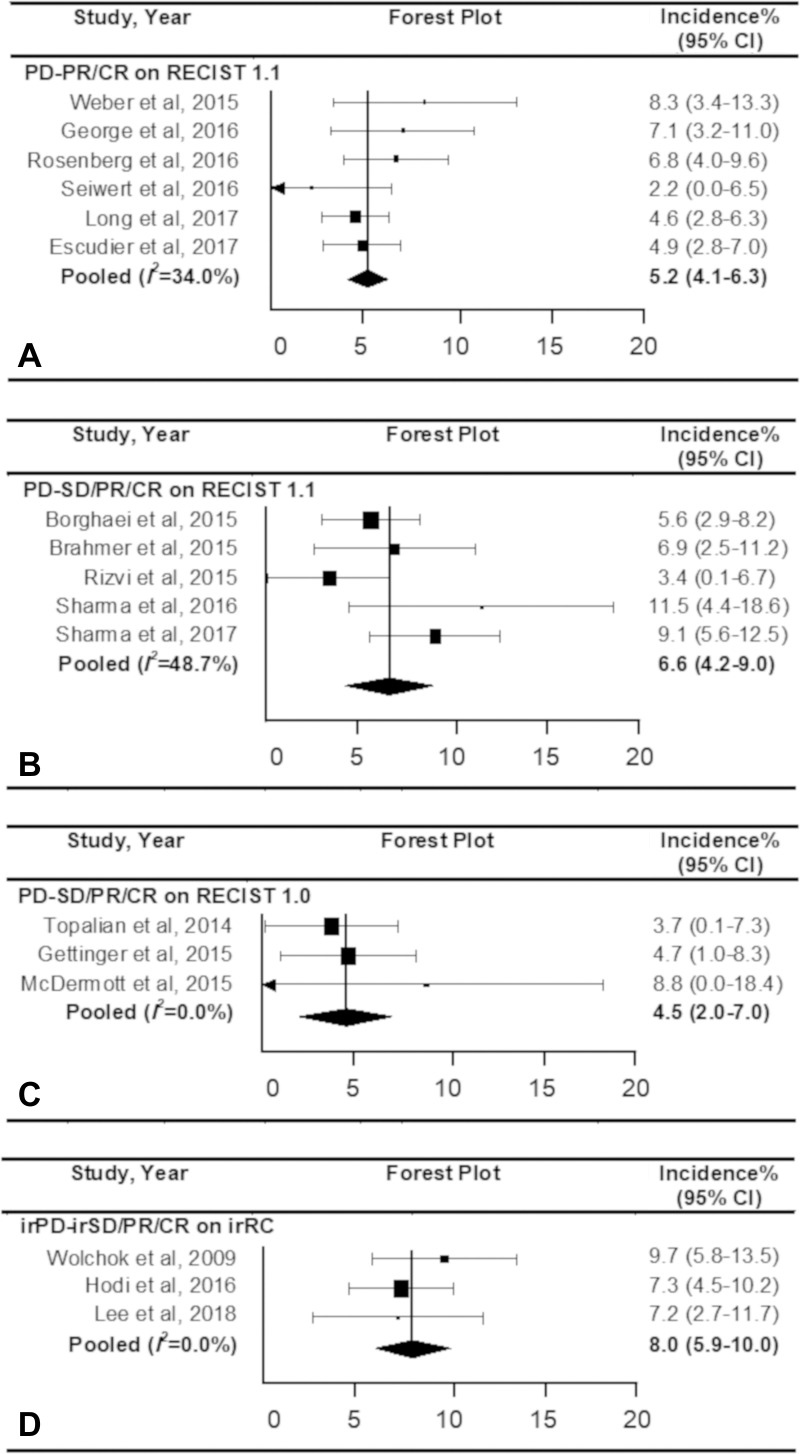
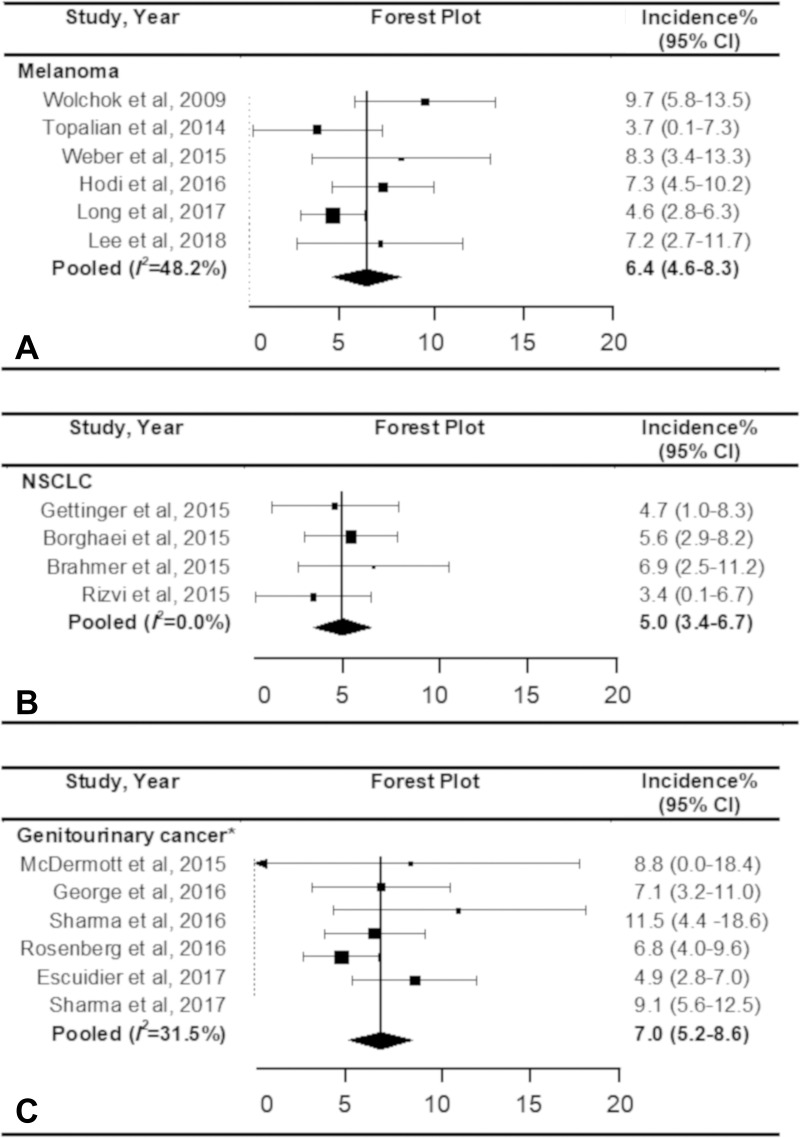
BackgroundImmune checkpoint inhibitors (ICIs) have been increasingly used in cancer treatment, and a subset of patients undergo pseudoprogression. Recognizing the incidence of pseudoprogression is critical for clinical practice.PurposeTo evaluate by systematic review and meta-analysis the incidence of pseudoprogression in cancer treatment with ICIs, and compare the incidence according to response criteria, tumor types, and immunotherapeutic agents.Materials and MethodsMedline and Embase were searched to identify relevant studies published before December 31, 2018. Clinical trials, post hoc analysis of clinical trials, and prospective studies on ICI treatment in patients with malignant solid tumors were included. Pooled incidence of pseudoprogression for all included studies, per definition of pseudoprogression, cancer type, and drug type, was obtained by random-effects models with inverse variance weighting model.ResultsSeventeen studies with 3402 patients were analyzed. The pooled incidence of pseudoprogression was 6.0% (95% confidence interval: 5.0%, 7.0%). The definition of pseudoprogression were divided into four categories: progressive disease followed by partial response (PR) or complete response (CR) but not stable disease (SD) with Response Evaluation Criteria in Solid Tumors (RECIST) 1.1 (six studies); progressive disease followed by SD or PR or CR with RECIST 1.1 (five studies); progressive disease followed by SD or PR or CR with RECIST 1.0 (three studies); and progressive disease followed by SD or PR or CR with immune-related response criteria (irRC) (three studies). Incidence of pseudoprogression varied from 4.5% to 8.0% per definition, ranged from 5.0% to 7.0% per cancer type, and was 5.6% with the monotherapy of programmed cell death-1 inhibitor.ConclusionThe overall incidence of pseudoprogression was 6.0% and was less than 10% in subgroup analyses according to the definitions of pseudoprogression, cancer type, and immune checkpoint inhibitor type. Varying definitions across trials and studies indicates the need for uniform criteria of pseudoprogression for solid tumors.© RSNA, 2020Online supplemental material is available for this article.See also the article by Dodd and MacDermott in this issue.


Figures

None
Graphical abstract
Flow diagram of the study selection process.
Figure 1:
Flow diagram of the study selection process.
Quality assessment for included studies in meta-analysis. A, Risk of bias 2.0 was used for five randomized controlled clinical trials and, B, Risk of Bias in Nonrandomized Studies of Interventions (ROBINS-I) was used for 12 nonrandomized studies.
Figure 2:
Quality assessment for included studies in meta-analysis. A, Risk of bias 2.0 was used for five randomized controlled clinical trials and, B, Risk of Bias in Nonrandomized Studies of Interventions (ROBINS-I) was used for 12 nonrandomized studies.
Forest plots to show the overall pooled incidence of pseudoprogression. The pooled incidence of pseudoprogression was 6.0%. CI = confidence interval.
Figure 3:
Forest plots to show the overall pooled incidence of pseudoprogression. The pooled incidence of pseudoprogression was 6.0%. CI = confidence interval.
Funnel plot for visual appraisal of the literature bias indicated no substantial publication bias. ⋅ indicates individual study.
Figure 4:
Funnel plot for visual appraisal of the literature bias indicated no substantial publication bias. ⋅ indicates individual study.
Forest plots show the pooled incidence of pseudoprogression according to the definition. The pooled incidence of pseudoprogression was, A, 5.2% according to progressive disease (PD) followed by partial response (PR) or complete response (CR) on response evaluation criteria in solid tumor (RECIST) 1.1, B, 6.6% according to progressive disease followed by stable disease (SD) or PR or CR on RECIST 1.1, C, 4.5% according to PD followed by SD or PR or CR on RECIST 1.0, and, D, 8.0% according to PD followed by SD or PR or CR. CI = confidence interval.
Figure 5:
Forest plots show the pooled incidence of pseudoprogression according to the definition. The pooled incidence of pseudoprogression was, A, 5.2% according to progressive disease (PD) followed by partial response (PR) or complete response (CR) on response evaluation criteria in solid tumor (RECIST) 1.1, B, 6.6% according to progressive disease followed by stable disease (SD) or PR or CR on RECIST 1.1, C, 4.5% according to PD followed by SD or PR or CR on RECIST 1.0, and, D, 8.0% according to PD followed by SD or PR or CR. CI = confidence interval.
Forest plots show the pooled incidence of pseudoprogression according to the type of cancer. The pooled incidence of pseudoprogression was, A, 6.4% for melanoma, B, 5.0% for non–small cell lung cancer (NSCLC), and, C, 7.0% for genitourinary cancer. * Included renal cell carcinoma and urothelial cell carcinoma. CI = confidence interval.
Figure 6:
Forest plots show the pooled incidence of pseudoprogression according to the type of cancer. The pooled incidence of pseudoprogression was, A, 6.4% for melanoma, B, 5.0% for non–small cell lung cancer (NSCLC), and, C, 7.0% for genitourinary cancer. * Included renal cell carcinoma and urothelial cell carcinoma. CI = confidence interval.

Comment in

References

    1. Borcoman E, Kanjanapan Y, Champiat S, et al. . Novel patterns of response under immunotherapy. Ann Oncol 2019;30(3):385–396. - PubMed
    1. Wolchok JD, Hoos A, O’Day S, et al. . Guidelines for the evaluation of immune therapy activity in solid tumors: immune-related response criteria. Clin Cancer Res 2009;15(23):7412–7420. - PubMed
    1. Nishino M. Immune-related response evaluations during immune-checkpoint inhibitor therapy: establishing a “common language” for the new arena of cancer treatment. J Immunother Cancer 2016;4(1):30. - PMC - PubMed
    1. Nishino M, Giobbie-Hurder A, Gargano M, Suda M, Ramaiya NH, Hodi FS. Developing a common language for tumor response to immunotherapy: immune-related response criteria using unidimensional measurements. Clin Cancer Res 2013;19(14):3936–3943. - PMC - PubMed
    1. Nishino M, Hatabu H, Hodi FS. Imaging of Cancer Immunotherapy: Current Approaches and Future Directions. Radiology 2019;290(1):9–22. - PMC - PubMed

Publication types

MeSH terms

Substances