. 2020 Sep 4;48(15):8320-8331.
doi: 10.1093/nar/gkaa638.

A comprehensive rat transcriptome built from large scale RNA-seq-based annotation

Affiliations

A comprehensive rat transcriptome built from large scale RNA-seq-based annotation

Xiangjun Ji et al. Nucleic Acids Res. .

Abstract

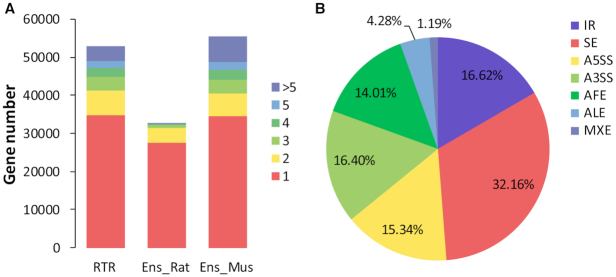
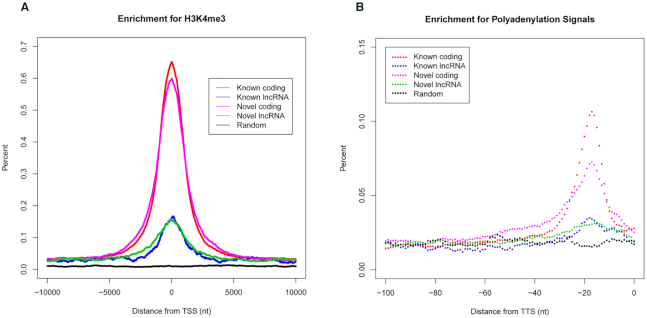
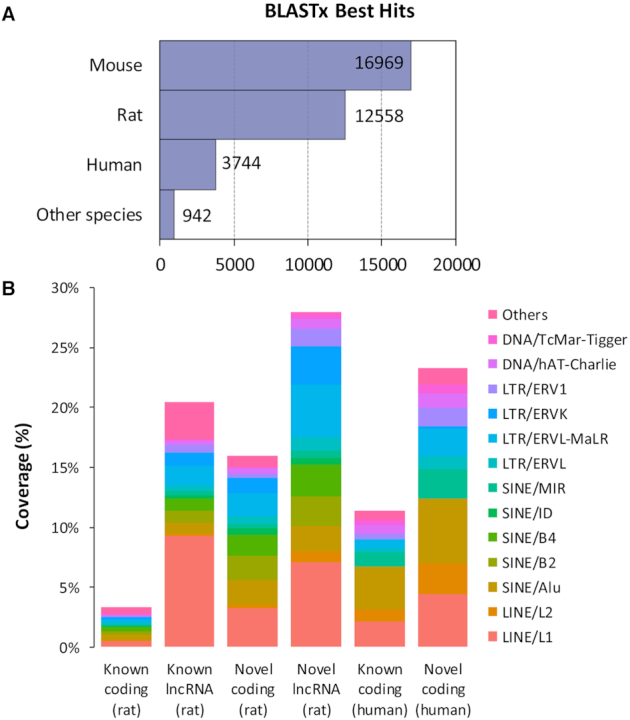
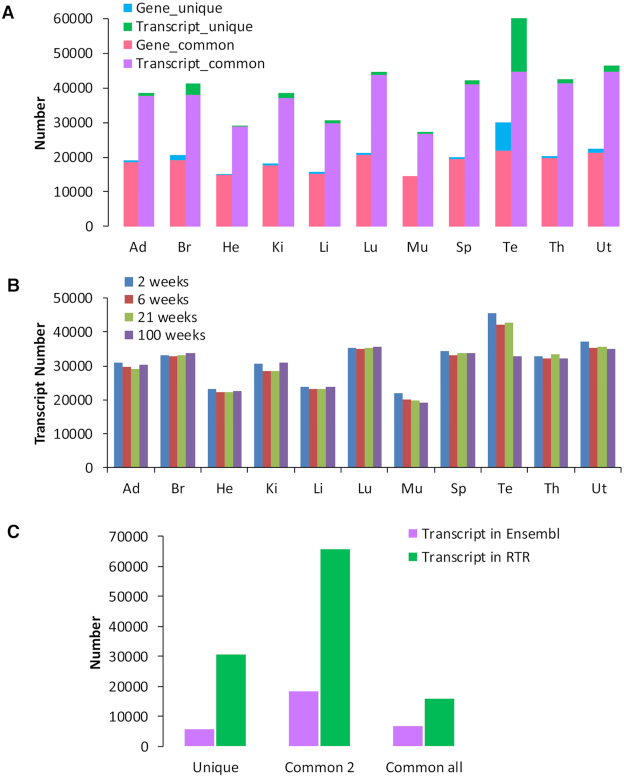
The rat is an important model organism in biomedical research for studying human disease mechanisms and treatments, but its annotated transcriptome is far from complete. We constructed a Rat Transcriptome Re-annotation named RTR using RNA-seq data from 320 samples in 11 different organs generated by the SEQC consortium. Totally, there are 52 807 genes and 114 152 transcripts in RTR. Transcribed regions and exons in RTR account for ∼42% and ∼6.5% of the genome, respectively. Of all 73 074 newly annotated transcripts in RTR, 34 213 were annotated as high confident coding transcripts and 24 728 as high confident long noncoding transcripts. Different tissues rather than different stages have a significant influence on the expression patterns of transcripts. We also found that 11 715 genes and 15 852 transcripts were expressed in all 11 tissues and that 849 house-keeping genes expressed different isoforms among tissues. This comprehensive transcriptome is freely available at http://www.unimd.org/rtr/. Our new rat transcriptome provides essential reference for genetics and gene expression studies in rat disease and toxicity models.


Figures

Figure 1.
Figure 1.
(A) The number of genes with different isoforms. Each block in a bar corresponds to the number of genes with multiple isoforms. Three transcriptomes were compared, from left to right: RTR, Rat Ensembl release and Mouse Ensembl release. (B) The distribution of AS events in RTR.
Figure 2.
Figure 2.
TSS and TTS characterization in RTR. (A) ChIP-seq data enrichment for H3K4me3 from male liver at 9 weeks at 10-kb intervals surrounding expressed TSSs (FPKM > 0.5) in male liver at 6 weeks in RTR. (B) Hexamer polyA signal (AATAAA, ATTAAA) enrichment in the upstream 100 bp of TTSs in RTR.
Figure 3.
Figure 3.
Cross-species feature comparision of transcripts with high confidence in RTR. (A) The species distribution of the best BLASTx hits of newly annotated coding transcripts with high confidence in RTR. (B) Repetitive content analysis between RTR and human in Ensembl. Sequence-based overlap between exons and TEs was calculated.
Figure 4.
Figure 4.
Expression analysis among tissues. (A) The distribution of genes and transcripts among tissues. Blue bar means the gene number uniquely expressed in the corresponding tissue. Pink bar means the number of genes not only expressed in the corresponding tissue but also expressed in at least one other tissue. The aggregate length of blue bar and pink bar is the number of genes expressed in the corresponding tissue. The format of gene information shown in the figure is the same as the one of transcript information. Tissues studied are: Ad, adrenal; Br, brain; He, heart; Ki, kidney; Lu, lung; Li, liver; Mu, skeletal muscle; Sp, spleen; Th, thymus; Te, testis; and Ut, uterus. (B) The distribution of transcripts under all of the 44 conditions. (C) The statistics of transcripts from Ensembl and RTR according to tissues. ‘Common 2’ denotes the transcripts that were identified in at least two tissues. ‘Common all’ denotes the transcripts that were identified in all of the 11 tissues.
Figure 5.
Figure 5.
Spearman's correlation coefficients of gene abundance between all organs at 21 weeks in male (A) and female (B) rats, respectively. Numbers of differential AS events (C) and the corresponding genes (D) between male and female rats for all nine non-sex organs at 21 weeks.

References

    1. Barrett T., Edgar R.. Mining microarray data at NCBI’s Gene Expression Omnibus (GEO)*. Methods Mol. Biol. 2006; 338:175–190. - PMC - PubMed
    1. Davis S., Meltzer P.S.. GEOquery: a bridge between the Gene Expression Omnibus (GEO) and BioConductor. Bioinformatics. 2007; 23:1846–1847. - PubMed
    1. Ji X.J., Feng G.S., Chen G., Shi T.L.. Lack of correlation between aristolochic acid exposure and hepatocellular carcinoma. Sci. China Life Sci. 2018; 61:727–728. - PubMed
    1. Gustincich S., Sandelin A., Plessy C., Katayama S., Simone R., Lazarevic D., Hayashizaki Y., Carninci P.. The complexity of the mammalian transcriptome. J. Physiol. 2006; 575:321–332. - PMC - PubMed
    1. Pan Q., Shai O., Lee L.J., Frey B.J., Blencowe B.J.. Deep surveying of alternative splicing complexity in the human transcriptome by high-throughput sequencing. Nat. Genet. 2008; 40:1413–1415. - PubMed

Publication types