Case Reports
. 2020 Sep;7(9):1488-1501.
doi: 10.1002/acn3.51105. Epub 2020 Aug 4.

Functional and pharmacological evaluation of a novel SCN2A variant linked to early-onset epilepsy

Affiliations
Case Reports

Functional and pharmacological evaluation of a novel SCN2A variant linked to early-onset epilepsy

Scott K Adney et al. Ann Clin Transl Neurol. 2020 Sep.

Abstract

Objective: We identified a novel de novo SCN2A variant (M1879T) associated with infantile-onset epilepsy that responded dramatically to sodium channel blocker antiepileptic drugs. We analyzed the functional and pharmacological consequences of this variant to establish pathogenicity, and to correlate genotype with phenotype and clinical drug response.

Methods: The clinical and genetic features of an infant boy with epilepsy are presented. We investigated the effect of the variant using heterologously expressed recombinant human NaV 1.2 channels. We performed whole-cell patch clamp recording to determine the functional consequences and response to carbamazepine.

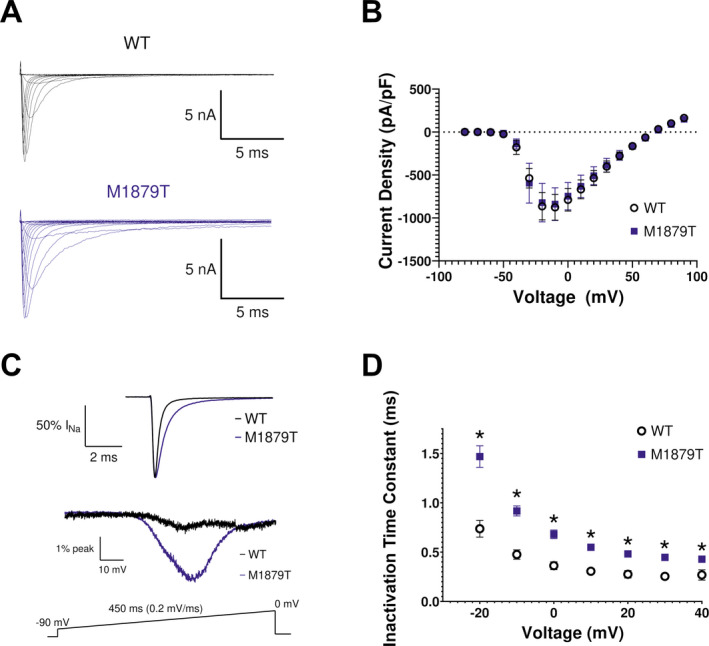
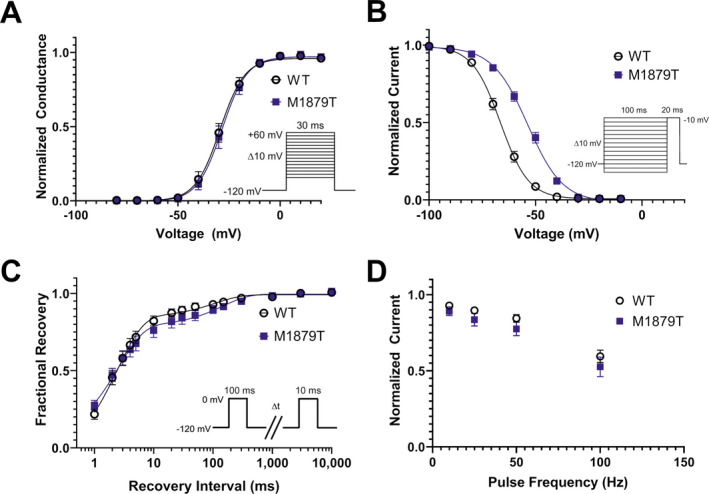
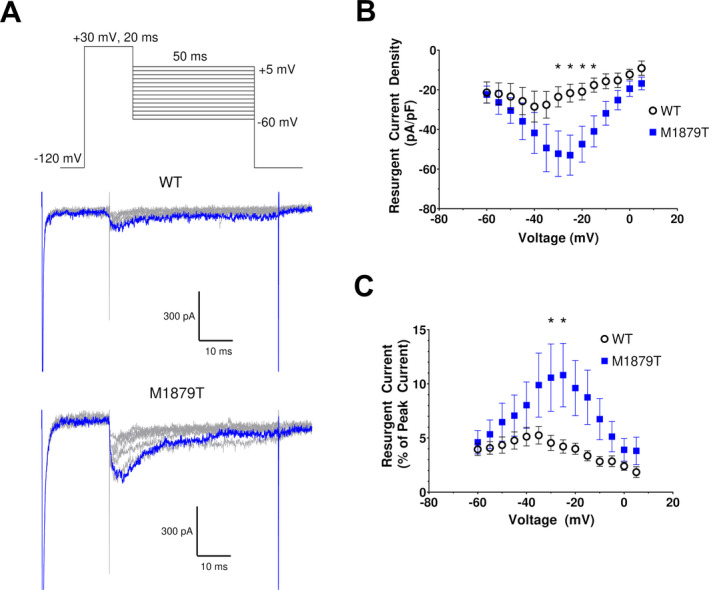
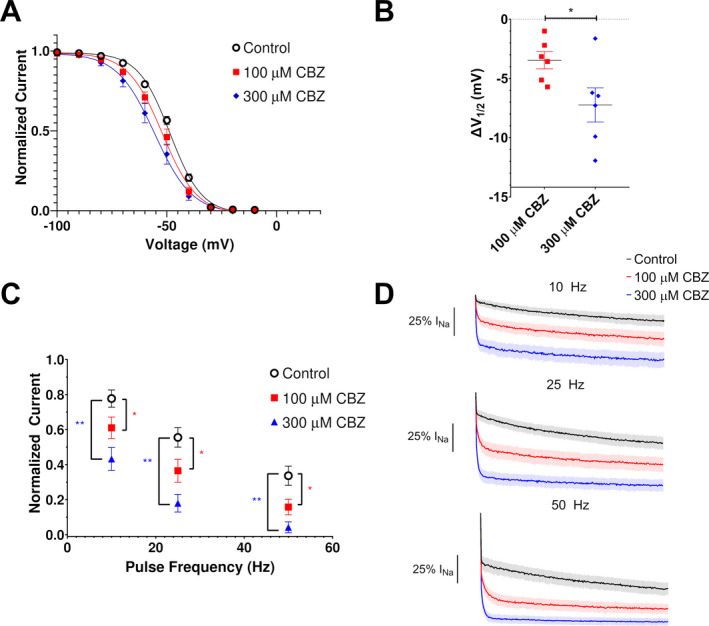
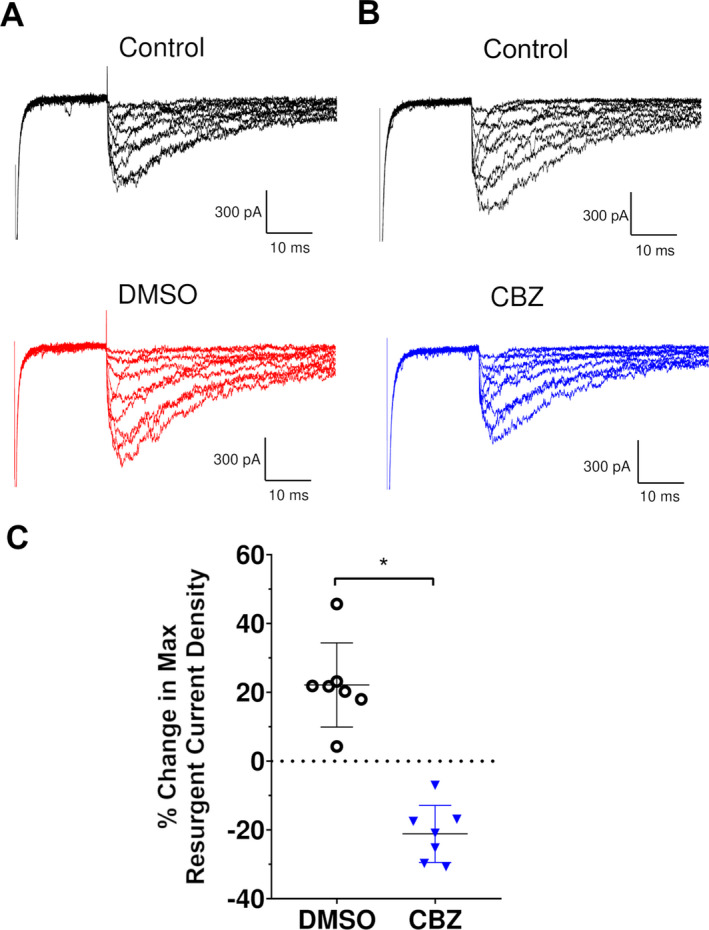
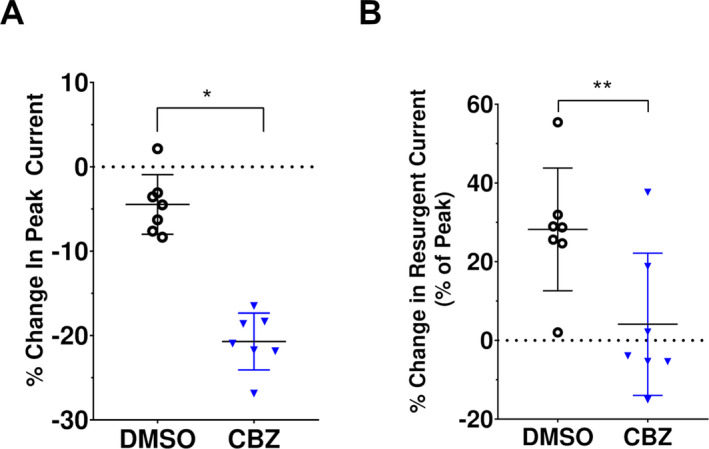
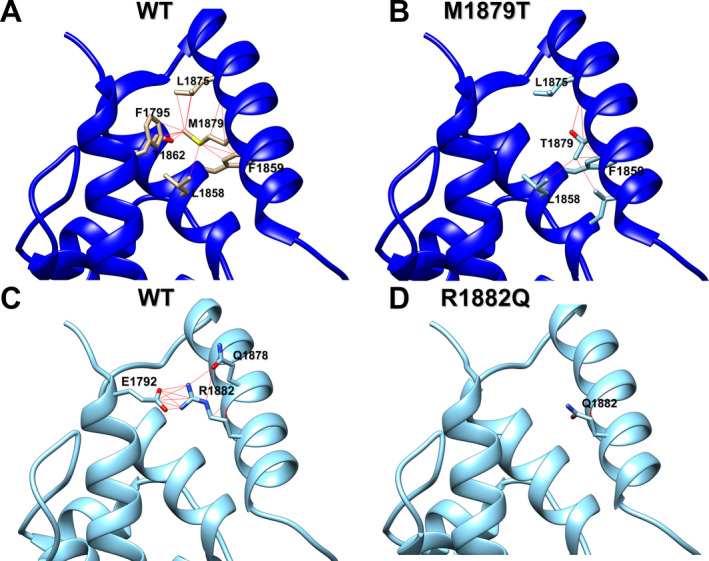
Results: The M1879T variant caused disturbances in channel inactivation including substantially depolarized voltage dependence of inactivation, slower time course of inactivation, and enhanced resurgent current that collectively represent a gain-of-function. Carbamazepine partially normalized the voltage dependence of inactivation and produced use-dependent block of the variant channel at high pulsing frequencies. Carbamazepine also suppresses resurgent current conducted by M1879T channels, but this effect was explained primarily by reducing the peak transient current. Molecular modeling suggests that the M1879T variant disrupts contacts with nearby residues in the C-terminal domain of the channel.

Interpretation: Our study demonstrates the value of conducting functional analyses of SCN2A variants of unknown significance to establish pathogenicity and genotype-phenotype correlations. We also show concordance of in vitro pharmacology using heterologous cells with the drug response observed clinically in a case of SCN2A-associated epilepsy.


Conflict of interest statement

Adney, DeKeyser, Abramova, and Thompson declare no conflicts of interest with the work described herein. Millichap reports personal fees from American Academy of Neurology, personal fees from Up‐To‐Date, grants from UCB Pharma, grants and personal fees from Mallinkrodt, personal fees from Esai, grants and personal fees from Xenon, personal fees from Biomarin, personal fees from Ionis, personal fees from Greenwich, personal fees from Sunovion, personal fees from Upsher‐Smith, grants from NIH, grants from Citizens United for Research in Epilepsy, personal fees from Praxis, outside the submitted work. George reports personal fees from Amgen, Inc., grants from Praxis Precision Medicines, Inc., outside the submitted work.

Figures

Figure 1
Figure 1
M1879T mutation alters NaV1.2 inactivation kinetics. (A) Representative current recordings from WT and M1879T NaV1.2 obtained using the voltage protocol shown in Figure 2A (inset). (B) Current density–voltage plot for WT (n = 18) and M1879T (n = 20) channels. (C) Top, average of six TTX‐subtracted recorded at 0 mV and normalized to peak current to highlight inactivation time‐course of WT (black) and M1879T (blue). Bottom, average currents for WT (black, average of 5) and M1879T (blue, average of 6) elicited using the voltage ramp protocol shown below. Traces were normalized to peak current measured at 0 mV. (D) Voltage dependence of inactivation time constants determined from single‐component exponential curve fits to the current decay. n = 14 for WT and n = 14 for M1879T, *P < 0.05 by Mann–Whitney U test.
Figure 2
Figure 2
M1879T affects voltage dependence of inactivation. (A) Voltage dependence of activation of WT (n = 14) and M1879T (n = 14) channels determined using the voltage protocol shown as an inset. There was no difference in activation V 1/2 between WT and M1879T (P = 0.51 by Mann–Whitney U test). (B) Voltage dependence of inactivation of WT (n = 18) and M1879T (n = 25) channels (voltage protocol shown as an inset). There was a significant depolarizing shift in inactivation V 1/2 (P < 0.0001 by Mann–Whitney U test). (C) Time course of recovery from inactivation after 100 msec depolarization (protocol shown as inset) comparing WT (n = 10) and M1879T (n = 10). There were no significant differences in time constants for recovery from inactivation between WT and M1879T (P > 0.05 by Mann–Whitney U test; Table 1). (D) Plot of residual current (comparing 300th pulse to 1st pulse) after repetitive pulsing to 0 mV at the indicated frequency (n = 7 for WT and n = 7 for M1879T). There were no significant differences between WT and M1879T at any frequency (P > 0.05 by Mann–Whitney U test).
Figure 3
Figure 3
M1879T exhibits enhanced resurgent current. (A) Top, voltage protocol for eliciting resurgent current. Middle (WT) and bottom (M1879T) panels show representative current traces using protocol above (10 mV voltage steps are illustrated). The blue trace represents the peak resurgent current elicited at −20 mV. (B) Voltage dependence of resurgent current density for WT (n = 7) and M1879T (n = 9) (*P < 0.05 by Mann–Whitney U test). (C) Plot of resurgent current expressed as % of peak transient current for WT and M1879T (*P < 0.05 by Mann–Whitney U test).
Figure 4
Figure 4
Effects of carbamazepine on M1879T channels. (A) Carbamazepine (CBZ) induces a hyperpolarizing shift of the voltage dependence of inactivation (n = 6). (B) Plot of change in inactivation V 1/2 in response to 100 and 300 µmol/L carbamazepine (n = 6; *P < 0.05 by paired t‐test). (C) Plot of residual current (comparing 300th pulse to 1st pulse) after 0 mV pulses at the indicated frequencies from a holding potential of −90 mV. There was a significant difference in residual current at 100 μmol/L (*) and 300 μmol/L (**) at 10, 25, and 50 Hz compared to the control value (P < 0.05, one‐way ANOVA with repeated measures and Dunnett’s post hoc test, n = 6). (D) Average time‐course of CBZ treated cells at 10 Hz (top), 25 Hz (middle), and 50 Hz (bottom).
Figure 5
Figure 5
Effect of carbamazepine on resurgent current. (A) Representative M1879T resurgent current traces before (top) and after DMSO (bottom) treatment. (B) Representative M1879T resurgent current before (top) and after CBZ (bottom) treatment. (C) Percent change in maximum resurgent current density, comparing DMSO and CBZ (n = 7; *P < 0.0001 by unpaired t test).
Figure 6
Figure 6
Comparison of carbamazepine effects on M1879T peak transient and resurgent current. (A) Percent change in peak transient current (DMSO: −4.5 ± 1.3% vs. CBZ: −20.7 ± 1.3%; n = 7 both groups; *P < 0.0001 by unpaired t test). (B) Percent change in resurgent current (as percent of peak transient current; DMSO: 28.2 ± 5.9% vs. CBZ: 4.1 ± 6.8% of peak, n = 7 for both groups; **P = 0.02 by unpaired t test).
Figure 7
Figure 7
Molecular modeling of M1879T and R1882Q channel contacts in NaV1.2 C‐terminal domain compared to WT. (A) Ribbon diagram of WT channel showing specific contacts between Met‐1879 and interacting residues (red lines). (B) Ribbon diagram of M1879T channel showing specific contacts between Thr‐1879 and interacting residues (red lines). (C) Ribbon diagram of WT channel showing specific contacts between Arg‐1882 and interacting residues (red lines). (D) Ribbon diagram of R1882Q channel showing specific contacts between Gln‐1882 and interacting residues (red lines). See Tables S1 and S2 for list of atomic contacts.

References

    1. Brunklaus A, Du J, Steckler F, et al. Biological concepts in human sodium channel epilepsies and their relevance in clinical practice. Epilepsia 2020;61:387–399. 10.1111/epi.16438 - DOI - PubMed
    1. Reynolds C, King MD, Gorman KM. The phenotypic spectrum of SCN2A‐related epilepsy. Eur J Paediatr Neurol 2020;24:117–122. 10.1016/j.ejpn.2019.12.016 - DOI - PubMed
    1. Musto E, Gardella E, Møller RS. Recent advances in treatment of epilepsy‐related sodium channelopathies. Eur J Paediatr Neurol 2020;24:123–128. 10.1016/j.ejpn.2019.12.009 - DOI - PubMed
    1. Ben‐Shalom R, Keeshen CM, Berrios KN, et al. Opposing effects on NaV1.2 function underlie differences between SCN2A variants observed in individuals with autism spectrum disorder or infantile seizures. Biol Psychiatry 2017;82:224–232. 10.1016/j.biopsych.2017.01.009 - DOI - PMC - PubMed
    1. Symonds JD, McTague A. Epilepsy and developmental disorders: next generation sequencing in the clinic. Eur J Paediatr Neurol 2020;24:15–23. 10.1016/j.ejpn.2019.12.008 - DOI - PubMed

Publication types