. 2020 Sep 3;27(3):366-382.e7.
doi: 10.1016/j.stem.2020.06.020. Epub 2020 Aug 3.

Inflammatory Signals Induce AT2 Cell-Derived Damage-Associated Transient Progenitors that Mediate Alveolar Regeneration

Affiliations

Inflammatory Signals Induce AT2 Cell-Derived Damage-Associated Transient Progenitors that Mediate Alveolar Regeneration

Jinwook Choi et al. Cell Stem Cell. .

Abstract

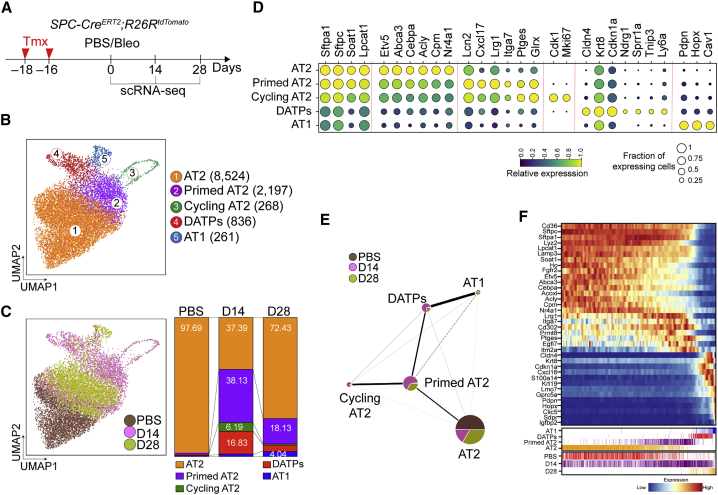
Tissue regeneration is a multi-step process mediated by diverse cellular hierarchies and states that are also implicated in tissue dysfunction and pathogenesis. Here we leveraged single-cell RNA sequencing in combination with in vivo lineage tracing and organoid models to finely map the trajectories of alveolar-lineage cells during injury repair and lung regeneration. We identified a distinct AT2-lineage population, damage-associated transient progenitors (DATPs), that arises during alveolar regeneration. We found that interstitial macrophage-derived IL-1β primes a subset of AT2 cells expressing Il1r1 for conversion into DATPs via a HIF1α-mediated glycolysis pathway, which is required for mature AT1 cell differentiation. Importantly, chronic inflammation mediated by IL-1β prevents AT1 differentiation, leading to aberrant accumulation of DATPs and impaired alveolar regeneration. Together, this stepwise mapping to cell fate transitions shows how an inflammatory niche controls alveolar regeneration by controlling stem cell fate and behavior.

Keywords: IL-1R1 and IL-1β; damage-associated transient progenitors; inflammation; lineage differentiation; lung stem cells; regeneration; stem cell fate; stem cell niche.


Conflict of interest statement

Declaration of Interests The authors declare no competing interests.

Figures

None
Graphical abstract
Figure 1
Figure 1
scRNA-Seq Reveals a Dynamic Lineage Trajectory from AT2 Cells to AT1 Cells during Alveolar Regeneration after Injury (A) Schematic of the experimental design for SPC lineage-labeled single cell isolation at the indicated time points after bleomycin injury. (B) Clusters of SPC lineage-labeled alveolar cells (12,086) from 10xGenomics 3′ single-cell RNA sequencing (scRNA-seq) analysis visualized by UMAP and assigned specific colors. The number of cells in the individual cluster is depicted. (C) Distribution of each cluster across the indicated time points after injury. (D) Gene expression of key markers in each distinctive cluster. (E) Network topology among clusters from single-cell data, revealed by partition-based graph abstraction (PAGA). Colors indicate the proportion of each cluster by time point. Each node in the PAGA graph represents a cluster, and the weight of the lines represents the statistical measure of connectivity between clusters. (F) Heatmap of gene expression profiles according to pseudotime trajectory. The lower color bars indicate cell types (top) and actual time (bottom). See also Figure S1.
Figure 2
Figure 2
IL-1β Signaling Directly Promotes Reprogramming of AT2 Cells (A) Schematic of organoid co-culture of SPC lineage-labeled AT2 cells (SPC+Tomato+) with interstitial macrophages (IMs) or alveolar macrophages (AMs) isolated from wild-type lung tissue in the presence of stromal cells. See also Figure S2. (B) Representative fluorescence images (left and center) and H&E staining (right) of AT2 organoids. GM-CSF was added to activate macrophages. Scale bars, 1,000 μm (left) and 50 μm (right). (C) Statistical quantification of colony formation efficiency and size of organoids. Each individual dot represents one experiment from one mouse, and data are presented as mean and SEM. ∗∗∗p < 0.001. (D) Representative fluorescence images (top) and H&E staining (bottom) of primary organoids derived from SPC lineage-labeled AT2 cells (SPC+Tomato+) treated with vehicle (PBS), IL-1β, or IL-18. Scale bars, 1,000 μm (top) and 50 μm (bottom). (E) Quantification of colony formation efficiency and size. Data are presented as mean and SEM. (F) UMAP visualization of cell clusters from scRNA-seq analysis of epithelial cells from control (1,286 cells) or IL-1β-treated organoids (10 ng/mL, 2,584 cells). Cells were isolated on day 21 in organoid culture. Colors indicate samples and distinct cell types. The number of cells in the individual cluster is depicted. See also Figure S3. (G) The percentage of each cluster in total cells of control or IL-1β-treated organoids. (H) Diffusion map according to diffusion pseudotime (DPT, left) order colored by sample (right). (I) qPCR analysis of genes that are upregulated (Itga7, Lrg1, and Orm1) or downregulated (Etv5, Abca3, Lpcat1, Fgfr2, and Acly) in primed AT2 cells. EpCAM+ epithelial cells were isolated from organoids treated with PBS or IL-1β on day 6 in AT2 organoid culture. Each individual dot represents one experiment, and data are presented as mean ± SEM. ∗∗p < 0.01, ∗∗∗p < 0.001. (J) Representative immunofluorescence (IF) images showing generation of DATPs marked by Cldn4 and Krt8 expression in AT2 organoids treated with IL-1β: SPC (white), Cldn4 (red), Krt8 (green), and DAPI (blue). Scale bars, 50 μm. (K) Flow cytometry analysis of DATPs by gating with Cldn4 and EpCAM. Data are presented as mean ± SEM (n = 5). ∗∗∗p < 0.001.
Figure 3
Figure 3
Injury Response-Specific DATPs Are Derived from AT2 Cells and Mediate AT1 Lineage Differentiation (A) Schematics of the experimental design for SPC lineage-tracing analysis using SPC-CreERT2;R26RtdTomato mice at the indicated time points after bleomycin injury. (B) Representative IF images showing derivation of DATPs from AT2 lineage-labeled cells on day 14 after injury: Tomato (red), SPC (white), and Krt8 (green). The insets is shown magnified on the right. Arrowheads point to lineage-labeled Krt8+DATPs that do not express the AT2 marker SPC. Scale bars, 50 μm. (C) Quantification of lineage-labeled SPC+ AT2 cells or Krt8+ DATPs on day 14 after injury. Each individual dot represents one section, and data are presented as mean ± SEM with three independent experiments (n = 4). (D) Representative IF images showing derivation of DATPs from AT2 lineage-labeled cells on day 14 after injury: Tomato (red) and Pdpn (white). Arrowheads point to lineage-labeled Krt8+ DATPs that do not express the AT1 marker Pdpn. Scale bars, 10 μm. (E) Experimental design for the Ndrg1 lineage-tracing analysis using Ndrg1-CreERT2;R26RtdTomato mice after bleomycin injury. Specific time points for tamoxifen injection and analysis are indicated. (F) Representative IF images showing that airway cells are not marked by Ndrg1 expression on day 9 after PBS (left) or bleomycin (right) treatment: Tomato (for the Ndrg1 lineage, red), CC10 (green, secretory cells), acetylated tubulin (acetyl-tub) (white, ciliated cells), and DAPI (blue). Insets (1, 2, and 3) show high-power views. (G) Representative IF images show that Ndrg1 expression does not label KRT8+ DATPs, SPC+ AT2 cells, or AGER+ AT1 cells on day 9 (top and center) and day 28 (bottom) after PBS treatment: Tomato (for the Ndrg1 lineage, red), Pdpn (white, top), SPC (white, center and bottom), Krt8 (green, top and center), and Ager (green, bottom). Scale bars, 50 μm. (H) Representative IF images showing derivation of Ndrg1 lineage-labeled DATPs that are negative for AT1 or AT2 markers but positive for Krt8 on day 9 after injury: Tomato (red), Pdpn (white, top), SPC (white, bottom), Krt8 (green), and DAPI (blue). Arrowheads points to lineage-labeled DATPs. Scale bars, 50 μm. (I) Statistical quantification of Krt8+Tomato+ cells at the indicated time points after PBS or bleomycin injury. Each individual dot represents one section, and data are presented as mean ± SEM (n = 2 PBS control, n = 3 for bleomycin). ∗∗∗p < 0.001. (J) Representative IF images showing differentiation of Ndrg1 lineage-labeled AT1 and AT2 cells on day 28 after injury: Tomato (red), SPC (white), Ager (green), and DAPI (blue). Arrowheads point to lineage-labeled Ager+ AT1 cells, and arrows point to lineage-labeled SPC+ AT2 cells. The insets (left) are shown magnified on the right. Scale bars, 50 μm (left) and 10 μm (right). (K) Statistical quantification of lineage-labeled Ager+Tomato+ AT1 cells at the indicated time points after PBS or bleomycin injury. Each individual dot represents one section, and data are presented as mean ± SEM (n = 2 PBS control, n = 3 bleomycin). ∗∗∗p < 0.001. (L) Statistical quantification of lineage-labeled SPC+Tomato+ AT2 cells at the indicated time points after PBS or bleomycin injury. Each individual dot represents one section, and data are presented as mean ± SEM (n = 2 PBS control, n = 3 bleomycin). ∗∗∗p < 0.001. See also Figure S4.
Figure 4
Figure 4
DATPs Induced by IL-1β-Driven Hif1α Signaling Are Essential Mediators of Alveolar Regeneration (A) Experimental design of lineage tracing of Il1r1-haplodeficient or deficient AT2 cells after bleomycin administration. (B) Representative IF images showing DATPs generation from SPC lineage-labeled cells on day 10 after injury in the indicated genotype: Tomato (for SPC lineage, red), SPC (white), Krt8 (green), and DAPI (blue). Scale bars, 50 μm. (C) Quantification of lineage-labeled Krt8+ DATPs on day 10 after injury. Each individual dot represents one section, and data are presented as mean ± SEM (n = 3). (D) Representative IF images showing AT1 cell differentiation from SPC lineage-labeled cells on day 21 after injury in the indicated genotype: Tomato (for SPC lineage, red), Pdpn (white), and DAPI (blue). Scale bar, 50 μm. See also Figure S5. (E) Quantification of lineage-labeled Pdpn+ AT1 cells on day 21 after injury. Each individual dot represents one section, and data are presented as mean ± SEM (n = 6). (F) Heatmap of the transcriptional profiles of genes that are associated with Hif1a-mediated signaling, including the glycolysis pathway, in the subset of clusters. (G) Schematic of an AT2 organoid culture treated with digoxin in the presence of IL-1β. (H) Representative IF images showing impaired generation of DATPs and the AT1 lineage in digoxin-treated organoids: SPC (white), Krt8 (top, green), Hopx (bottom, red), and DAPI (blue). Scale bars, 50 μm. See also Figure S6. (I) Quantification of the frequency of AT2 (SPC+) or AT1 (Hopx+) cells (left) and the ratio of AT1/AT2 (right). Each individual dot represents one experiment, and data are presented as mean ± SEM. ∗∗∗p < 0.001.
Figure 5
Figure 5
Il1r1+AT2 Cells Are Distinct Subsets that Generate DATPs during Alveolar Regeneration after Injury (A) Schematic of Il1r1-CreERT2 mice. (B) Experimental design for lineage tracing. Date for analysis are as indicated. (C) Representative IF images showing Il1r1 lineage-labeled cells only in ciliated cells (top), not in club cells (bottom), in uninjured airways on day 14 after two doses of tamoxifen injection: Tomato (for Il1r1 lineage, red), acetyl-tub (white), CC10 (white), and DAPI (blue). Scale bars, 50 μm. (D) Representative IF images showing Il1r1 lineage-labeled AT2 cells in the lungs of mice treated with the control (PBS) or bleomycin on day 14 after injury: Tomato (for Il1r1 lineage, red), SPC (white), and DAPI (blue). Arrowheads point to Il1r1 lineage-labeled SPC+ AT2 cells. Scale bars, 50 μm. (E) Quantification of Il1r1 lineage-labeled SPC+ AT2 cells in (C). Each individual dot represents one section, and data are presented as mean ± SEM with three independent experiments. ∗∗∗p < 0.001. (F) Representative IF images showing Ki67+ cells in lineage-labeled or unlabeled SPC+ AT2 cells on day 14 after injury: Tomato (for Il1r1 lineage, red), SPC (white), Ki67 (green), and DAPI (blue). Arrowheads points to Il1r1 lineage-labeled proliferating AT2 cells. Scale bars, 50 μm. (G) Quantification of Ki67+ AT2 cells in lineage-labeled or unlabeled SPC+ cells. Each individual dot represents one section, and data are presented as mean ± SEM with three independent experiments. ∗∗∗p < 0.001. (H) Representative IF images showing Il1r1 lineage-labeled DATPs on day 14 after injury: Tomato (for Il1r1 lineage, red), Krt8 (green), and DAPI (blue). Arrowheads points to Il1r1 lineage-labeled DATPs. Insets (left) show high-power views (right top). Scale bars, 50 μm. (I) Quantification of Il1r1 lineage-labeled DATPs on day 14 after bleomycin injury. Each individual dot represents one section, and data are presented as mean ± SEM of three independent experiments. (J) Representative IF images showing Il1r1 lineage-labeled AT1 cells on day 28 after injury: Tomato (for Il1r1 lineage, red), SPC (white), Ager (green), and DAPI (blue). Scale bars, 50 μm.
Figure 6
Figure 6
Il1r1+AT2 Cells Possess a Chromatin Architecture that Enables a Rapid Response to Injury (A) ATAC-seq heatmap (top) and Venn diagrams (bottom) showing genome-wide regions of differential open chromatin peaks in Il1r1+AT2 versus bulk AT2 cells in duplicates. The values correspond to the peak signal distribution around TSSs (transcription start sites). The numbers of nearest neighbor genes covered by peaks are indicated. (B) GO enrichment analysis of the nearest neighbor genes in the vicinity of peaks shared between Il1r1+AT2 and bulk AT2 cells. (C) GO enrichment analysis of the nearest neighbor genes in the vicinity of Il1r1+AT2 peaks. (D) Snapshots of genomic loci in which the chromatin-accessible peaks are specifically opened in Il1r1+AT2 cells, identified by the GO enrichment analysis shown in (C). (E) Transcription factor motif enrichment within Il1r1+AT2-specific peaks or peaks shared between Il1r1+AT2 and bulk AT2 cells. See also Figure S7.
Figure 7
Figure 7
The Glycolysis Pathway, Driven by IL-1β, Prevents DATPs from Converting into Terminally Mature AT1 Cells (A–C) Violin plots showing the log-transformed (log10(TPM+1)), normalized expression levels of early AT1 (A), late AT1 (B), and DATP (C) marker genes in DATPs or control or IL-1β-treated AT1 cells, as revealed by scRNA-seq analysis of organoids. (D) Schematic of an AT2 organoid culture treated with or without IL-1β. (E) qPCR analysis of mature AT1 markers on isolated epithelial cells from AT2 organoids. Date are presented as mean ± SEM of four biological replicates from two independent experiments. p < 0.05, ∗∗p < 0.01, ∗∗∗p < 0.001. (F) Schematic of an AT2 organoid culture treated with or without 2-deoxy glucose (2-DG) in the presence of IL-1β. (G) qPCR analysis of mature AT1 markers on isolated epithelial cells from AT2 organoids. Each individual dot represents one experiment, and data are presented as mean ± SEM. p < 0.05, ∗∗p < 0.01, ∗∗∗p < 0.001. (H) Representative IF images showing rescued maturation of AT1 cells in 2-DG-treated organoids in the presence of IL-1β: SPC (white), Hopx (top, red), Cav-1 (bottom, red), and DAPI (blue). Scale bars, 50 μm. (I) Representative IF images of a KRT8+CLDN4+ DATP-like population in lungs from normal donors (n = 3): HTII-280 (red), CLDN4 (white), KRT8 (green) and DAPI (blue). Scale bar, 50 μm. See also Figure S7. (J) Representative IF images of a KRT8+CLDN4+ DATP-like population in lungs from IPF patients (n = 5). HTII-280 (red), CLDN4 (white), KRT8 (green), and DAPI (blue). Scale bars, 50 μm. (K) High-power view of the insets in (J): HTII-280 (red), CLDN4 (white), KRT8 (green), and DAPI (blue). Scale bar, 50 μm.

Comment in

References

    1. Adams T.S., Schupp J.C., Poli S., Ayaub E.A., Neumark N., Ahangari F., Chu S.G., Raby B.A., DeIuliis G., Januszyk M. Single Cell RNA-seq reveals ectopic and aberrant lung resident cell populations in Idiopathic Pulmonary Fibrosis. bioRxiv. 2019 doi: 10.1101/759902. - DOI - PMC - PubMed
    1. Adamson I.Y., Bowden D.H. The type 2 cell as progenitor of alveolar epithelial regeneration. A cytodynamic study in mice after exposure to oxygen. Lab. Invest. 1974;30:35–42. - PubMed
    1. Barkauskas C.E., Cronce M.J., Rackley C.R., Bowie E.J., Keene D.R., Stripp B.R., Randell S.H., Noble P.W., Hogan B.L. Type 2 alveolar cells are stem cells in adult lung. J. Clin. Invest. 2013;123:3025–3036. - PMC - PubMed
    1. Bolger A.M., Lohse M., Usadel B. Trimmomatic: a flexible trimmer for Illumina sequence data. Bioinformatics. 2014;30:2114–2120. - PMC - PubMed
    1. Buenrostro J.D., Wu B., Chang H.Y., Greenleaf W.J. ATAC-seq: A Method for Assaying Chromatin Accessibility Genome-Wide. Curr. Protoc. Mol. Biol. 2015;109:21.29.1–21.29.9. - PMC - PubMed

Publication types

LinkOut - more resources