. 2020 Jul 30;21(15):5431.
doi: 10.3390/ijms21155431.

Functional Alterations in the Olfactory Neuronal Circuit Occur before Hippocampal Plasticity Deficits in the P301S Mouse Model of Tauopathy: Implications for Early Diagnosis and Translational Research in Alzheimer's Disease

Affiliations

Functional Alterations in the Olfactory Neuronal Circuit Occur before Hippocampal Plasticity Deficits in the P301S Mouse Model of Tauopathy: Implications for Early Diagnosis and Translational Research in Alzheimer's Disease

Abdallah Ahnaou et al. Int J Mol Sci. .

Abstract

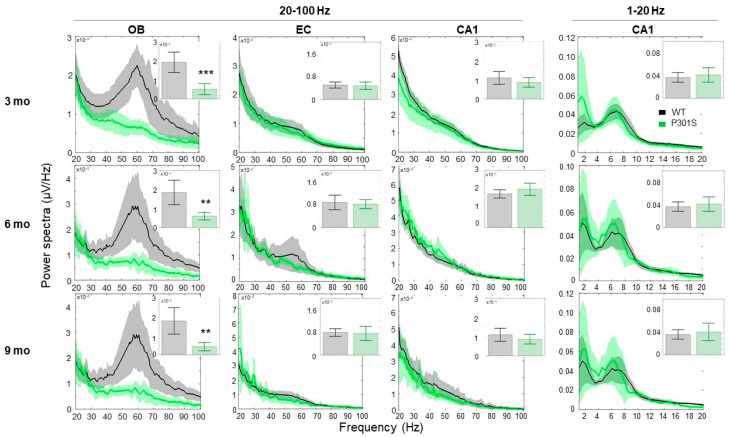
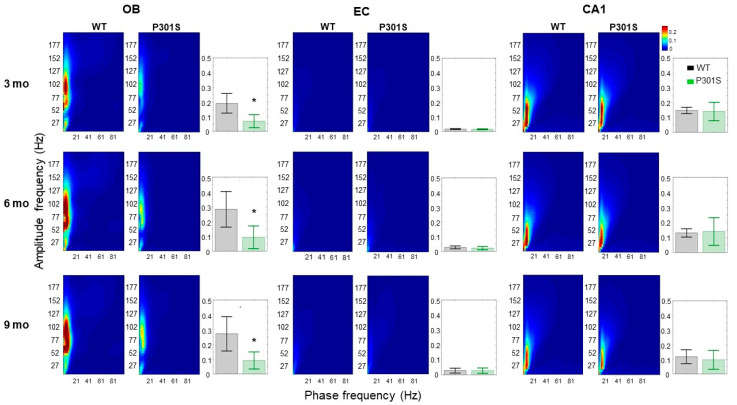
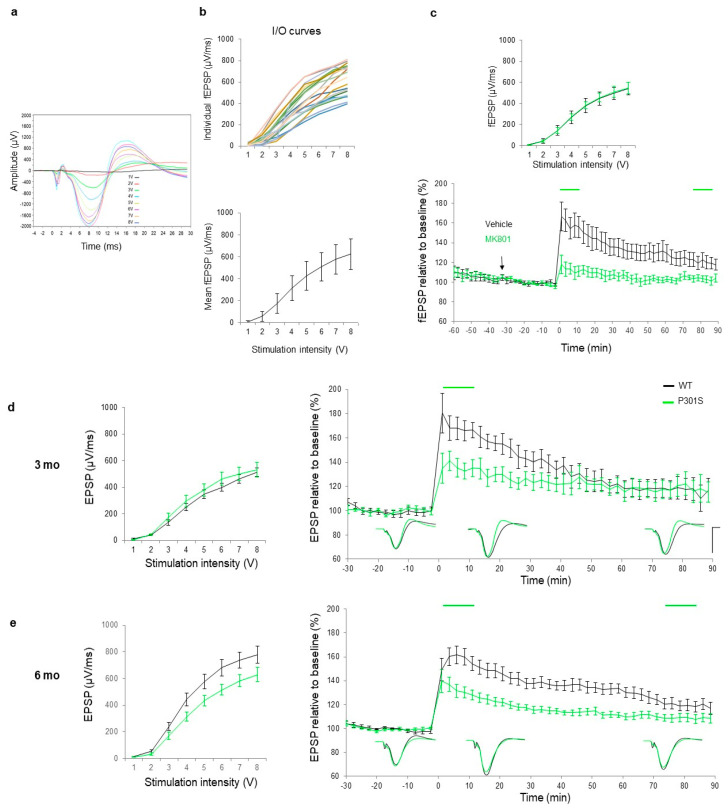
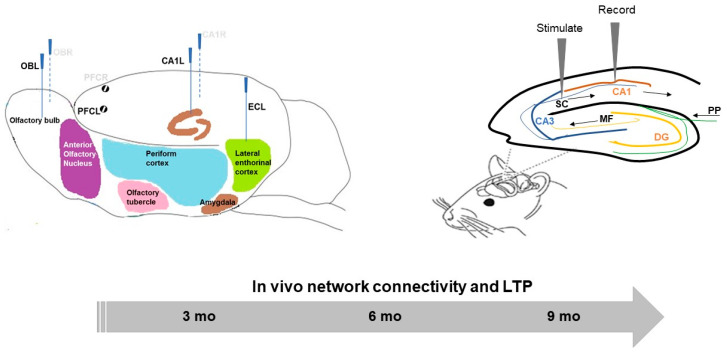
Alzheimer's disease (AD) is characterized by neuronal loss and impaired synaptic transmission, ultimately leading to cognitive deficits. Early in the disease, the olfactory track seems most sensitive to tauopathy, while most plasticity studies focused on the hippocampal circuits. Functional network connectivity (FC) and long-term potentiation (LTP), considered as the plasticity substrate of learning and memory, were longitudinally assessed in mice of the P301S model of tauopathy following the course (time and location) of progressively neurodegenerative pathology (i.e., at 3, 6, and 9 months of age) and in their wild type (WT) littermates. Using in vivo local field potential (LFP) recordings, early (at three months) dampening in the gamma oscillatory activity and impairments in the phase-amplitude theta-gamma coupling (PAC) were found in the olfactory bulb (OB) circuit of P301S mice, which were maintained through the whole course of pathology development. In contrast, LFP oscillatory activity and PAC indices were normal in the entorhinal cortex, hippocampal CA1 and CA3 nuclei. Field excitatory postsynaptic potential (fEPSP) recordings from the Shaffer collateral (SC)-CA1 hippocampal stratum pyramidal revealed a significant altered synaptic LTP response to high-frequency stimulation (HFS): at three months of age, no significant difference between genotypes was found in basal synaptic activity, while signs of a deficit in short term plasticity were revealed by alterations in the fEPSPs. At six months of age, a slight deviance was found in basal synaptic activity and significant differences were observed in the LTP response. The alterations in network oscillations at the OB level and impairments in the functioning of the SC-CA1 pyramidal synapses strongly suggest that the progression of tau pathology elicited a brain area, activity-dependent disturbance in functional synaptic transmission. These findings point to early major alterations of neuronal activity in the OB circuit prior to the disturbance of hippocampal synaptic plasticity, possibly involving tauopathy in the anomalous FC. Further research should determine whether those early deficits in the OB network oscillations and FC are possible mechanisms that potentially promote the emergence of hippocampal synaptic impairments during the progression of tauopathy.

Keywords: Alzheimer’s disease; LTP; neural oscillations; olfactory neural network; tau; translational marker.


Conflict of interest statement

The authors declare no conflict of interest.

Figures

Figure 1
Figure 1
Relative power spectra for frequencies of 20–100 Hz (left panels) of LFP recorded in left OB, EC, CA1 sites, and at frequencies of 1–20 Hz (right panels) for the CA1 site for P301S (green, n = 8) and their WT littermates (black, n = 7), at recording intervals of 3, 6, and 9 months. Insets indicate total relative power with significance between group difference (two-sample t-test) in the 20–100 Hz and 1–20 Hz frequency range in the left and right panels, respectively. Only left hemisphere data are displayed. Data are presented as mean (across animals) values and 95% confidence intervals. Asterisks indicate the presence of a significant difference between genotypes (two-sample t-test), ** p-value < 0.01, *** p-value < 0.001.
Figure 2
Figure 2
Heat maps showing the mean phase amplitude coupling (PAC) modulation index at the OB, EC, and CA1 recording electrodes for WT (left columns in each frame) and P301S (right columns in each frame) mice at recording months three, six and nine. As shown by the color scale, “hotter” colors indicate high coupling values while “colder” colors indicate low or no coupling. PAC values were computed as the average (across animals) PAC for the large window of phase frequency: 1–100 Hz, and amplitude frequency: 1–200 Hz. Bar Graphs show the mean (across animals) theta-gamma PAC (with 95% CI) at the OB, EC, and CA1 electrodes for P301S (green, n = 8) and their WT littermate mice (black, n = 7), where mean PAC index was estimated for phase 4–8 Hz and amplitude 40–100 Hz (e.g., theta-gamma coupling), and asterisks indicate the presence of a significant difference between genotypes (* p-value < 0.05).
Figure 3
Figure 3
(a) Spaghetti curves of 21BL/6J mice who’s maximum fEPSP values at 8 V stimulation lies between 400 and 900 µV/ms. (b) Mean basal synaptic excitability represented in collective input/output (I/O) curves of stimulation voltage and fEPSP slopes. (c) Collective I/O curves of ascending stimulation voltage show an overlap in fEPSP slope response indicating no significant difference in basal synaptic excitability prior treatment with MK801. (d) fEPSP slope relative to the baseline is plotted across time for each group (vehicle, black (n = 9) and MK-801, green (0.64 mg/kg, n = 9). I/O curve fEPSP values were displayed for both groups). A statistical significance (indicated by the green horizontal line on top of the corresponding time interval) was found in the STP response between the two groups during the first 10 min post tetanization (p = 0.003) and in the LTP response at time points 70–90 min post-tetanization (p = 0.02). (d) Collective I/O curves of stimulation voltage and fEPSP slope values relative to baseline are plotted across time for 3-month-old WT (black, n = 8) and P301S mice (green n = 8) and (e) 6-month-old WT (black, n = 11) and P301S mice (green, n = 10), respectively. At 3 months of age, deficits were observed in the STP response, whereas at 6 months of age, deficits were found in both STP and LTP responses. A trend of impaired baseline synaptic response appeared in 6-months-of-age mice. Data are presented as means ± SEM (%). Lines above indicate statistical significance between genotypes. Of note, comparable results were observed in 9-month-old P301S mice: these data are not shown due to a low remaining sample number caused by a high mortality (e.g., sensitivity to long-term anesthesia) rate in animals at this age.
Figure 4
Figure 4
Scheme showing on the left panel a placement of LFP recording electrodes (olfactory bulb: OB, prefrontal cortex: PFC, entorhinal cortex: EC, hippocampal CA1, left: L) in conscious, freely moving mice, and on the right panel a placement of the stimulation-recording path (Schaffer collateral-CA1 synapses) in anesthetized mice (DG: dentate gyrus, PP: perforant pathway, MF: mossy fiber, CA: hippocampal cornu ammonis).

References

    1. Lewczuk P., Mroczko B., Fagan A., Kornhuber J. Biomarkers of Alzheimer’s disease and mild cognitive impairment: A current perspective. Adv. Med. Sci. 2015;60:76–82. doi: 10.1016/j.advms.2014.11.002. - DOI - PubMed
    1. Shaw L.M., Vanderstichele H., Knapik-Czajka M., Figurski M., Coart E., Blennow K., Soares H., Simon A.J., Lewczuk P., Dean R.A., et al. Qualification of the analytical and clinical performance of CSF biomarker analyses in ADNI. Acta Neuropathol. 2011;121:597–609. doi: 10.1007/s00401-011-0808-0. - DOI - PMC - PubMed
    1. Clark C.M., Xie S., Chittams J., Ewbank D., Peskind E., Galasko D., Morris J.C., McKeel D.W., Farlow M., Weitlauf S.L., et al. Cerebrospinal fluid tau and beta-amyloid: How well do these biomarkers reflect autopsy-confirmed dementia diagnoses? Arch. Neurol. 2003;60:1696–1702. doi: 10.1001/archneur.60.12.1696. - DOI - PubMed
    1. Tapiola T., Alafuzoff I., Herukka S.K., Parkkinen L., Hartikainen P., Soininen H., Pirttilä T. Cerebrospinal fluid β-amyloid 42 and tau proteins as biomarkers of Alzheimer-type pathologic changes in the brain. Arch. Neurol. 2009;66:382–389. doi: 10.1001/archneurol.2008.596. - DOI - PubMed
    1. Hesse C., Rosengren L., Andreasen N., Davidsson P., Vanderstichele H., Vanmechelen E., Blennow K. Transient increase in total tau but not phospho-tau in human cerebrospinal fluid after acute stroke. Neurosci. Lett. 2001;297:187–190. doi: 10.1016/S0304-3940(00)01697-9. - DOI - PubMed