. 2020 Jul 30;21(15):5458.
doi: 10.3390/ijms21155458.

MicroRNA-Dependent Targeting of RSU1 and the IPP Adhesion Complex Regulates the PTEN/PI3K/AKT Signaling Pathway in Breast Cancer Cell Lines

Affiliations

MicroRNA-Dependent Targeting of RSU1 and the IPP Adhesion Complex Regulates the PTEN/PI3K/AKT Signaling Pathway in Breast Cancer Cell Lines

Yong-Chul Kim et al. Int J Mol Sci. .

Abstract

(1) Background: The microRNA (miR)-directed control of gene expression is correlated with numerous physiological processes as well as the pathological features of tumors. The focus of this study is on the role of miRs in the regulation of RSU1 and proteins in the IPP (integrin linked kinase, PINCH and parvin) complex. Because the IPP adaptor proteins link β integrins to actin cytoskeleton, and the RSU1 signaling protein connects the complex to the activation of cJun, ATF2 and the transcription of PTEN, their reduction by miRs has the potential to alter both adhesion and survival signaling. (2) Methods: Multiple database analyses were used to identify miRs that target RSU1 and PINCH1. miR transfection validated the effects of miRs on RSU1, PINCH1 and downstream targets in breast cancer cell lines. (3) Results: The miRs targeting RSU1 mRNA include miR-182-5p, -409-3p, -130a-3p, -221-3p, -744-5p and -106b-5p. Data show that miR-182-5p and -409-3p reduce RSU1, PINCH1 and inhibit the ATF2 activation of PTEN expression. miR-221-3p and miR-130a-3p target RSU1 and PINCH1 and, conversely, RSU1 depletion increases miR-221-3p and miR-130a-3p. (4) Conclusions: miRs targeting RSU1 and PINCH1 in mammary epithelial or luminal breast cancer cell lines reduced RSU1 signaling to p38 MAP kinase and ATF2, inhibiting the expression of PTEN. miR-221-3p, known to target PTEN and cell cycle regulators, also targets RSU1 and PINCH1 in luminal breast cancer cell lines.

Keywords: LIMS1; PINCH1; PTEN; RSU1; micro RNA.


Conflict of interest statement

The authors declare no conflict of interest. The funders had no role in the design of the study; in the collection, analyses, or interpretation of data; in the writing of the manuscript, or in the decision to publish the results. Disclaimer: The opinions expressed here are those of the authors and should not be construed as official policy or reflecting the views of the Uniformed Services University of the Health Sciences or the Department of the Navy, Army, Department of Defense, nor the U.S. Government.

Figures
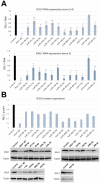
Figure 1
Figure 1
The validation of microRNAs (miRs) targeting RSU1 RNA and protein in MCF10A cells. (A). The miRs predicted to target RSU1 were transfected into MCF10A cells to determine the effect on the level of RSU1 RNA. RNA from cells transfected with miR-18b-5p, -27a-3p, -96-5p, -130a-3p, -135a-3p -150-5p, -182-5p, -200b-3p, -409-3p, -7-5p, -204-3p and -129-5p were compared to the RNA from control (non-targeting miR)-transfected cells for RSU1 RNA by quantitative real-time PCR using RSU1 primers for exons 2–4 (top panel) and exon 5 (lower panel). RSU1 KD is the transfection of RSU1-specific siRNA. Values represent the means from triplicate samples normalized to 18S ± S.D. * p < 0.05 and ** p < 0.01 versus control. Control RNA levels were set to 1. (B). An immunoblot analysis was performed with total lysates from the miR-transfected MCF10A cells to detect the levels of RSU1 expression by Western blot analysis. Note that the lysates from siRNA-mediated RSU1 depleted cells serve as the positive control for RSU1-targeting in the MCF10A cells. Blots were quantified as described in Materials and Methods and normalized to α-tubulin protein which served as an internal control. In the cases where the miR was transfected more than once (miR-200b-3p and miR-182-5p), both images are shown and the values for fold change were averaged.
Figure 2
Figure 2
Expression of miRs in breast cancer cell lines. miRs including miR-18b-5p, -130a-3p, -182-5p, -200b-3p, -409-3p, -7-5p, -106-5p, -774-5p and -221-3p were measured in breast cancer cells by TaqMan quantitative PCR. (A). RSU1 RNA levels were determined by real-time PCR using primers for exon 3–4. (B) The expression of miR-7-5p and -200-3p expression is high in luminal type breast cell lines ZR75-1 and MCF7. (C) miR-106-5p, -182-5p, -409-3p and -744-5p are moderate in luminal and basal cells. (D) The expression of miR-18b-5p, -130a-3p and -221-3p are higher in basal-like breast cancer cell lines. The expression level of the miRs was normalized to the expression of RNU6B, small nuclear RNA. Values represent the means from triplicate samples ± S.D. * p < 0.05 and ** p < 0.01 versus control. The MCF10A levels were set to 1.
Figure 3
Figure 3
Involvement of the p38 MAPK-PTEN signaling axis following miR-182-5p and miR-409-5p transfection in MCF10A cells. (A). The miR-182-5p and miR-409-5p were transfected into MCF10A cells to determine the effect on the levels of RSU1, PINCH1 and PTEN RNA by real-time PCR. Values represent the means from triplicate samples. The data show the means ± S.D., the respective control, n = 3. * p < 0.05 and ** p < 0.01 versus control. Control siRNA levels were set to 1. (B). An immunoblot analysis was performed to detect the levels of RSU1 and PTEN expression following siRNA-mediated RSU1 and PINCH1 depletion in MCF10A cells. α-tubulin protein served as the internal control. (C). Following siRNA-mediated RSU1 or PINCH1 depletion in MCF10A cells, the expression of miR-182-5p and miR-409-3p was measured by TaqMan real-time PCR. Values represent the means from triplicate samples normalized to the expression of RNU6B, small nuclear RNA. The data represent means ± S.D. * p < 0.05 and ** p < 0.01 versus control. Control siRNA levels were set to 1. (D). The viability of transfected cells was measured at 24 and 72 h post transfection as described in Materials and Methods. The data represent means ± S.D. * p < 0.05 and ** p < 0.01 versus control. (E). The activation of p38 MAPK-PTEN signaling targets was examined following the transfection of miR-182-5p and miR-409-5p in MCF10A cells. An immunoblot analysis was performed with total lysates to detect the levels of RSU1, PINCH1, PTEN, p -MKK4 (S257), p-p38 MAPK (T180/Y182), p-AKT (ser473) and p-ATF2 (T71) expression. The control siRNA and RSU1 siRNA depleted MCF10A cell lysates are included. α-tubulin protein served as an internal control.
Figure 4
Figure 4
The PI3K/AKT pathway regulates the expression of miR-182-5p in luminal ZR75-1 breast cancer cells. (A). RSU1, PINCH1, α-parvin and ILK RNA (upper panel) were determined by real-time PCR and protein levels were determined by Western blot analysis (lower panel) in ZR75-1 cells transfected with the antagomiR-182-5p at either 2 nM or 4 nM. Values represent means from triplicate samples. The data show the means ± S.D.* p < 0.05 and ** p < 0.01 versus control. Control levels were set to 1. The expression of miR-182-5p was reduced by 95% (2 nM) and 90% (4 nM) by the antagomir-182-5p compared to the non-targeting miR control. (B). Candidate target genes in ZR75-1 cells transfected with the antagomiR-182-5p at either 2 nM or 4 nM were analyzed by quantitative real-time PCR. The target genes were normalized to 18S RNA. Values represent the means from triplicate samples and data show the means ± S.D. of the respective control, n = 3. * p < 0.05 and ** p < 0.01 versus control. Control-transfected miR levels were set to 1. (C). Luminal ZR75-1 cells or basal-like MDA-MB-468 cells were treated with PI3K inhibitors, wortmannin (100 nM) and LY294002 (15 μM). The inhibition of p-AKT (ser473) was measured by Western blot analysis. The miR-182-5p expression was measured by TaqMan real-time PCR and normalized to the expression of by RNU6B, small nuclear RNA. Values represent the means from triplicate samples. The data show the means ± S.D., the respective control, n = 3. * p < 0.05 and ** p < 0.01 versus control. The control DMSO pretreatment levels were set to 1.
Figure 5
Figure 5
miR-221-3p and miR-130-3p target RSU1 and other candidate genes in MCF7 luminal breast cancer cells. (A) MCF7 cells were transfected with the mimic miR-221-3p or control miR. The RNA level of targets was measured by real-time PCR. RNAs include PTEN, p27, p57, PINCH1, PUMA, ILK, α-parvin, caveolin1, JNK1 and β4 integrin (left panel) and the protein levels were analyzed by Western blot analysis (right panel), including PTEN, p27, p57, PINCH1, PUMA, ILK, α-parvin, caveolin1, p-AKT, JNK1 and β4 integrin. RSU1 expression was used as a positive control. RNA values show the means from triplicate samples ± S.D. * p < 0.05 and ** p < 0.01 versus control. Negative control miR-transfected levels were set to 1. Note that the expression of miR-221-3p was increased >20-fold by mimic miR-221-3p compared to the non-targeting miR control in MCF7 cells. (B). The expression of miR-221-3p and miR-130a-3p was measured by real-time PCR in MCF7 cells depleted of RSU1 or PINCH1. The expression level of miRs was normalized to the expression of RNU6B, small nuclear RNA. Values represent the means from triplicate samples ± S.D. * p < 0.05 and ** p < 0.01 versus control. (C). Following the depletion of RSU1 in MCF7 cells, the expression of miR-221-3p and -130a-3p was measured by TaqMan real-time PCR and the target gene RNA was measured by quantitative real-time PCR. Values represent the means from triplicate samples. The data show the means ± S.D. * p < 0.05 and ** p < 0.01 versus control. Control siRNA levels were set to 1. (D) RSU1, PTEN, PINCH1, and PUMA RNA levels were determined by real-time PCR in MCF7 cells transfected with miR-130a-3p. Data were normalized to 18S. Values represent the means ± S.D. * p < 0.05 and ** p < 0.01 versus control. Negative control siRNA levels were set to 1. The changes in protein expression were examined by Western blot analysis. Results from the quantitation of the blots were normalized to tubulin and are expressed as a percentage of the negative control-transfected cells.
Figure 6
Figure 6
p38 MAPK activation does not regulate the expression of miR-130a-3p and miR-221-3p in MCF7 cells. (A). The expression level of miR-221-3p and -103a-3p was measured by TaqMan real-time PCR following the transfection of siRNAs for p38α MAPK, MKK4, MKK3, MKK6 into MCF7 cells. Values represent the means from triplicate samples ± S.D. * p < 0.05 versus control and control siRNA levels were set to 1. Western blot analysis shows the depletion of p38, MKK4, MKK3, 6 by siRNA in these cells. (B). MCF7 cells were pretreated with a p38 MAPK inhibitor, SB203580, for 1 h. The expression level of miR-221-3p and -103a-3p was measured by TaqMan real-time PCR. The expression level of miRs was normalized to the expression of by RNU6B, small nuclear RNA. Values represent means ± S.D. * p < 0.05 versus control. Control DMSO pretreatment levels were set to 1.
Figure 7
Figure 7
Schematic summary of the miR-targeting of RSU1. RSU1 depletion by miRs-182-5p and -409-3p decreases the phosphorylation of MKK4-p38-ATF signaling. miRs-221-3p and -130a-5p target RSU1 and PINCH1 and are increased by RSU1 and PINCH1 depletion. RSU1 plays an important role for the transcriptional regulation of the PTEN gene through the regulation of the promotor binding factors ATF2 or cJun, which are dependent on upstream activation by p38 MAPK and JNK, respectively. The active AKT phosphorylates MKK4 at ser80 and suppresses its activity and downstream p38 MAPK signaling.

References

    1. Rupaimoole R., Calin G.A., Lopez-Berestein G., Sood A.K. miRNA Deregulation in Cancer Cells and the Tumor Microenvironment. Cancer Discov. 2016;6:235–246. doi: 10.1158/2159-8290.CD-15-0893. - DOI - PMC - PubMed
    1. Di Leva G., Garofalo M., Croce C.M. MicroRNAs in cancer. Annu. Rev. Pathol. Mech. Dis. 2013;9:287–314. doi: 10.1146/annurev-pathol-012513-104715. - DOI - PMC - PubMed
    1. Weidle U.H., Dickopf S., Hintermair C., Kollmorgen G., Birzele F., Brinkmann U. The Role of micro RNAs in Breast Cancer Metastasis: Preclinical Validation and Potential Therapeutic Targets. Cancer Genomics Proteomics. 2018;15:17–39. doi: 10.21873/cgp.20062. - DOI - PMC - PubMed
    1. Wu C. PINCH, N(i)ck and the ILK: Network wiring at cell-matrix adhesions. Trends Cell Biol. 2005;15:460–466. doi: 10.1016/j.tcb.2005.07.002. - DOI - PubMed
    1. Horton E.R., Byron A., Askari J.A., Ng D.H.J., Millon-Fremillon A., Robertson J., Koper E.J., Paul N.R., Warwood S., Knight D., et al. Definition of a consensus integrin adhesome and its dynamics during adhesion complex assembly and disassembly. Nat. Cell Biol. 2015;17:1577–1587. doi: 10.1038/ncb3257. - DOI - PMC - PubMed

MeSH terms