. 2020 Jul 31;10(8):504.
doi: 10.3390/brainsci10080504.

Distinguishing and Biochemical Phenotype Analysis of Epilepsy Patients Using a Novel Serum Profiling Platform

Affiliations

Distinguishing and Biochemical Phenotype Analysis of Epilepsy Patients Using a Novel Serum Profiling Platform

Jay S Hanas et al. Brain Sci. .

Abstract

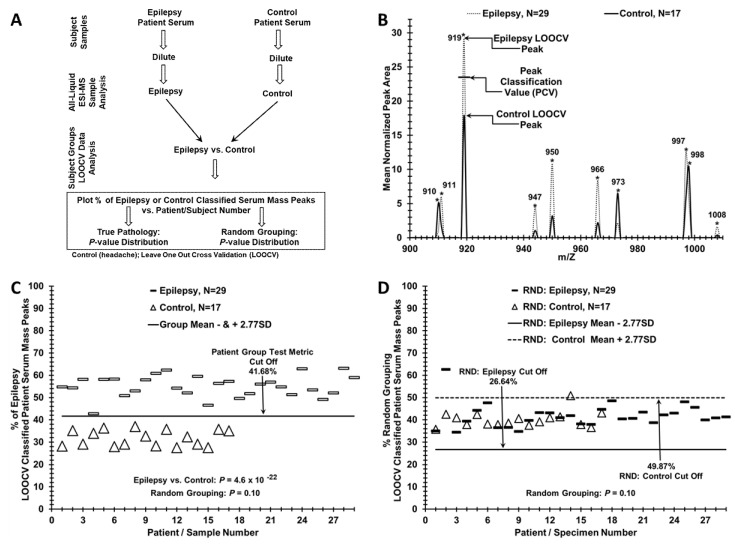
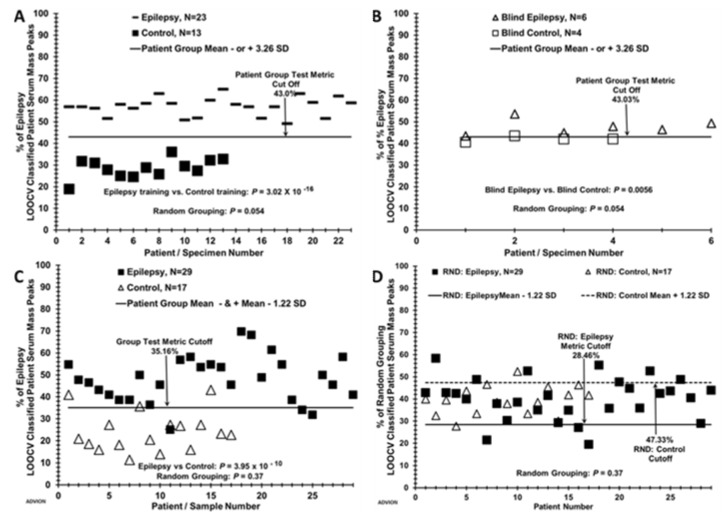
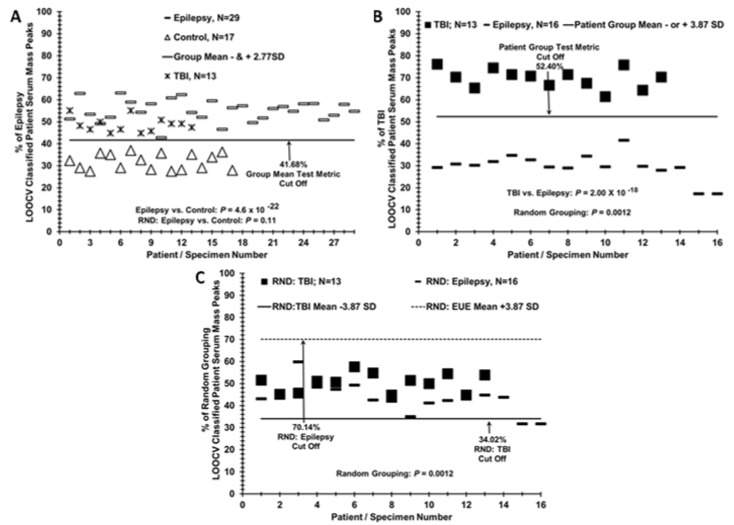
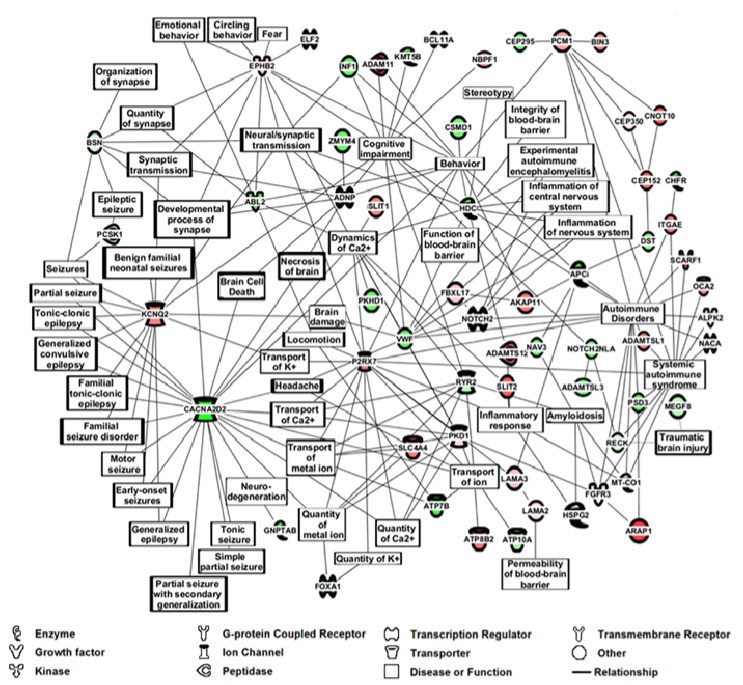
Diagnosis of non-symptomatic epilepsy includes a history of two or more seizures and brain imaging to rule out structural changes like trauma, tumor, infection. Such analysis can be problematic. It is important to develop capabilities to help identify non-symptomatic epilepsy in order to better monitor and understand the condition. This understanding could lead to improved diagnostics and therapeutics. Serum mass peak profiling was performed using electrospray ionization mass spectrometry (ESI-MS). A comparison of sera mass peaks between epilepsy and control groups was performed via leave one [serum sample] out cross-validation (LOOCV). MS/MS peptide analysis was performed on serum mass peaks to compare epilepsy patient and control groups. LOOCV identified significant differences between the epilepsy patient group and control group (p = 10-22). This value became non-significant (p = 0.10) when the samples were randomly allocated between the groups and reanalyzed by LOOCV. LOOCV was thus able to distinguish a non-symptomatic epilepsy patient group from a control group based on physiological differences and underlying phenotype. MS/MS was able to identify potential peptide/protein changes involved in this epilepsy versus control comparison, with 70% of the top 100 proteins indicating overall neurologic function. Specifically, peptide/protein sera changes suggested neuro-inflammatory, seizure, ion-channel, synapse, and autoimmune pathways changing between epilepsy patients and controls.

Keywords: epilepsy; mass spectrometry; monitoring; phenotype analysis; serum profiling.


Conflict of interest statement

The authors declare no conflict of interest. The funders had no role in the design of the study; in the collection, analyses, or interpretation of data; in the writing of the manuscript, or in the decision to publish the results.

Figures

Figure 1
Figure 1
Distinguishing Epilepsy vs. Control patients using leave one [serum sample] out cross-validation/ peak classification value (LOOCV/PCV) serum mass peak analysis. (A) Flow chart outlining the serum sample handling and mass spectrometry processing of the binary patient/subject group analysis. (B) Serum mass peak Scoring of the LOOCV/PCV (leave (one serum sample) out cross-validation/peak classification value) procedure used to classify mass peaks either as “epilepsy” or as “control” for a “left out” sample, (a limited sample range 900–1008 m/z is displayed) of significant group discriminatory mass peaks. The PCV example for the peak at 919 is exhibited and used to classify “left out” peaks as either “epilepsy” (peak area above this PCV) or control (peak area at or below this PCV). (C) Serum discrimination of epilepsy patients (dashes) from controls (triangles) by a % of LOOCV classified mass peaks. A cut off value is indicated (− or + SDs from the seizure or control groups respectively) to determine test metric values (e.g., true positives). (D) A lack of serum sample discrimination is demonstrated which results when the two different sample groups are mixed together randomly followed by the same LOOCV mass peak analysis.
Figure 2
Figure 2
Distinguishing blinded “left out” sera samples, and LOOCV with a lower cost desk top mass spectrometer. (A) Six blinded epilepsy and 4 control samples from each group were removed from the database and the remaining samples (N = 23 for epilepsy and 13 for control) were used as a training set. A % LOOCV classified mass peak group test metric cut-off of 43.0% was established 3.26 SD’s from each respective group mean as described in the methods. (B) Six blinded epilepsy samples and 4 control samples were LOOCV tested against the test metric cut off of 43.0% determined by the training group dataset. (C) Epilepsy patient and control % scores for the LOOCV dataset (N = 29 epilepsy and 17 control) obtained using a small-footprint, lower ion-resolution, and limited m/z range (200–1200) MS instrument (Advion, Inc.). Group test metric cut off is 35.16% with 1.22 SD. (D) Random LOOCV grouping of epilepsy patients and controls from panel C demonstrates lack of group separation (p value 0.37). A lower resolution and lower cost MS instrument than the LCQ Advantage (Expression CMS ESI-MS instrument, Advion, Inc.) performed reasonably well in distinguishing subjects of the epilepsy group (N = 29) as different from the control individual (N = 17) group (Figure 2, panels C,D). The mass analyzers in these two instruments have differing physics and electronics (ion trap vs. single quadrupole), and the group discriminatory p-value is larger for the CMS instrument (10−10) than the LCQ instrument (10−22). Whereas the LCQ had no false positives or false negatives, the CMS instrument resulted in three false positives and three false negatives, Figure 2C. The randomization p-value is higher with the CMS instrument vs. the LCQ instrument (0.37 vs. 0.10). These results do suggest a less accurate instrument with reduced m/z range can still detect enough mass spectral signal differences between these two groups. This ability strengthens the conclusions that the biomolecules observable in the serum and differing among the study groups could possibly help in the diagnosis and monitoring epilepsy.
Figure 3
Figure 3
Sera from TBI patients are more closely related to Epilepsy patients when compared to controls. (A) Segregation of TBI patient sera (Xs) with epilepsy sera (dashes) when both are LOOCV/PCV compared to control individual sera (triangles). (B) Distinguishing TBI patient sera from epilepsy patient sera when compared to each other directly by the LOOCV analysis. (C) Random LOOCV grouping of sera from epilepsy patients and TBI patients from panel B; demonstration of lack of group separation (p value 0.0012).
Figure 4
Figure 4
IPA m/z Range MS/MS Serum Data Analysis for Epilepsy Patients vs. Controls using top 100 Peptide/Proteins from Table 3 and Table 4. Ingenuity Pathway Analysis (IPA), (Qiagen, Inc.) of the 100 peptides/proteins exhibited in Table 3 and Table 4 having a 2× difference in positive sera number between epilepsy and controls, and a 1.5× difference in MS/MS “hit” (single peptide identification) ratio between the two groups. The protein function legend is at the bottom of the figure.

References

    1. Duncan J.S., Sander J.W., Sisodiya S.M., Walker M.C. Adult epilepsy. Lancet. 2006;367:1087–1100. doi: 10.1016/S0140-6736(06)68477-8. - DOI - PubMed
    1. Vezzani A., French J., Bartfai T., Baram T.Z. The role of inflammation in epilepsy. Nat. Rev. Neurol. 2011;7:31–40. doi: 10.1038/nrneurol.2010.178. - DOI - PMC - PubMed
    1. Kilany A., Raouf E.R., Gaber A.A., Aloush T.K., Aref H.A., Anwar M., Henshall D.C., Abdulghani M.O. Elevated serum Bcl-2 in children with temporal lobe epilepsy. Seizure. 2012;21:250–253. doi: 10.1016/j.seizure.2012.01.004. - DOI - PubMed
    1. Chang B.S., Lowenstein D.H. Epilepsy. N. Engl. J. Med. 2003;349:1257–1266. doi: 10.1056/NEJMra022308. - DOI - PubMed
    1. Fisher R.S., Acevedo C., Arzimanoglou A., Bogacz A., Cross J.H., Elger C.E., Engel J., Forsgren L., French J.A., Glynn M., et al. ILAE Official Report: A practical clinical definition of epilepsy. Epilepsia. 2014;55:475–482. doi: 10.1111/epi.12550. - DOI - PubMed

LinkOut - more resources