. 2020 Jul 31;21(15):5503.
doi: 10.3390/ijms21155503.

Persistent Human KIT Receptor Signaling Disposes Murine Placenta to Premature Differentiation Resulting in Severely Disrupted Placental Structure and Functionality

Affiliations

Persistent Human KIT Receptor Signaling Disposes Murine Placenta to Premature Differentiation Resulting in Severely Disrupted Placental Structure and Functionality

Franziska Kaiser et al. Int J Mol Sci. .

Abstract

Activating mutations in the human KIT receptor is known to drive severe hematopoietic disorders and tumor formation spanning various entities. The most common mutation is the substitution of aspartic acid at position 816 to valine (D816V), rendering the receptor constitutively active independent of ligand binding. As the role of the KIT receptor in placental signaling cascades is poorly understood, we analyzed the impact of KITD816V expression on placental development using a humanized mouse model. Placentas from KITD816V animals present with a grossly changed morphology, displaying a reduction in labyrinth and spongiotrophoblast layer and an increase in the Parietal Trophoblast Giant Cell (P-TGC) layer. Elevated differentiation to P-TGCs was accompanied with reduced differentiation to other Trophoblast Giant Cell (TGC) subtypes and by severe decrease in proliferation. The embryos display growth retardation and die in utero. KITD816V-trophoblast stem cells (TSC) differentiate much faster compared to wild type (WT) controls. In undifferentiated KITD816V-TSCs, levels of Phosphorylated Extracellular-signal Regulated Kinase (P-ERK) and Phosphorylated Protein Kinase B (P-AKT) are comparable to wildtype cultures differentiating for 3-6 days. Accordingly, P-TGC markers Placental Lactogen 1 (PL1) and Proliferin (PLF) are upregulated as well. The results reveal that KIT signaling orchestrates the fine-tuned differentiation of the placenta, with special emphasis on P-TGC differentiation. Appropriate control of KIT receptor action is therefore essential for placental development and nourishment of the embryo.

Keywords: KIT receptor; KITD816V; embryonic growth retardation; invasion; placental development; premature differentiation; spongiotrophoblast; trophoblast giant cell; trophoblast stem cell.


Conflict of interest statement

The authors declare no conflict of interest.

Figures

Figure 1
Figure 1
Detection of KITD816V-positive embryos and placentas: (A) qRT-PCR for transgene expression of human KIT in KITD816V and wildtype (WT) placentas obtained on E10.5 and (B) qRT-PCR for endogenous expression of murine Kit in KITD816V and WT placentas obtained on E10.5. RNA was obtained from at least three biological repeats. Expression is normalized to the housekeeping gene Gapdh. Bars display mean value ± SD. Significance was determined by unpaired t-test and indicated with *** p < 0.001. (C) Western Blot detecting KIT and 2A-peptide in placentas at E11.5 in comparison to β-ACTIN and (D) photographs showing KITD816V and WT expressing embryos and placentas at E11.5 in brightfield (BF) and GFP fluorescence (scale bar: 1 mm): Experiments were performed in at least tree biological repeats.
Figure 2
Figure 2
KITD816V shows a reduced number of KI-67-positive cells. (A,B) Immunohistochemical staining of paraffin sections of KITD816V and WT placentas for KI-67 at E9.5 and E10.5: Black arrowheads mark Parietal Trophoblast Giant Cells (P-TGCs) undergoing endoreduplication (biological replicates = 4; scale bar represents 500 μm).
Figure 3
Figure 3
Placental structure is grossly affected by KITD816V. (A) Photomicrographs of hematoxylin and eosin (H&E) staining of paraffin sections of KITD816V and WT placentas on E9.5 (biological replicates = 2) and E10.5 (biological replicates = 3): Black lines mark areas of the P-TGCs (P), spongiotrophoblast (S), and labyrinth layer (L). Scale bar represents 500 μm. (B) Quantification of P-TGC, spongiotrophoblast, and labyrinth areas at E10.5 compared to the total area of respective placenta (biological replicates = 3) and (C) quantification of number of P-TGCs in KITD816V and WT placenta at E10.5 using ImageJ in three biological replicates: Significance was determined by unpaired t-test and indicated with * p < 0.05. (D) qRT-PCR analysis of labyrinth-specific TGC marker Pl2, Ctsq, and Gcm in KITD816V and WT placentas at E10.5 and E11.5. RNA was obtained from at least three biological replicates. Expression is normalized to the housekeeping gene Gapdh. Bars display mean value ± SD. Significance was determined by unpaired t-test and indicated with * p < 0.05 and ** p < 0.01; (E) Immunohistochemical staining of CD31 on paraffin sections of KITD816V and WT placentas at E9.5 (biological replicates = 2) and E10.5 (biological replicates = 2): Red arrowheads indicate fetal endothelial cells enclosing fetal blood spaces, and black arrowheads indicate S-TGCs. Maternal sinusoids are indicated by red asterisks, and maternal blood in the P-TGC layer is indicated by black asterisks. Scale bar represents 200 μm.
Figure 4
Figure 4
Increased levels of PL1 and PLF in KITD816V placentas: (A) In situ hybridization of PL1 and PLF on paraffin sections of KITD816V and control placentas at E9.5 using specific probe for PL1 and PLF (biological replicates = 2). Scale bar represents 1 mm. (B) In situ hybridization of PL1 and PLF on paraffin sections of KITD816V and control placentas at E10.5 (biological replicates = 2): Red arrowheads indicate PL1/PLF+ cells. Black arrowhead indicates invading Spiral Artery (SpA-)TGCs. Scale bar represents 1 mm.
Figure 5
Figure 5
Differentiation of KITD816V-TSC: (A) Photomicrographs depicting in vitro differentiation of KITD816V-TSC line #3 and WT-TSC line 2.1 cultured for 0, 3, 6, and 9 days under differentiation conditions. White arrows indicate TGCs. Scale bar represents 250 μm. (B) qRT-PCR analysis of endogenous expression of Pl1, Pl2, and Plf in KITD816V-TSC line #3 and WT-TSC line 2.1 in undifferentiated states and after culture under differentiation conditions for 6 days. RNA was obtained from three biological replicates; expression was normalized to the housekeeping gene Gapdh. Data is represented by mean value ± SD. Significance was determined by unpaired t-test and indicated with * p < 0.05. (C) Western Blot detected phosphorylated Extracellular-Signal Regulated Kinase (ERK), Protein Kinase B (AKT), and Signal Transducers and Activators of Transcription 3 (STAT3) during differentiation of KITD816V-TSC line #3 and WT-TSC line 2.4 in comparison to β-ACTIN. (D) Representative photomicrographs of Hoechst-stained nuclei of cells that invaded through Matrigel coated filter membranes after five days under differentiating conditions: White arrows indicate nuclei of TGCs. Scale bar represents 250 μm. (E) Quantification of invaded cells per filter in KITD816V-TSC line and WT-TSC line (biological replicates = 2): Data is represented by mean value ± SD. Significance was determined by unpaired t-test and indicated with * p < 0.05.
Figure 6
Figure 6
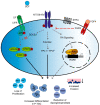
Proposed mechanism of KITD816V signaling in TSC: Schematic summary depicting possible signaling mechanisms that lead to KITD816V placental phenotype observed in this study. Independent of SCF binding, the KITD816V receptor is active. KIT inhibits SOCS3, thereby interrupting the negative feedback loop of Leukemia Inhibitory Factor (LIF) signaling resulting in accumulation of P-STAT3. Further, KIT signaling induces the expression of GATA2, which then transactivates PL1 and PLF. Independent of retinoic acid (RA) presence, KIT impinges on RA-controlled gene expression. Taken together, chronic KITD816V signaling results in severely diminished placental proliferation and reduction of spongiotrophoblast cells but increase in differentiation towards P-TGC and elevated invasion. In the presence of FGF4, Fibroblast Growth Factor Receptor (FGFR) signaling can override KIT-mediated signals. The black arrows indicate relations found in this study, whereas the gray and dashed arrows present hypothetical interactions, some of which have only been demonstrated in other cell types and T bars indicate repression.

Similar articles

Cited by

References

    1. Bazer F.W., Spencer T.E., Johnson G.A., Burghardt R.C., Wu G. Comparative aspects of implantation. Reproduction. 2009;138:195–209. doi: 10.1530/REP-09-0158. - DOI - PubMed
    1. Cockburn K., Rossant J. Making the blastocyst: Lessons from the mouse. J. Clin. Investig. 2010;120:995–1003. doi: 10.1172/JCI41229. - DOI - PMC - PubMed
    1. Woods L., Perez-Garcia V., Hemberger M. Regulation of Placental Development and Its Impact on Fetal Growth—New Insights From Mouse Models. Front. Endocrinol. 2018;9:570. doi: 10.3389/fendo.2018.00570. - DOI - PMC - PubMed
    1. Ashman L.K. The biology of stem cell factor and its receptor C-kit. Int. J. Biochem. Cell Biol. 1999;31:1037–1051. doi: 10.1016/S1357-2725(99)00076-X. - DOI - PubMed
    1. Chabot B., Stephenson D.A., Chapman V.M., Besmer P., Bernstein A. The proto-oncogene c-kit encoding a transmembrane tyrosine kinase receptor maps to the mouse W locus. Nature. 1988;335:88–89. doi: 10.1038/335088a0. - DOI - PubMed