. 2020 Aug 1;9(8):2472.
doi: 10.3390/jcm9082472.

GlycA Levels during the Earliest Stages of Rheumatoid Arthritis: Potential Use as a Biomarker of Subclinical Cardiovascular Disease

Affiliations

GlycA Levels during the Earliest Stages of Rheumatoid Arthritis: Potential Use as a Biomarker of Subclinical Cardiovascular Disease

Javier Rodríguez-Carrio et al. J Clin Med. .

Abstract

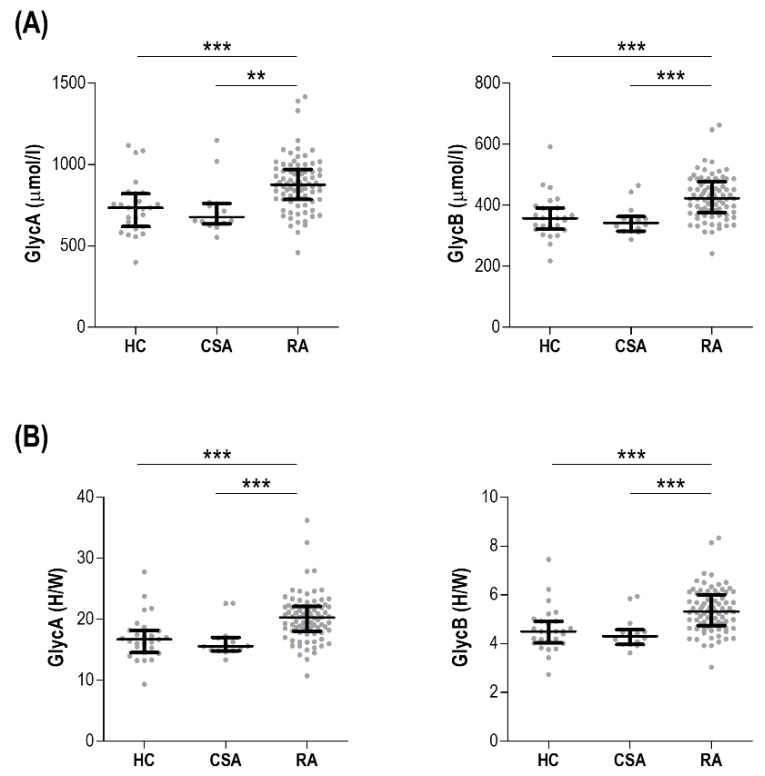
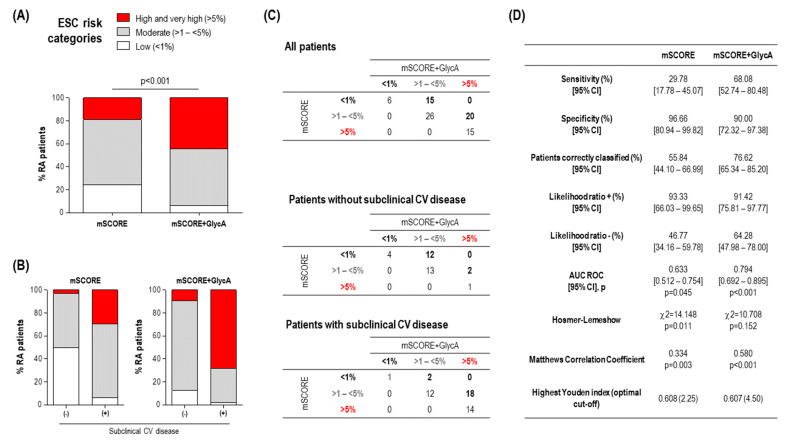
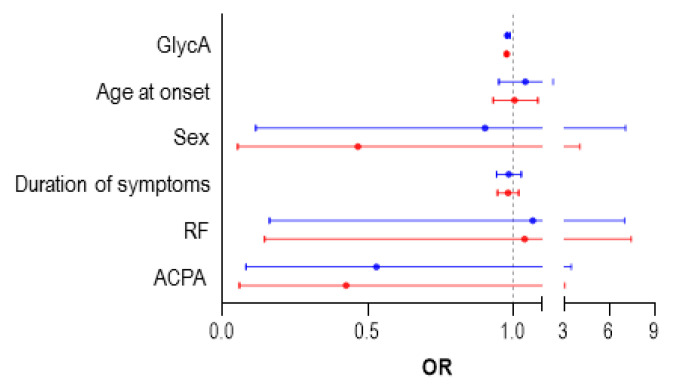
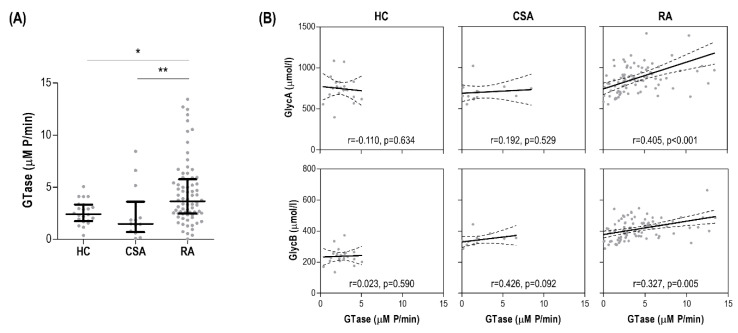
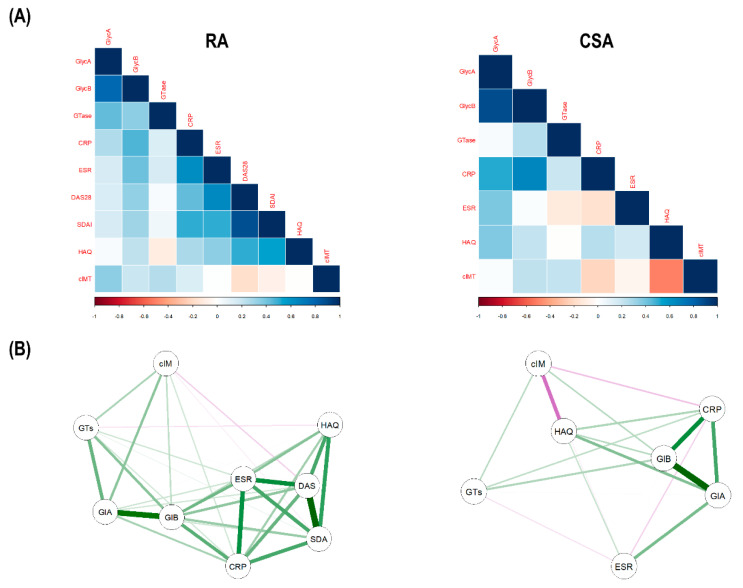
This study aimed at evaluating the clinical relevance of glycoprotein profiles during the earliest phases of rheumatoid arthritis (RA) as biomarkers of cardiovascular (CV) risk and treatment response. Then, GlycA and GlycB serum levels were measured using 1H-nuclear magnetic resonance in 82 early RA patients, 14 clinically-suspect arthralgia (CSA), and 28 controls. Serum glycosyltransferase activity was assessed by a colorimetric assay. Subclinical CV disease was assessed by Doppler-ultrasound. We found that GlycA and GlycB serum levels were increased in RA (both p < 0.001), but not in CSA, independently of cardiometabolic risk factors. Increased serum glycosyltransferase activity paralleled GlycA (r = 0.405, p < 0.001) and GlycB levels (r = 0.327, p = 0.005) in RA. GlycA, but not GlycB, was associated with atherosclerosis occurrence (p = 0.012) and severity (p = 0.001). Adding GlycA to the mSCORE improved the identification of patients with atherosclerosis over mSCORE alone, increasing sensitivity (29.7 vs. 68.0%) and accuracy (55.8 vs. 76.6%) and allowing reclassification into more appropriate risk categories. GlycA-reclassification identified patients with impaired lipoprotein metabolism. Finally, baseline GlycA levels predicted poor clinical response upon anti-rheumatic treatment at 6 and 12 months in univariate and multivariate analysis. In sum, increased GlycA levels during the earliest stage of RA can be considered a powerful biomarker for CV risk stratification and treatment response.

Keywords: H-NMR; atherosclerosis; cardiovascular risk; early rheumatoid arthritis; glycoproteins; inflammation.


Conflict of interest statement

The authors declare that the research was conducted in the absence of any commercial or financial relationships that could be construed as a potential conflict of interest. Amigó has a patent method for lipoprotein characterization licensed to Biosfer Teslab (Spain), of which she is a stock owner, a company that commercializes the lipoprotein and glycoprotein profiles described in the present manuscript. The funders had no role in study design, data analysis, interpretation, or decision to publish.

Figures

Figure 1
Figure 1
Comparative analyses of glycoprotein signals across study groups. Glycoprotein levels (GlycA and GlycB) measured as absolute levels (A) or height to width (H/W) ratios (B) were compared across healthy control (HC), clinically-suspect arthralgia (CSA) individuals, and early rheumatoid arthritis (RA) patients. Each dot depicts an individual, bars represent medians, and whiskers correspond to 25th and 75th percentiles. Differences were assessed by Kruskal–Wallis tests with Dunn–Bonferroni posthoc tests. The p-values from the latter were indicated as follows: ** p < 0.010 and *** p < 0.001.
Figure 2
Figure 2
GlycA improved CV risk stratification in early RA. (A) Adding GlycA to the mSCORE increased the proportion of early RA patients reaching the high and very high risk categories. Differences between groups were assessed by 2 test. (B) Adding GlycA to the mSCORE was shown to reclassify a considerable proportion of patients into a more appropriate CV risk group according to their subclinical CV disease status, compared with mSCORE alone. (C) Comparative analyses of the stratification based on risk groups of the mSCORE and mSCORE + GlycA. Numbers in the tables indicate the number of individuals according to each mSCORE/mSCORE + GlycA status. Numbers below or above the diagonal correspond to reclassified patients (highlighted in bold). (D) Comparative classification and calibration metrics for mSCORE and mSCORE + GlycA for the identification of patients with subclinical CV disease. Analyses were made according to the statistics presented in the first column. AUC ROC, area under the receiver operating characteristic curve.
Figure 3
Figure 3
Predictors of Disease Activity Score 28-joints (DAS28) remission in treatment-naïve RA patients. Forest plot showing the odds ratio (OR) and 95% confidence interval (CI) of the different predictors of DAS28 remission achievement at 6 (red) and 12 (blue) months in fully adjusted, multivariate regression models (Table 3). ACPA, Anti-citrullinated protein antibodies; RF, rheumatoid factor.
Figure 4
Figure 4
Glycoprotein signals and serum glycosyltransferase activity. (A) Glycosyltransfersase (GTase) activity was measured in serum samples and compared across groups. Differences were assessed by Kruskal–Wallis tests with Dunn–Bonferroni posthoc tests. The p-values from the latter were indicated as follows: * p < 0.050 and ** p < 0.010. (B) The associations between serum GTase (horizontal axis) and glycoprotein levels (vertical axis) in all the study groups were studied by correlation analyses (Spearman ranks’ tests) and indicated at the bottom of each graph.
Figure 5
Figure 5
Integrative analyses of glycoprotein profiles, glycosyltransferase activity, and inflammatory markers. (A) The correlations among glycoprotein levels (GlycA and GlycB), glycosyltransfersase activity (GTase), inflammatory parameters (CRP and ESR), disease indices (DAS28, Simplified Disease Activity Index (SDAI), and Health Assessment Questionnaire (HAQ)) and carotid intima-media thickness (cIMT) were plotted in correlation matrices. In these correlograms, the colour of the tiles is proportional to the strength of the correlation between each pair of variables, according to the legend at the bottom. Names of the variables are indicated in red. (B) Network analyses depicted based on the correlations among variables. Each node corresponds to a variable (GlA: GlycA, GlB: GlycB, GTs: GTase, cIM: cIMT, DAS: DAS28, SDA: SDAI) and the lines between nodes illustrate the strength (width) and type (green: positive, red: negative) of the correlations between each pair of nodes. The relative position of the nodes parallels its degree of correlation, that is, nodes more closely correlated locate closer to each other.

References

    1. Carubbi F., Alunno A., Gerli R., Giacomelli R. Post-Translational Modifications of Proteins: Novel Insights in the Autoimmune Response in Rheumatoid Arthritis. Cells. 2019;8:657. doi: 10.3390/cells8070657. - DOI - PMC - PubMed
    1. Marth J.D., Grewal P.K. Mammalian glycosylation in immunity. Nat. Rev. Immunol. 2008;8:874–887. doi: 10.1038/nri2417. - DOI - PMC - PubMed
    1. Schachter H., Freeze H.H. Glycosylation diseases: Quo vadis? Biochim. Biophys. Acta Mol. Basis Dis. 2009;1792:925–930. doi: 10.1016/j.bbadis.2008.11.002. - DOI - PMC - PubMed
    1. Ohtsubo K., Marth J.D. Glycosylation in Cellular Mechanisms of Health and Disease. Cell. 2006;126:855–867. doi: 10.1016/j.cell.2006.08.019. - DOI - PubMed
    1. Ceciliani F., Pocacqua V. The Acute Phase Protein α1-Acid Glycoprotein: A Model for Altered Glycosylation During Diseases. Curr. Protein Pept. Sci. 2007;8:91–108. doi: 10.2174/138920307779941497. - DOI - PubMed

LinkOut - more resources