. 2020 Oct;32(10):3188-3205.
doi: 10.1105/tpc.20.00245. Epub 2020 Aug 4.

The Tomato Guanylate-Binding Protein SlGBP1 Enables Fruit Tissue Differentiation by Maintaining Endopolyploid Cells in a Non-Proliferative State

Affiliations

The Tomato Guanylate-Binding Protein SlGBP1 Enables Fruit Tissue Differentiation by Maintaining Endopolyploid Cells in a Non-Proliferative State

Constance Musseau et al. Plant Cell. 2020 Oct.

Abstract

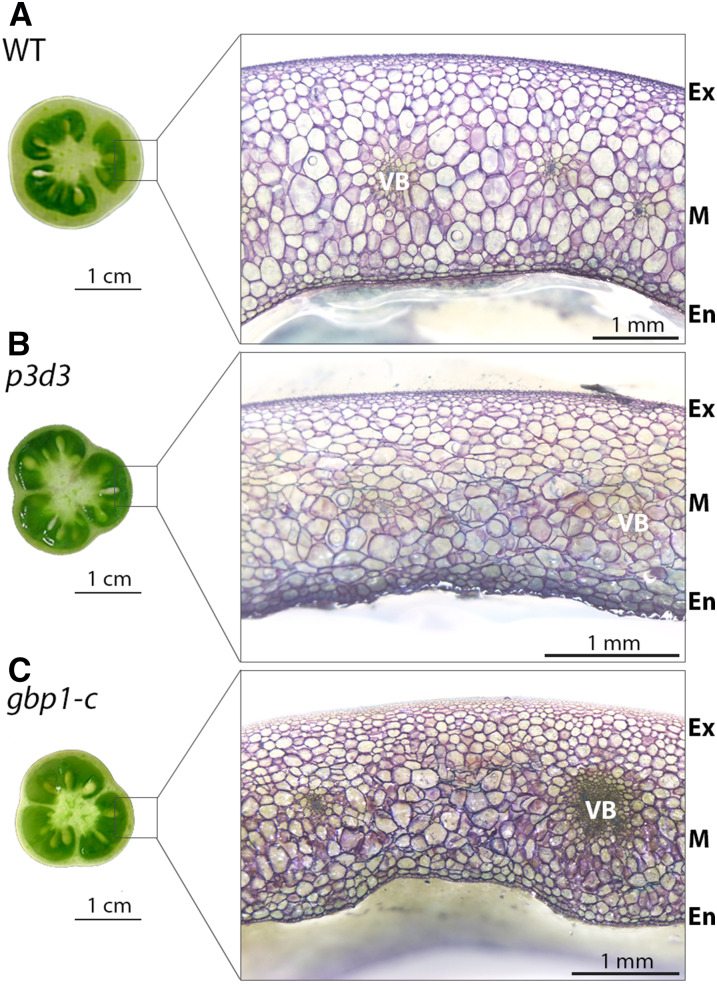
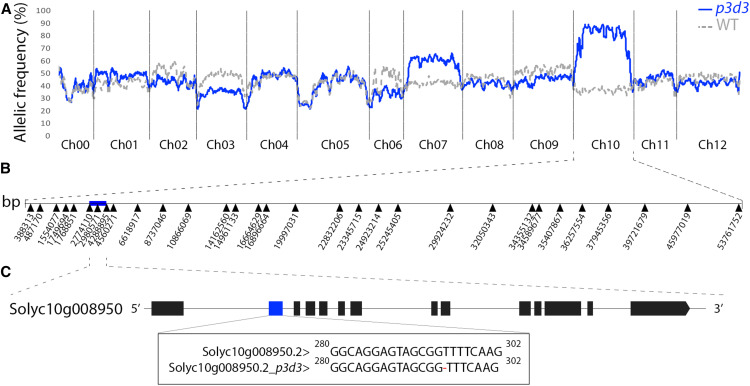
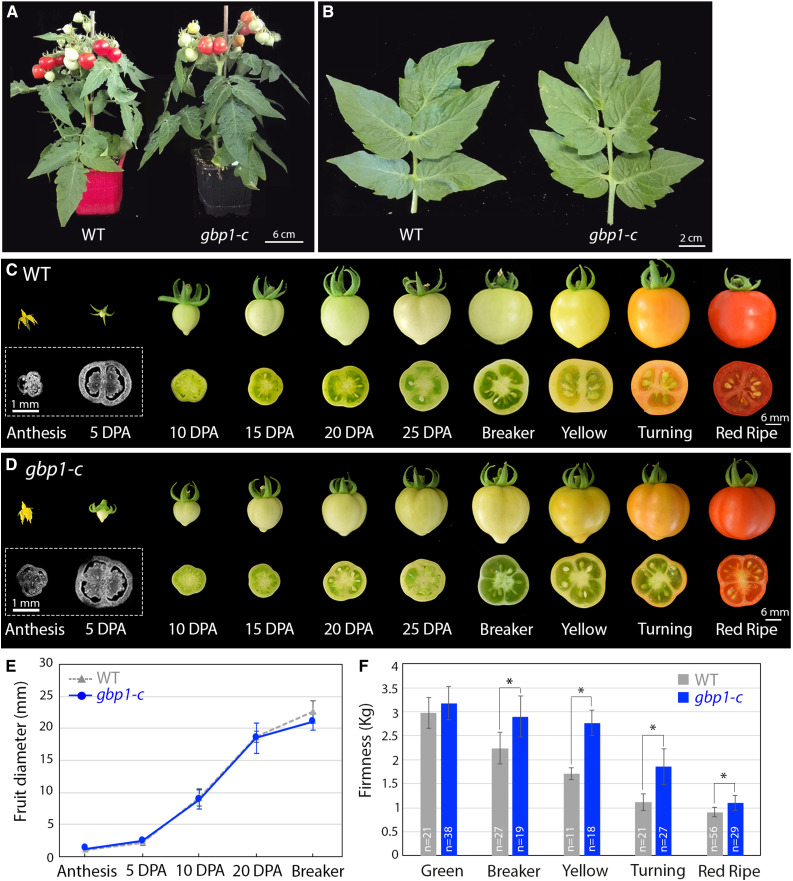
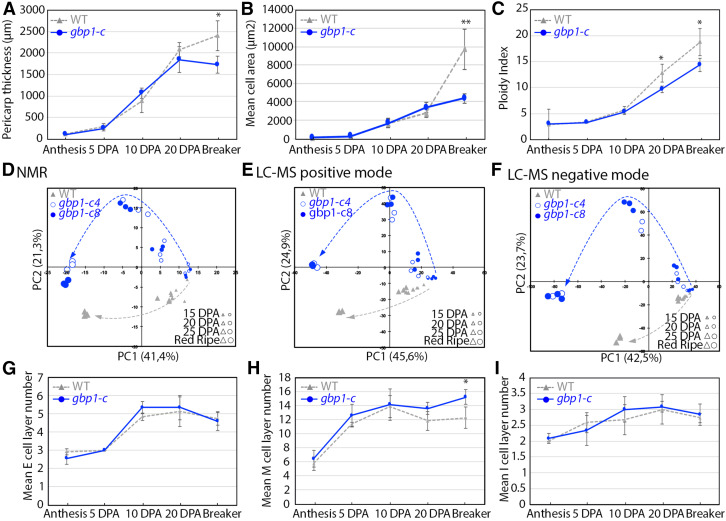
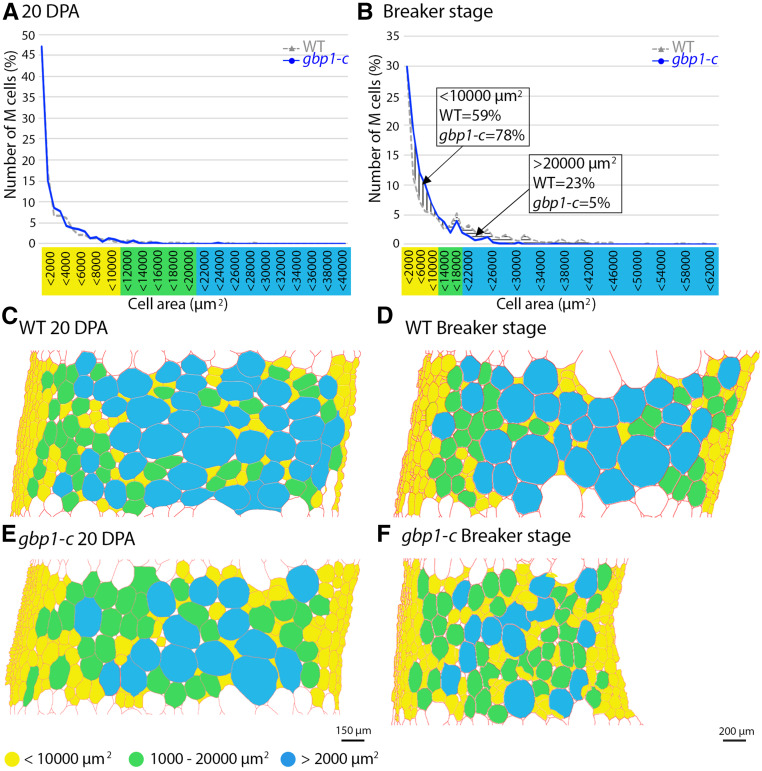
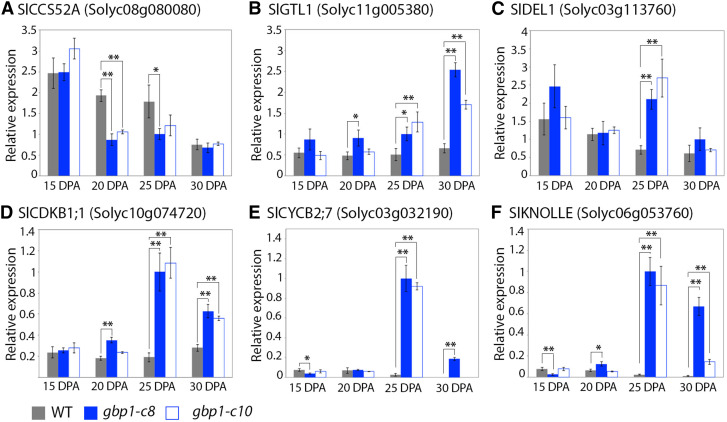
Cell fate maintenance is an integral part of plant cell differentiation and the production of functional cells, tissues, and organs. Fleshy fruit development is characterized by the accumulation of water and solutes in the enlarging cells of parenchymatous tissues. In tomato (Solanum lycopersicum), this process is associated with endoreduplication in mesocarp cells. The mechanisms that preserve this developmental program, once initiated, remain unknown. We show here that analysis of a previously identified tomato ethyl methanesulfonate-induced mutant that exhibits abnormal mesocarp cell differentiation could help elucidate determinants of fruit cell fate maintenance. We identified and validated the causal locus through mapping-by-sequencing and gene editing, respectively, and performed metabolic, cellular, and transcriptomic analyses of the mutant phenotype. The data indicate that disruption of the SlGBP1 gene, encoding GUANYLATE BINDING PROTEIN1, induces early termination of endoreduplication followed by late divisions of polyploid mesocarp cells, which consequently acquire the characteristics of young proliferative cells. This study reveals a crucial role of plant GBPs in the control of cell cycle genes, and thus, in cell fate maintenance. We propose that SlGBP1 acts as an inhibitor of cell division, a function conserved with the human hGBP-1 protein.


Figures

Figure 1.
Figure 1.
Pericarp Phenotypes of the gbp1-c Mutants. (A) to (C) Equatorial and transverse sections of fruit pericarp at the breaker stage in the wild type (A), p3d3 EMS mutant (B), and CRISPR gbp1-c mutant (C). Pericarp sections were stained with toluidine blue. En, endocarp; Ex, exocarp; M, mesocarp; WT, wild type.
Figure 2.
Figure 2.
Identification of the p3d3 Causal Mutation through Mapping-by-Sequencing. (A) Distribution of the allelic frequencies of EMS mutations in the wild-type (WT)–like and mutant-like bulks are represented along the tomato genome in sliding windows of 30 consecutive mutations. In the case of a recessive mutation, allelic frequency of the causal mutation/region should be 1 and 0.33 in the mutant-like and wild-type–like bulks, respectively. Ch, chromosome. (B) The mutations used as markers for recombination analysis are indicated along Ch10. The blue box represents the causal 1.51-Mb region encompassing 131 genes. (C) Solyc10g008950 is the only gene containing an EMS-induced mutation in the causal region. The mutation corresponds to a T deletion in exon 2 (blue box) of Solyc10g008950. Exons are represented by boxes.
Figure 3.
Figure 3.
Plant and Fruit Development in the Wild Type and gbp1-c. (A) Plant phenotypes of the wild type (WT) and gbp1-c. (B) Leaf phenotypes of the wild type and gbp1-c. (C) and (D) Whole fruits and half transverse sections of the wild type (WT) and gbp1-c during fruit development. For anthesis and 5DPA, equatorial sections were stained with Calcofluor white. (E) Fruit diameter during the growth period. Values represent means ± sd (n = 9 to 16 fruits). Mutant samples include gbp1c-8 and gbp1-c4 fruits. (F) Fruit firmness along development in wild type and mutant. Values represent means ± sd (n = 11 to 56 fruits). Mutant samples include gbp1c-8, gbp1-c10, and gbp1-c4. In (E) and (F), significant differences between the mutant and the wild type: Wilcoxon test, P-value < 0.05 with FC >1.2 and > 2 are indicated by * and **, respectively.
Figure 4.
Figure 4.
Cellular Parameters and Composition during Pericarp Development. (A) Pericarp thickness during pericarp development (n = 4 to 6 fruits). (B) Mean cell area during pericarp development (n = 4 to 5 fruits). (C) Ploidy index corresponding to the mean C-level of a pericarp cell (Bertin et al., 2009) during pericarp development (n = 5 to 8 fruits). (D) to (F) Principal component analyses of metabolomics data in two independent gbp1-c lines and wild-type (WT) fruit. 1H-NMR data includes 329 spectra regions. LC-MS under positive ionization includes 1,523 metabolite features. LC-MS under negative ionization includes 3,915 metabolite features. Changes in the metabolic patterns along fruit development are represented by an arrow for each genotype. (G) to (I) Exocarp (E), mesocarp (M), and endocarp (I) cell layer number during pericarp development (n = 3 to 6 fruits). In (A) to (C) and (G) to (I), values represent means ± sd. Mutant samples include gbp1c-8 and gbp1-c4 fruits. Significant differences between the mutant and the wild type: Wilcoxon test, P-value < 0.05 with FC >1.2 and > 2 are indicated by * and **, respectively.
Figure 5.
Figure 5.
Mesocarp Cell Area Distribution at 20 DPA and the Breaker Stage. (A) and (B) Proportion (%) of mesocarp (M) cells in successive cell area categories in μm2. Values represent means of four wild-type and mutant (gbp1c-8 and gbp1-c4) fruits. (C) to (F) Schematic representation of the spatial distribution of M cells in mutant and wild-type (WT) sections. Segmented cells walls obtained using the program CellSeT (Pound et al., 2012) are represented in red. A color code is given according to cell area.
Figure 6.
Figure 6.
Cell Wall Alterations in the gbp1-c Mutant. (A) to (P) Indirect immunofluorescence microscopy of the wild type (WT) and gbp1-c at 20 DPA or at the breaker stage. Indirect immunofluorescence microscopy was performed using antibodies and probes that indicate different degrees of esterification of the HG component of pectin, from highly esterified (LM20 antibody) to partially esterified (JIM5 antibody, COS488), including no-esterified forms that are able to bind to cations such as calcium (Ca2+) and form gels in the middle lamella (2F4 antibody). Green represents specific antibody or probe signal. Arrow indicates JIM5 signal close to the plasma membrane. The white signal shows Calcofluor white staining of cell walls (β-linked glucans: callose and cellulose). CJ, cell junctions; PD, plasmodesmata.
Figure 7.
Figure 7.
Newly Formed Cell Walls in Large Mesocarp Cells of the gbp1-c Mutant at the Breaker Stage. (A) and (B) Pericarp sections in the wild type (WT) and gbp1-c at the breaker stage. (C) to (F) Additional cell walls inside mesocarp cells in the gbp1-c mutant. (G) to (J) Schematic representations of cells shown in (A) to (D). The parental cell walls are shown in blue and additional cell walls are shown in red. (K) Close-up of fusion site between parental and new cell wall. (L) Indirect immunofluorescence with an anti-β-1,3-glucan antibody (green signal) indicating callose deposition. (M) and (N) Newly divided parental mesocarp cell showing a nucleus in both daughter cells. Nuclei in red are labeled with propidium iodide. Scale bars represent 5 µm in (K) and (N), 20 µm in (C), (D), (L), and (M) and 50 µm in (E) and (F). The white signal shows Calcofluor white staining of cell walls (β-linked glucans: callose and cellulose). Arrows indicate new cell walls. Ex, exocarp; M, mesocarp; En, endocarp.
Figure 8.
Figure 8.
Expression Patterns of Cell Cycle and Endocycle Regulators in the gbp1-c Mutant. (A) SlCCS52A gene expression. (B) SlGTL1 gene expression. (C) SlDEL1 gene expression. (D) SlCDKB1;1 gene expression. (E) SlCYCB2;7 gene expression. (F) SlKNOLLE gene expression. Normalized relative expression of cell cycle genes in wild type (WT) and two gbp1-c mutant lines is given in arbitrary units. Values represent means ± sd for technical triplicates. Significant differences (Student's t test) between the mutants and the wild type are indicated by *P-value < 0.05 and **P-value < 0.01.

Comment in

References

    1. Akihiro, T. , et al. (2008). Biochemical mechanism on GABA accumulation during fruit development in tomato. Plant Cell Physiol. 49: 1378–1389. - PubMed
    1. Assaad, F.F. (2001). Plant cytokinesis. Exploring the links. Plant Physiol. 126: 509–516. - PMC - PubMed
    1. Baloban, M. , Vanstraelen, M. , Tarayre, S. , Reuzeau, C. , Cultrone, A. , Mergaert, P. , Kondorosi, E. (2013). Complementary and dose-dependent action of AtCCS52A isoforms in endoreduplication and plant size control. New Phytol. 198: 1049–1059. - PubMed
    1. Bárány, I. , Fadón, B. , Risueño, M.C. , Testillano, P.S. (2010). Microspore reprogramming to embryogenesis induces changes in cell wall and starch accumulation dynamics associated with proliferation and differentiation events. Plant Signal. Behav. 5: 341–345. - PMC - PubMed
    1. Benjamini, Y. , Hochberg, Y. (1995). Controlling the false discovery rate: A practical and powerful approach to multiple testing. J. R. Stat. Soc. B 57: 289–300.

Publication types

MeSH terms

LinkOut - more resources