. 2020 Aug 4;11(4):e01183-20.
doi: 10.1128/mBio.01183-20.

Zika Virus Infection Promotes Local Inflammation, Cell Adhesion Molecule Upregulation, and Leukocyte Recruitment at the Blood-Brain Barrier

Affiliations

Zika Virus Infection Promotes Local Inflammation, Cell Adhesion Molecule Upregulation, and Leukocyte Recruitment at the Blood-Brain Barrier

Marion Clé et al. mBio. .

Abstract

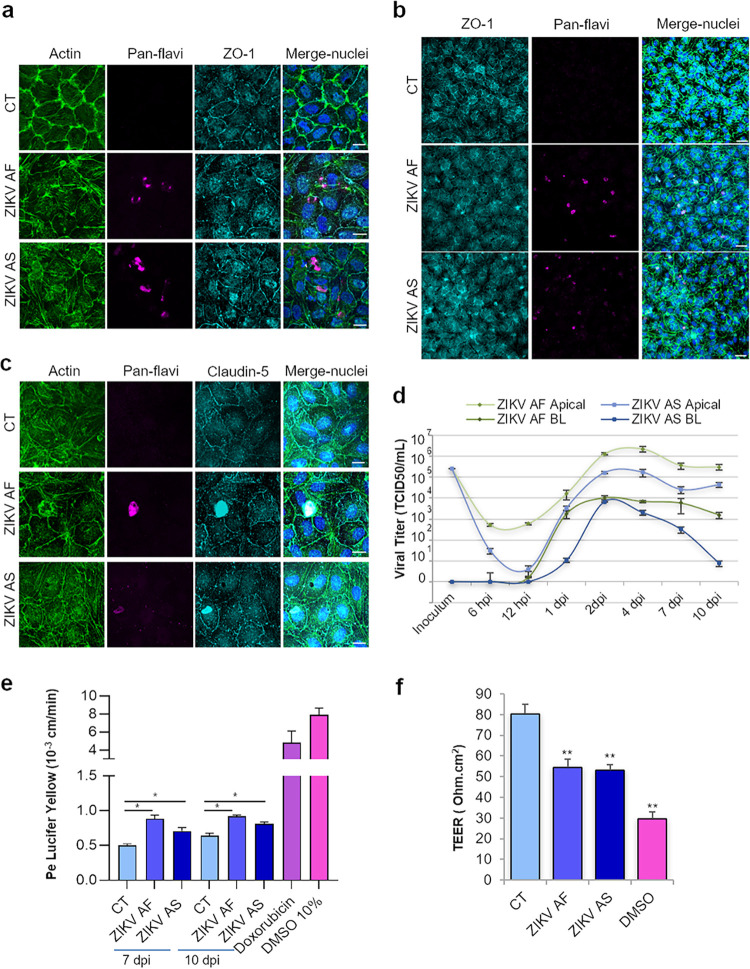
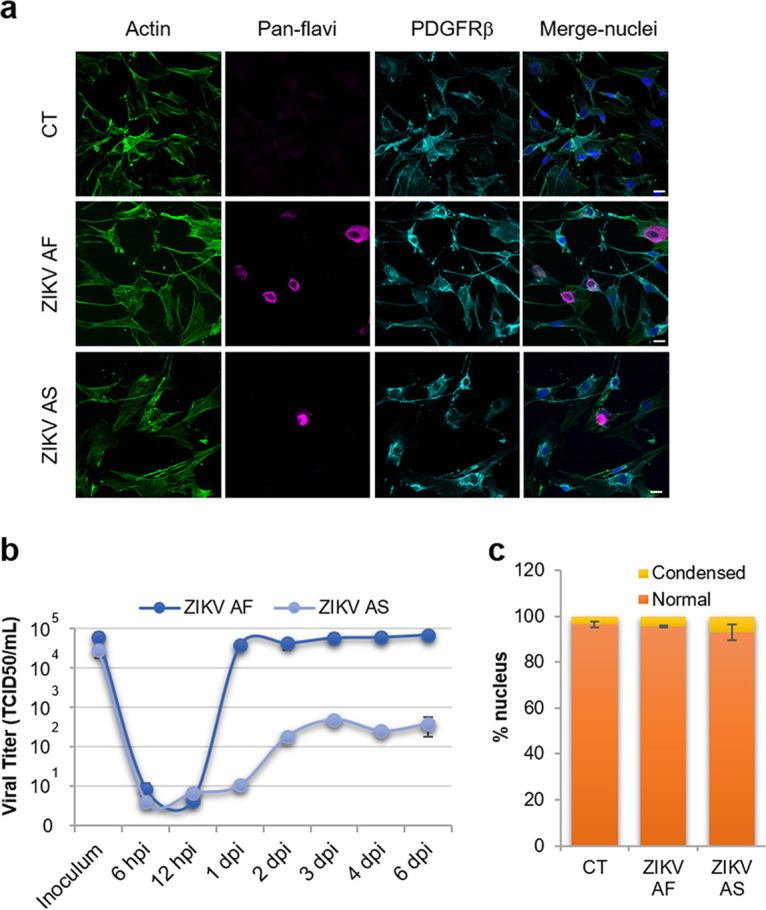
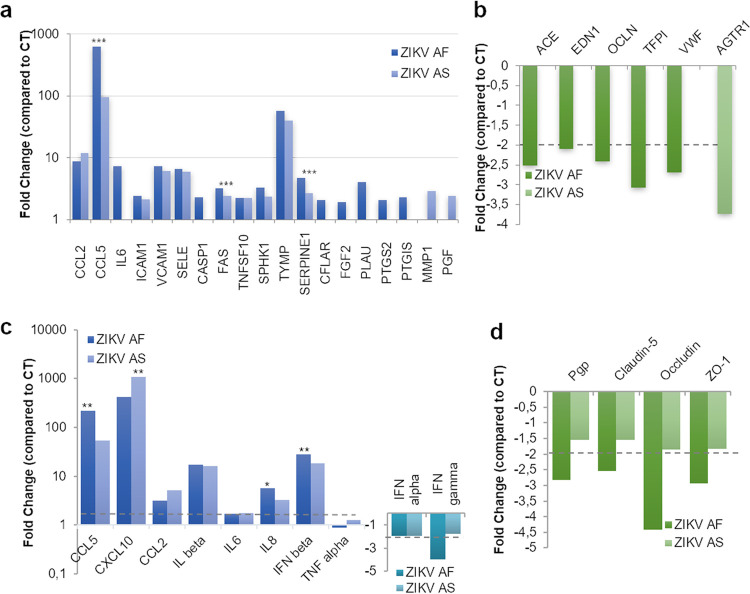
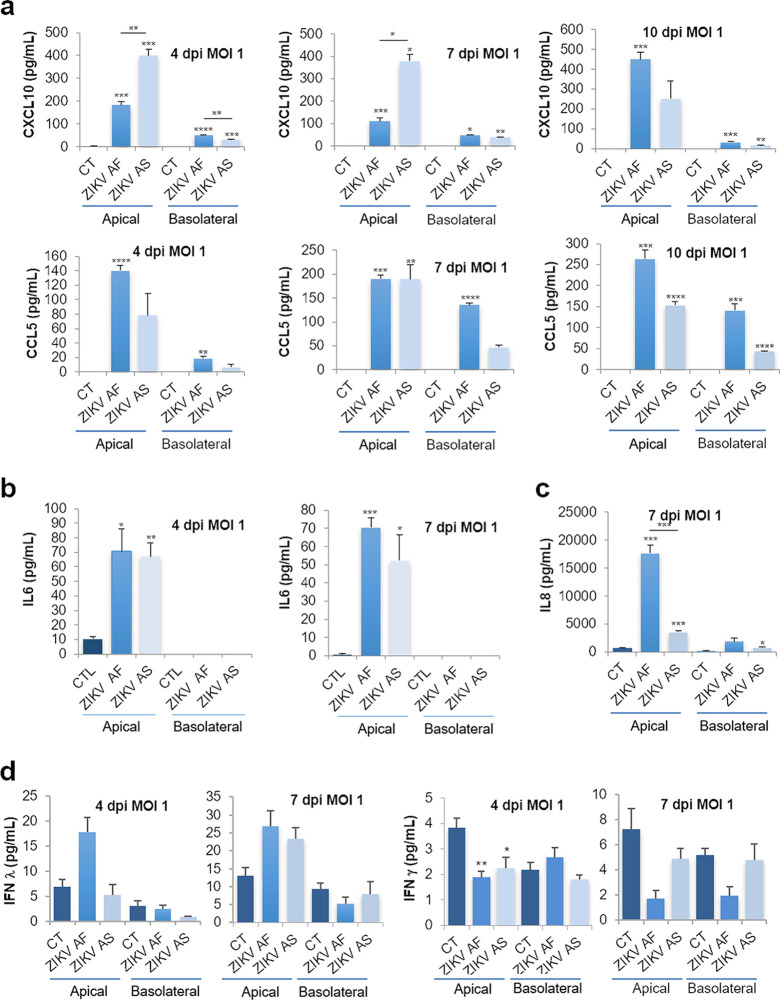
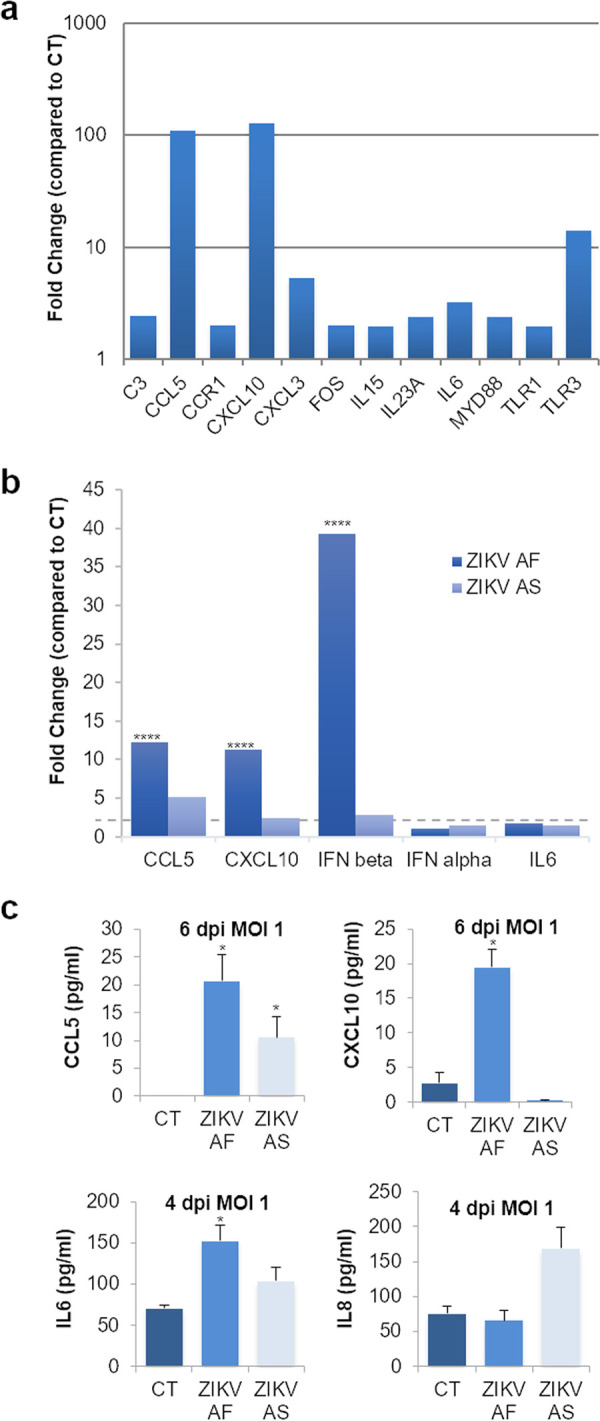
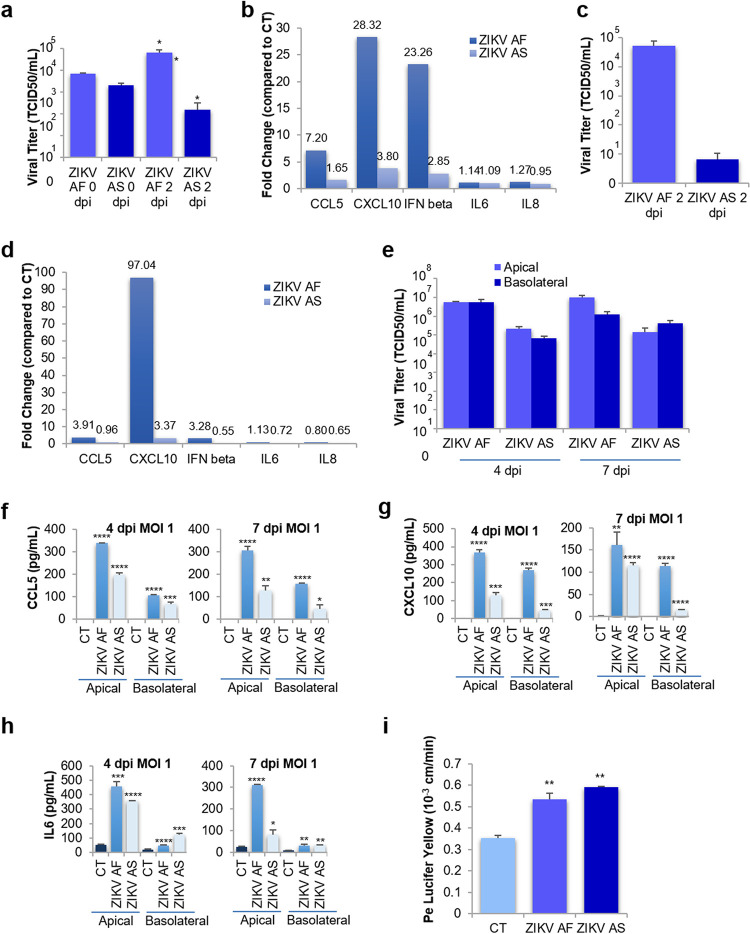
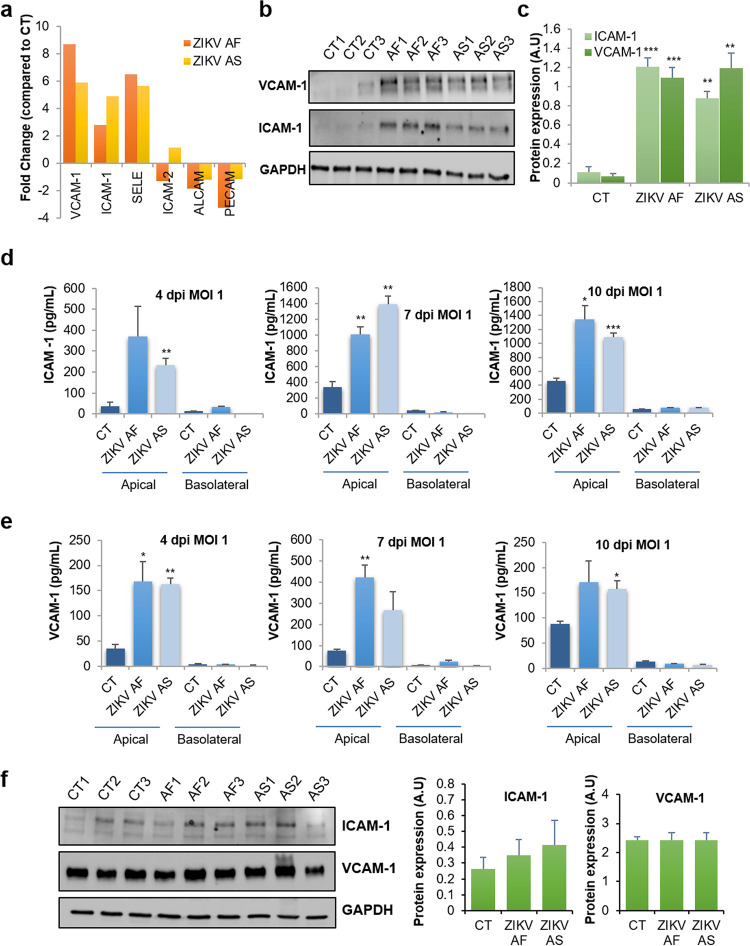
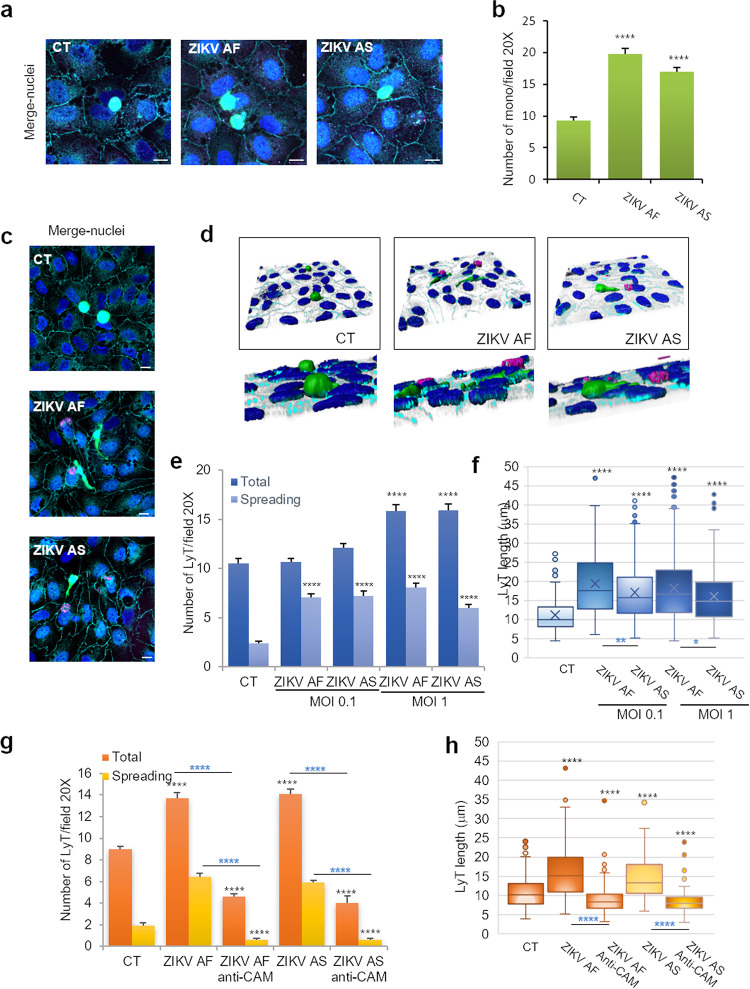
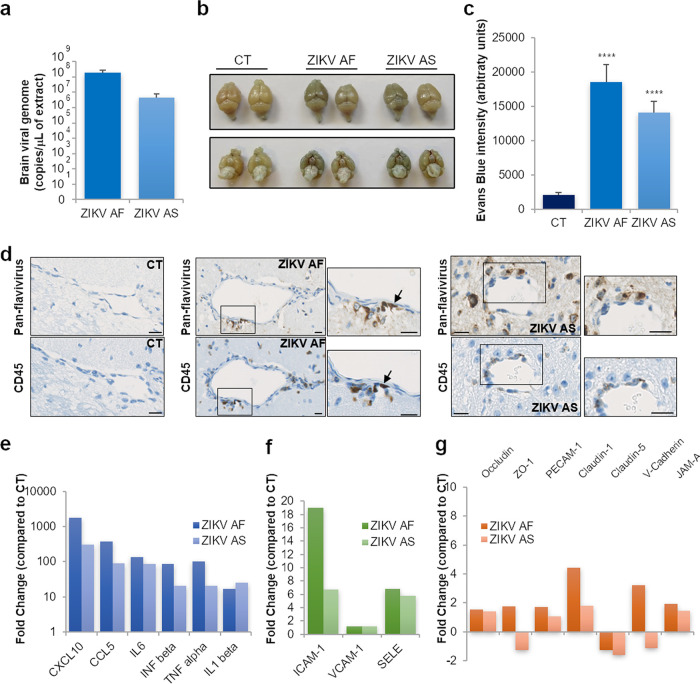
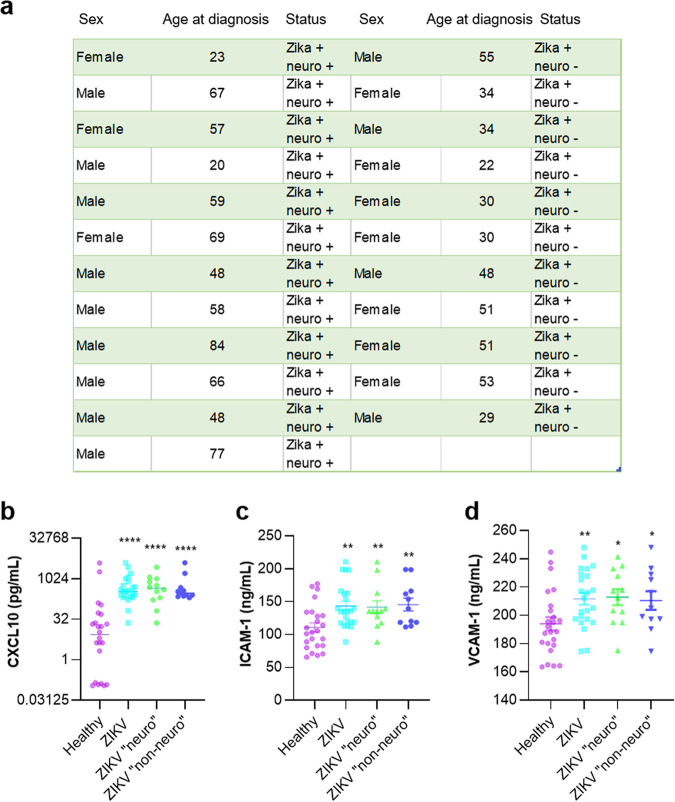
The blood-brain barrier (BBB) largely prevents toxins and pathogens from accessing the brain. Some viruses have the ability to cross this barrier and replicate in the central nervous system (CNS). Zika virus (ZIKV) was responsible in 2015 to 2016 for a major epidemic in South America and was associated in some cases with neurological impairments. Here, we characterized some of the mechanisms behind its neuroinvasion using an innovative in vitro human BBB model. ZIKV efficiently replicated, was released on the BBB parenchyma side, and triggered subtle modulation of BBB integrity as well as an upregulation of inflammatory and cell adhesion molecules (CAMs), which in turn favored leukocyte recruitment. Finally, we showed that ZIKV-infected mouse models displayed similar CAM upregulation and that soluble CAMs were increased in plasma samples from ZIKV-infected patients. Our observations suggest a complex interplay between ZIKV and the BBB, which may trigger local inflammation, leukocyte recruitment, and possible cerebral vasculature impairment.IMPORTANCE Zika virus (ZIKV) can be associated with neurological impairment in children and adults. To reach the central nervous system, viruses have to cross the blood-brain barrier (BBB), a multicellular system allowing a tight separation between the bloodstream and the brain. Here, we show that ZIKV infects cells of the BBB and triggers a subtle change in its permeability. Moreover, ZIKV infection leads to the production of inflammatory molecules known to modulate BBB integrity and participate in immune cell attraction. The virus also led to the upregulation of cellular adhesion molecules (CAMs), which in turn favored immune cell binding to the BBB and potentially increased infiltration into the brain. These results were also observed in a mouse model of ZIKV infection. Furthermore, plasma samples from ZIKV-infected patients displayed an increase in CAMs, suggesting that this mechanism could be involved in neuroinflammation triggered by ZIKV.

Keywords: Zika virus; blood-brain barrier; cell adhesion molecules; leukocyte recruitment.


Figures

FIG 1
FIG 1
In vitro human BBB is permissive to ZIKV infection and replication without strong deleterious effects on its integrity. (a) CT-, ZIKV AF-, and ZIKV AS-infected (MOI, 0.1) hBLECs of BBB model grown on cell culture inserts fixed at 6 dpi. Indirect IF confocal studies of CT- and ZIKV-infected hBLECs using an actin probe (green) and antibodies against ZIKV (pan-flavivirus, magenta) and ZO-1 (cyan). Nuclei are labeled with Hoechst (blue). Bars, 15 μm. (b) CT-, ZIKV AF-, and ZIKV AS-infected (MOI, 1) BBB model grown on cell culture inserts were fixed at 10 dpi. Indirect IF confocal studies show actin (green), ZIKV (magenta), ZO-1 (cyan), and nuclei (blue). ZO-1 labeling highlights cell-cell adhesion, characteristic of polarized endothelia. Bars, 30 μm. (c) Indirect IF studies of BBB model at 7 dpi (MOI, 1) showing actin (green), ZIKV (magenta), claudin-5 (cyan), and nuclei (blue). Bars, 15 μm. (d) Viral titers in supernatants from ZIKV AF- and ZIKV AS-infected (MOI, 1) BBB model in apical and basolateral (BL) sides at various time points postinfection determined using the TCID50 method. Results are expressed as means ± standard errors of the means (SEMs) from 3 independent experiments. (e) Paracellular permeability of CT-, ZIKV AF-, and ZIKV AS-infected (MOI, 1) BBB model grown on cell culture inserts at 7 and 10 dpi. Doxorubicin and DMSO are two positive controls. Results are expressed as means ± SEMs (n = 3) and analyzed using a Wilcoxon-Mann-Whitney test. *, P < 0.05 (ZIKV AF/AS compared to CT). (f) Transendothelial electrical resistance (TEER) of CT-, ZIKV AF-, and ZIKV AS-infected (MOI, 1) BBB grown on cell culture inserts was measured at 10 dpi. DMSO is a positive control. Each bar represents the mean ± SEM from 3 independent experiments and analyzed using a Wilcoxon-Mann-Whitney test. **, P < 0.01 (compared to CT).
FIG 2
FIG 2
Human pericytes are cellular targets for ZIKV infection. (a) Mock- (CT), ZIKV AF-, and ZIKV AS-infected (MOI, 1) human pericytes were fixed at 4 dpi and labeled with an actin probe (green), pan-flavivirus (magenta), and PDGFRβ (cyan) by indirect IF. Nuclei are labeled with Hoechst (in blue). Bars, 20 μm. (b) Viral titers from ZIKV AF- and ZIKV AS-infected pericytes determined by TCID50 methods at various time points postinfection. Results are expressed as means ± SEMs (n = 3) and analyzed using a Wilcoxon-Mann-Whitney test. (c) Quantification of apoptotic nuclei in CT-, ZIKV AF-, and ZIKV AS-infected pericytes at 4 dpi. Apoptotic nuclei are represented in yellow and normal nuclei in orange. Results are expressed as means ± SEMs (≥110 cells, n = 3).
FIG 3
FIG 3
ZIKV infection modulates gene expression in human BBB cells. mRNA from hBLECs from CT-, ZIKV AF-, and ZIKV AS-infected (MOI, 1) BBB model grown on cell culture inserts collected at 7 dpi and subjected to RT-qPCR array analysis. Fold regulation of statistically significant genes upregulated (a) or downregulated (b) in ZIKV AF- and ZIKV AS-infected hBLECs compared to that in CT. Results are expressed as means of the fold change (n = 3) (genes where the ratio gene/housekeeping gene is statistically significant from CT) (see Fig. S3c in the supplemental material). Differences between lineages were observed (ratio gene/housekeeping gene ZIKV AF versus ZIKV AS, unpaired t test). ***, P < 0.001. (c) Gene expression of inflammatory response in hBLECs infected by ZIKV AF and ZIKV AS were measured by RT-qPCR. Results are expressed as means of the fold change (n = 3) using HPRT1 as the housekeeping gene (genes where the ratio gene/housekeeping gene is statistically significant [P < 0.05] from CT) (see Fig. S3d). Differences between lineages were observed (ratio gene/housekeeping gene ZIKV AF versus ZIKV AS, unpaired t test. *, P < 0.05; **, P < 0.01. (d) Gene expression of tight junction proteins in hBLECs infected by ZIKV AF and ZIKV AS were measured by RT-qPCR. Results are expressed as means of the fold change (n = 3) using HPRT1 as a housekeeping gene (genes where the ratio gene/housekeeping gene is statistically significant [P < 0.05] from CT) (see Fig. S3d).
FIG 4
FIG 4
Increased expression of cytokines and chemokines in ZIKV-infected human BBB. (a) ELISA analyses of CXCL10 and CCL5 concentrations in the supernatants (apical and basolateral compartments) of CT or ZIKV AF- and ZIKV AS-infected (MOI, 1) BBB model grown on cell culture inserts at 4, 7, and 10 dpi. Results are expressed as means ± SEMs (n = 3) and analyzed using an unpaired t test. *, P < 0.05; **, P < 0.01; ***, P < 0.001; ****, P < 0.0001 compared to CT. (b) ELISA analyses of IL-6 concentration in the supernatants (apical and basolateral compartments) of CT or ZIKV AF- and ZIKV AS-infected (MOI, 1) BBB model grown on cell culture inserts at 4 and 7 dpi. Results are represented as means ± SEMs (n = 3) and analyzed using an unpaired t test. *, P < 0.05; **, P < 0.01; ***, P < 0.001 compared to CT. (c) Multiplex analyses of IL-8 concentration in the supernatants (apical and basolateral compartments) of CT or ZIKV AF- and ZIKV AS-infected (MOI, 1) BBB model grown on cell culture inserts at 7 dpi. Results are represented as means ± SEMs (n = 3) and analyzed using an unpaired t test. *, P < 0.05; ***, P < 0.001 compared to CT. (d) Multiplex analyses of IFN-γ and -λ concentrations in the supernatants (apical and basolateral compartments) of CT or ZIKV AF- and ZIKV AS-infected (MOI, 1) BBB model grown on cell culture inserts at 4 and 7 dpi. Results are represented as means ± SEMs (n = 3) analyzed using an unpaired t test. *, P < 0.05; **, P < 0.01 compared to CT.
FIG 5
FIG 5
ZIKV-infected pericytes express inflammatory cytokines and chemokines. mRNAs from mock- and ZIKV-infected pericytes (MOI, 1) at 3 dpi were collected and subjected to RT-qPCR analyses using a PCR array of 84 genes implicated in innate and adaptive immunity (see Materials and Methods). (a) Fold regulation of statistically significant genes modulated upon ZIKV AF infection are shown. Only genes where the ratio gene/housekeeping gene were statistically significant (unpaired t test P < 0.05. ZIKV AF compared to CT) (see Fig. S5a) from CT are shown. Results are expressed as mean ± SEM (n = 3). (b) Gene expression of inflammatory response in ZIKV AF and ZIKV AS-infected pericytes (MOI 1) by RT-qPCR at 6 dpi. Results are expressed as mean of the fold change (n = 3) using HPRT1 as housekeeping gene (genes where the ratio gene/housekeeping gene is statistically significant (P < 0.05) from CT (see Fig. S5b). Differences between lineages were observed (ratio gene/housekeeping gene ZIKV AF versus ZIKV AS, unpaired t test) ****, P < 0.0001. (c) ELISA and multiplex analyses of CXCL10, CCL5, IL-6, and IL-8 concentrations in the supernatants of CT or ZIKV AF- and ZIKV AS-infected (MOI, 1) primary human pericytes at 4 and 6 dpi. Results are represented as means ± SEMs (n = 3) and analyzed using an unpaired t test. *, P < 0.05 compared to CT.
FIG 6
FIG 6
ZIKV triggers inflammatory responses in human astrocytes. (a) Basolateral supernatants from ZIKV AF- and ZIKV AS-infected BBB (hBLECs plus pericytes) at 4 dpi were incubated with astrocytes for 2 days. Viral titers from ZIKV AF- and ZIKV AS-infected astrocytes were determined by TCID50 at various times postinfection. Results are expressed as means ± SEMs (n = 3) and analyzed using a Wilcoxon-Mann-Whitney test. *, P < 0.05 (ZIKV AF versus AS). (b) Gene expression of inflammatory response in astrocytes infected by basolateral supernatants from ZIKV AF- and ZIKV AS-infected BBB (hBLECs plus pericytes) were measured by qRT-PCR. Results are expressed as means of the fold change (n = 3) using HPRT1 as a housekeeping gene (genes where the ratio gene/housekeeping gene is statistically significant [P < 0.05] from CT) (see Fig. S5c). Differences between lineages were observed (ratio gene/housekeeping gene ZIKV AF versus ZIKV AS, unpaired t test). (c) Viral titers from ZIKV AF- and ZIKV AS-infected astrocytes were determined by TCID50 at 2 dpi. Results are expressed as means ± SEMs (n = 3) and analyzed using a Wilcoxon-Mann-Whitney test. (d) Gene expression of inflammatory response in ZIKV AF- and ZIKV AS-infected astrocytes was measured by qRT-PCR. Results are expressed as means of the fold change (n = 3) using HPRT1 as a housekeeping gene (genes where the ratio gene/housekeeping gene is statistically significant [P < 0.05] from CT) (see Fig. S5d). Differences between lineages were observed (ratio gene/housekeeping gene ZIKV AF versus ZIKV AS, unpaired t test. (e) Viral titers in supernatants from ZIKV AF- and ZIKV AS-infected (MOI, 1) BBB model (hBLECs/pericytes/astrocytes) in apical and basolateral sides at 4 and 7 dpi determined using the TCID50 method. Results are expressed as means ± SEMs from 3 independent experiments. ELISA analyses of CCL5 (f), CXCL10 (g), and IL-6 (h) concentrations in the supernatants (apical and basolateral compartments) of CT or ZIKV AF- and ZIKV AS-infected (MOI, 1) BBB model grown (hBLECs/pericytes/astrocytes) on cell culture inserts at 4 and 7 dpi. Results are expressed as means ± SEMs (n = 3) and analyzed using a nonparametric t test. *, P < 0.05; **, P < 0.01; ***, P < 0.001; ****, P < 0.0001 compared to CT. (i) Paracellular permeability of CT or ZIKV AF- and ZIKV AS-infected (MOI, 1) BBB model (hBLECs/pericytes/astrocytes) grown on cell culture inserts at 7 dpi. Results are expressed as means ± SEMs (n = 3) and analyzed using a Wilcoxon-Mann-Whitney test. **, P < 0.01 (ZIKV AF/AS compared to CT).
FIG 7
FIG 7
ZIKV hBLEC infection triggers strong upregulation of cell adhesion molecules. (a) Gene expression of cell adhesion molecules (ICAM-1, VCAM-1, E-selectin [SELE], ICAM-2, ALCAM-2, and PECAM) in hBLECs infected by ZIKV AF and ZIKV AS. mRNA from hBLECs from CT or ZIKV AF- and ZIKV AS-infected (MOI, 1) BBB model grown on cell culture inserts were collected at 7 dpi and subjected to RT-qPCR array analyses. Results are expressed as means of the fold change (n = 3) using HPRT1 as a housekeeping gene (genes where the ratio gene/housekeeping gene is statistically significant [P < 0.05] from CT) (see Fig. S3d). (b and c) Immunoblot blot analyses of the expression of ICAM-1 and VCAM-1 in CT or ZIKV AF- and ZIKV AS-infected hBLECs at 7 dpi (MOI, 1). Representative images are shown. The quantification of the expression of these markers, relative to GAPDH expression, is expressed as mean ± SEM (n = 3) and analyzed using a Student's t test. **, P < 0.01; ***, P < 0.001 compared to CT. (d and e) ELISA analyses of soluble ICAM-1 and VCAM-1 concentrations in the supernatants (apical and basolateral compartments) of CT or ZIKV AF- and ZIKV AS-infected (MOI, 1) hBLECs of the BBB model grown on cell culture inserts at 4, 7, and 10 dpi. Results are expressed as means ± SEMs (n = 3) and analyzed using a Student's t test. *, P < 0.05; **, P < 0.01; ***, P < 0.001 compared to CT. (f) Immunoblot analysis of the expression of CAMs in mock-, ZIKV AF-, and ZIKV AS-infected primary human pericytes at 6 dpi with an MOI of 1. Representative images are shown. The quantification of the expression of these markers, relative to GAPDH expression, is expressed as means ± SEMs from 3 experiments.
FIG 8
FIG 8
Increased recruitment of leukocytes in ZIKV-infected human BBB. hBLECs grown on cell culture inserts were infected with ZIKV AF and ZIKV AS (MOI, 1 or 0.1) for 7 days; 104 monocytes (a) or lymphocytes CD4+ (LyT) (c) prestained with CFSE were added to hBLECs for 30 min. (a) Mock-, ZIKV AF-, and ZIKV AS-infected BBB models grown on cell culture insert were fixed after incubation with monocytes at 7 dpi. Indirect IF studies were used to visualize monocyte (green) interaction with hBLECs: merged image shows also ZIKV (pan-flavivirus, magenta), ZO-1 (cyan) and Hoechst (blue). Scale bars 10 μm. (b) Quantitative analyzes of monocyte numbers per field (20×). Results are expressed mean ± SEM (30 fields per conditions per experiments (≥450 cells, n = 3)) and analyzed using a Wilcoxon-Mann-Whitney test. ****, P < 0.0001 compared to CT. (c) Mock- and ZIKV AF- and ZIKV AS-infected BBB model grown on cell culture insert were fixed after incubation with LyT at 7 dpi. Indirect IF studies were used to visualize LyT (green) interaction with hBLEC: merge images show also ZIKV (pan-flavivirus, magenta), ZO-1 (cyan), and Hoechst (blue). Bars, 10 μm. (d) 3D rendering of LyT interaction with mock-, ZIKV AF-, and ZIKV AS-infected BBB models. Confocal stacks of images shown in panel c were subjected to 3D reconstruction with the Imaris software (ZO-1, cyan; LyT, green; ZIKV, magenta; and nuclei, blue). (e) Quantitative analyses of LyT numbers per field (20×) in CT and ZIKV-infected BBB (MOI, 0.1 and 1). Cells elongated qualified as “spreading.” Results are expressed means ± SEMs (30 fields per conditions per experiments [≥320 cells, n = 3]) and analyzed using a Wilcoxon-Mann-Whitney test. ****, P < 0.0001 compared to CT. (f) LyT cell length (in microns) in CT and ZIKV-infected BBB (MOI, 0.1 and 1). Data are expressed as boxes and whiskers (≥300 cells, n = 3) and analyzed using a Wilcoxon-Mann-Whitney test. *, P < 0.05; **, P < 0.01; ****, P < 0.0001. Black asterisks show differences compared to CT conditions, while blue asterisks show differences between ZIKV AF and ZIKV AS. (g) To monitor CAM involvement in LyT binding/recruitment, hBLECs were incubated with a cocktail of blocking antibodies against ICAM-1, VCAM-1, and E-selectin 1 h prior to LyT incubation. Quantitative analyses of LyT numbers per field (20×) in CT and ZIKV-infected BBB (MOI, 1). Results are expressed means ± SEMs (30 fields per conditions per experiments [n = 3]) and analyzed using a Wilcoxon-Mann-Whitney test. ****, P < 0.0001 compared to CT. Black asterisks show differences compared to CT conditions, while blue asterisks show differences between ZIKV AF/AS and ZIKV AF/AS treated with anti-CAM antibodies. (h) LyT cell length (in microns) in CT and ZIKV-infected BBB (MOI, 1) after CAM blocking. Results are expressed means ± SEMs (30 fields per conditions per experiments [n = 3]) and analyzed using a Wilcoxon-Mann-Whitney test. ****, P < 0.0001 compared to CT. Black asterisks show differences compared to CT conditions, while blue asterisks show differences between ZIKV AF/AS and ZIKV AF/AS treated with anti-CAM antibodies.
FIG 9
FIG 9
ZIKV-infected mouse brain displays local BBB impairment, leukocyte infiltration, and CAM upregulation. (a) RT-qPCR analyses of ZIKV genome in the brain of ZIKV-infected Ifnar−/− mice 7 dpi. (b) Picture of dissected brains from EB-injected mock- and ZIKV-infected mice at 7 dpi. (c) Quantification Evans blue fluorescence in brain slices from mock- and ZIKV-infected animals. Results are expressed means ± SEMs (n = 3) and analyzed using a Wilcoxon-Mann-Whitney test. ****, P < 0.0001 compared to CT. (d) Three-micron consecutive paraffin sections were processed with Luxol blue and stained either with an anti-pan-flavivirus or an anti-CD45 (lymphoid cells) (brown labeling) antibody. Bars. 10 μm. (e) RT-qPCR analyses of inflammatory genes in ZIKV-infected brains. Results are expressed as means of the fold change (n = 3) using GAPDH as a housekeeping gene (genes where the ratio gene/housekeeping gene is statistically significant [P < 0.05] from CT) (see Fig. S8a). (f) RT-qPCR analyses of CAMs in ZIKV-infected brains. Results are expressed as means of the fold change (n = 3) using GAPDH as a housekeeping gene (genes where the ratio gene/housekeeping gene is statistically significant [P < 0.05] from CT) (see Fig. S8a). (g) RT-qPCR analyses of TJ and AJ genes in ZIKV-infected brains. Results are expressed as means of the fold change (n = 3) using GAPDH as a housekeeping gene (genes where the ratio gene/housekeeping gene is statistically significant [P < 0.05] from CT) (see Fig. S8a).
FIG 10
FIG 10
sCAMs are increased in the plasma samples from ZIKV+ patients. (a) ZIKV-infected patients from the CARBO cohorts. (b) CXCL10 levels in healthy blood donors and ZIKV+ patients were measured by ELISAs. Results are expressed as means ± SEMs (24 healthy, 24 ZIKV+ plasma samples [12 neuro and 12 non-neuro]) and analyzed using a Wilcoxon-Mann-Whitney test. ****, P < 0.0001 compared to healthy plasma. (c and d) Soluble ICAM-1 and VCAM-1 levels in healthy blood donors and ZIKV+ patients were measured by ELISAs. Results are expressed means ± SEMs (24 healthy, 24 ZIKV+ plasma samples [12 neuro and 12 non-neuro]) and analyzed using a Wilcoxon-Mann-Whitney test. *, P < 0.05; **, P < 0.01; ****, P < 0.0001 compared to healthy plasma samples.

References

    1. Engelhardt B, Vajkoczy P, Weller RO. 2017. The movers and shapers in immune privilege of the CNS. Nat Immunol 18:123–131. doi:10.1038/ni.3666. - DOI - PubMed
    1. Banks WA, Erickson MA. 2010. The blood-brain barrier and immune function and dysfunction. Neurobiol Dis 37:26–32. doi:10.1016/j.nbd.2009.07.031. - DOI - PubMed
    1. De Chiara G, Marcocci ME, Sgarbanti R, Civitelli L, Ripoli C, Piacentini R, Garaci E, Grassi C, Palamara AT. 2012. Infectious agents and neurodegeneration. Mol Neurobiol 46:614–638. doi:10.1007/s12035-012-8320-7. - DOI - PMC - PubMed
    1. Miner JJ, Diamond MS. 2016. Mechanisms of restriction of viral neuroinvasion at the blood-brain barrier. Curr Opin Immunol 38:18–23. doi:10.1016/j.coi.2015.10.008. - DOI - PMC - PubMed
    1. Salinas S, Schiavo G, Kremer EJ. 2010. A hitchhiker’s guide to the nervous system: the complex journey of viruses and toxins. Nat Rev Microbiol 8:645–655. doi:10.1038/nrmicro2395. - DOI - PubMed

Publication types

Substances