. 2020 Aug 4;11(1):3897.
doi: 10.1038/s41467-020-17615-5.

Lipo-chitooligosaccharides as regulatory signals of fungal growth and development

Affiliations

Lipo-chitooligosaccharides as regulatory signals of fungal growth and development

Tomás Allen Rush et al. Nat Commun. .

Abstract

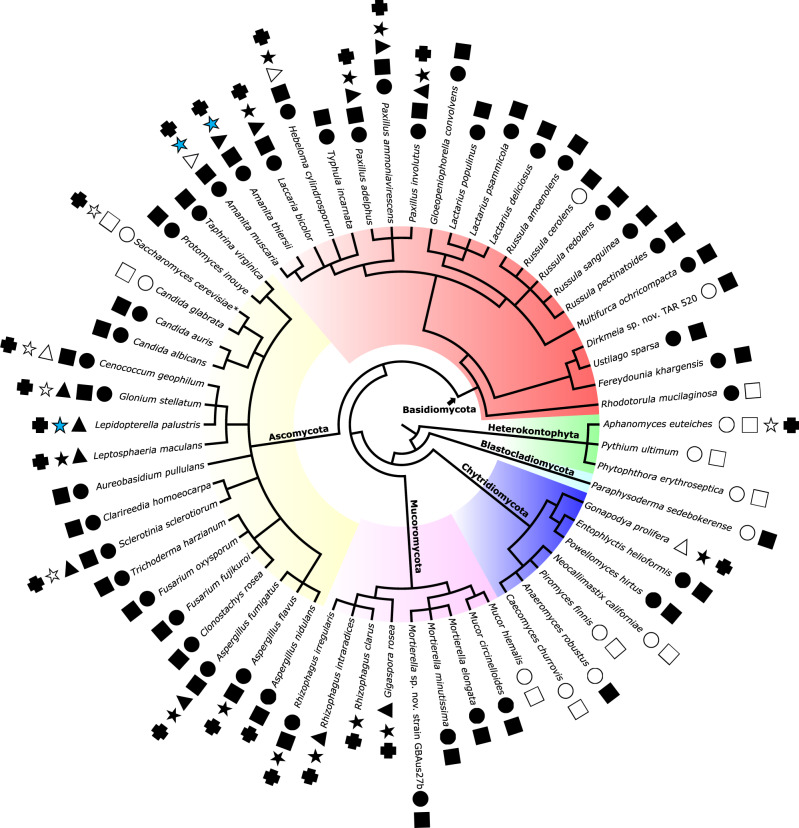
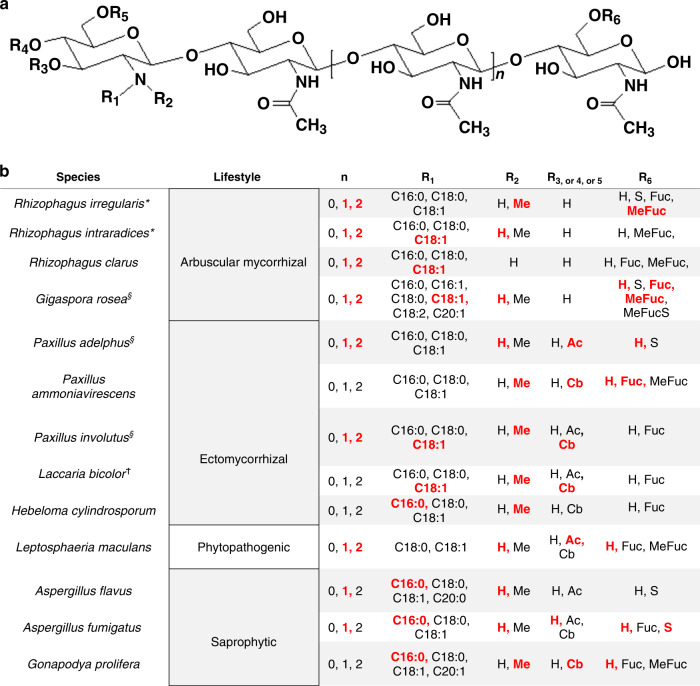
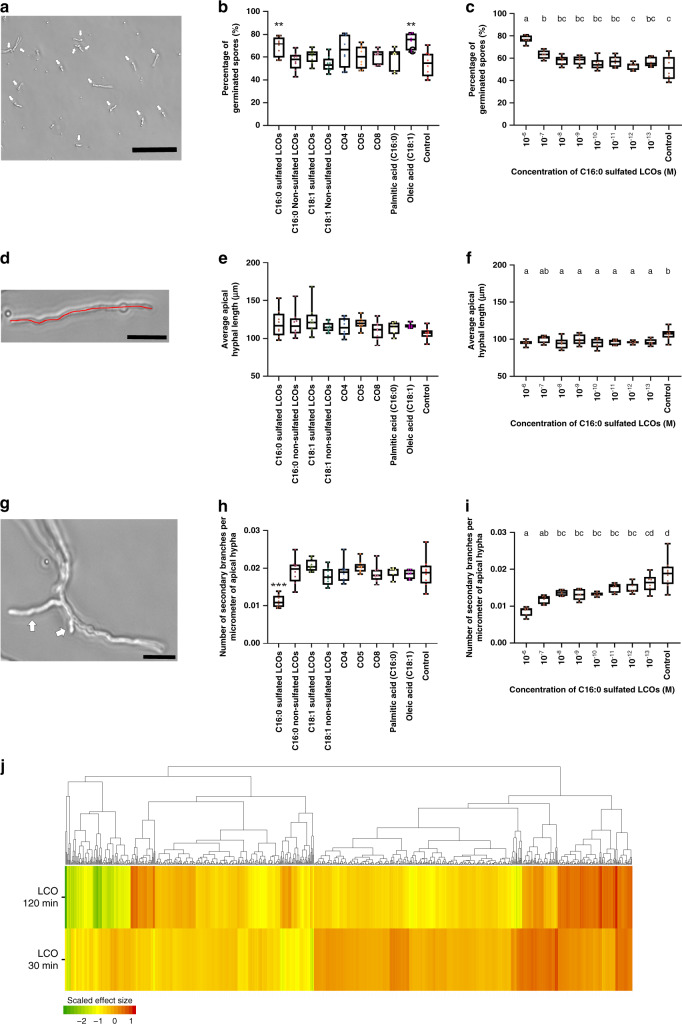
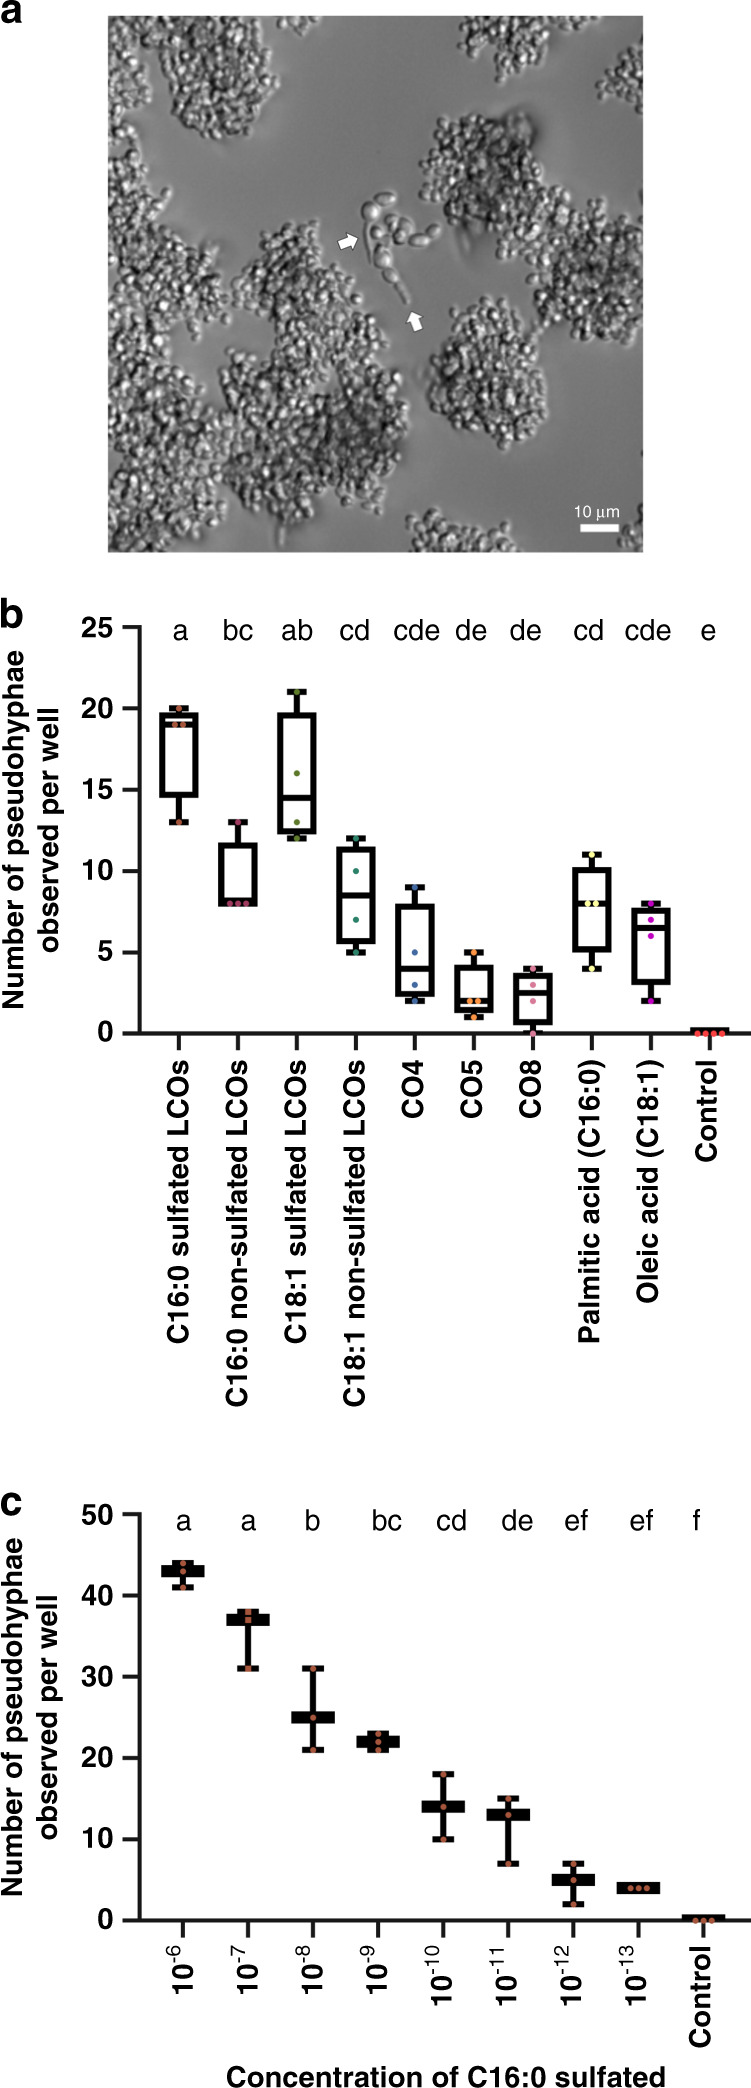
Lipo-chitooligosaccharides (LCOs) are signaling molecules produced by rhizobial bacteria that trigger the nodulation process in legumes, and by some fungi that also establish symbiotic relationships with plants, notably the arbuscular and ecto mycorrhizal fungi. Here, we show that many other fungi also produce LCOs. We tested 59 species representing most fungal phyla, and found that 53 species produce LCOs that can be detected by functional assays and/or by mass spectroscopy. LCO treatment affects spore germination, branching of hyphae, pseudohyphal growth, and transcription in non-symbiotic fungi from the Ascomycete and Basidiomycete phyla. Our findings suggest that LCO production is common among fungi, and LCOs may function as signals regulating fungal growth and development.


Conflict of interest statement

The authors declare no competing interests.

Figures

Fig. 1
Fig. 1. Production of lipo-chitooligosaccharides and chitooligosaccharides by fungi.
Fifty-nine fungi representing five of the eight phyla (indicated by colors) and three species of oomycetes (Heterokontophyta, green) were tested for the presence of lipo-chitooligosaccharide (LCO)s and chitooligosaccharide (CO)s in their culture supernatants. Black circle, detection of sulfated LCOs by the root hair branching assay with M. truncatula. Black square, detection of non-sulfated LCOs by the root hair branching assay with V. sativa. Black triangle, detection of sulfated LCOs in butanol extracts by MtENOD11 expression assay. Black star, detection of LCOs in butanol extracts by LC-MS/MS with high confidence (non-targeted mass spectrometry (MS) analysis or two to three MRM transitions per molecule). Blue star, detection of LCOs with lower confidence (MS signal at the expected retention time but with only one MRM transition). Black cross, detection of COs by HPLC/MS from water extracts. Clear symbols indicate no detection. Black asterisk indicates two or more strains were examined.
Fig. 2
Fig. 2. Structures of LCOs found in fungi.
a The generic structure of LCOs. b LCO structures determined by LC-MS/MS analysis of the butanol phase extract of culture media from fungi with various lifestyles. Red indicates the most abundant LCO structures. (§) indicates when untargeted mass spectrometry (MS) analysis was used. The other structures were detected in targeted MS mode (MRM) (see “Methods” for details of various possible MRM transitions). (*) indicates when more than one strain was analyzed. (n) is the number of residues of chitin oligomers, (R1) is the type of fatty acid, identified as saturated or unsaturated fatty acids. (R2–R6) are chemical substitutions: hydrogen (H), acetyl (Ac), carbamoyl (Cb), fucosyl (Fuc), fucosyl sulfate (FucS), methylfucosyl (MeFuc) and sulfate (S). (ϯ) indicates data published previously.
Fig. 3
Fig. 3. Effects of LCOs, COs, and fatty acids on A. fumigatus.
a Germinated spores are indicated by white arrows. The scale bar is 100 µm. b Percentage of germinated spores 10 h after treatment with various molecules at 10−8 M. (**) indicates a significant difference between C16:0 sulfated LCO or oleic acid treatments and the control according to Dunnett’s multiple comparison procedure, the p-value is 7.21 × 10−4. Each treatment was analyzed in eight independent wells, except the palmitic and oleic acid treatments that were analyzed in six of them. c Effect of a range of C16:0 sulfated LCO concentrations on the percentage of germinated spores; one-way ANOVA p-value of 6.32 × 10−8. Each LCO concentration was analyzed in six wells, except for the control treatments that were analyzed in eight of them. d An example of an apical hypha germinated from both sides of a spore whose length measured is indicated in red. Scale bar is 25 µm. e Length of apical hyphae after 12 h treatment with various molecules at 10−8 M. There were no significant differences between treatments. Each treatment was analyzed in eight independent wells, except palmitic and oleic acid treatments that were analyzed in six of them. f Effect of a range of C16:0 sulfated LCO concentrations on the apical hyphae length; one-way ANOVA p-value is 3.91 × 10−3. Each LCO concentration was analyzed in six independent wells, except the control which was analyzed in eight of them. g Germination of a control spore showing two secondary branches (arrows) on a germinating apical hypha. Scale bar is 25 µm. h The ratio of secondary branches per micrometer of apical hypha after 12 h treatment with various molecules at 10−8 M. (***) indicates a significant difference between C16:0 sulfated LCO treatments and the control according to Dunnett’s multiple comparison procedure, p-value is 5.89 × 10−9. Each treatment was analyzed in eight independent wells, except palmitic and oleic acid treatments, which were analyzed in six of them. The ratio was determined by calculating the number of secondary branches for that specific apical hyphal branch length. i Effect of a range of C16:0 sulfated LCO concentrations on the ratio of secondary branches; one-way ANOVA p-value is 1.54 × 10−9. Each LCO concentration was analyzed in six independent wells, except the control which was analyzed in eight of them. The ratio was determined by calculating the number of secondary branches for that specific apical hyphal branch length. In box plots (c, f, i), different letters indicate significant differences and similar letters indicate no difference according to Tukey’s single-step multiple comparison procedure. In the box plots (b, c, e, f, h, i), the bars represent the minimum value, the first quartile, the median, the third quartile, and the maximum value such that 25% of the data are in each section. j Heatmap showing the scaled effect size of differentially expressed genes 30 and 120 min after C16:0 sulfated LCO treatment at a concentration of 10−8 M compared with the control solution. Source data are provided as a Source Data file.
Fig. 4
Fig. 4. Effect of LCOs, COs, and fatty acids on C. glabrata.
a White arrows show pseudohyphae of C. glabrata (see also Supplementary Movies 1, 2, and 3). Scale bar is 10 µm. b The number of pseudohyphae observed per well after treatment for 12 h with various LCOs, COs, and fatty acids at 10−8 M. Different letters indicate significant differences and similar letters indicate no difference according to Tukey’s single-step multiple comparison procedure; one-way ANOVA p-value is 9.90 × 10−10. Each treatment was analyzed in four independent wells. c Effect of a range of C16:0 sulfated LCO concentrations on pseudohyphae formation; one-way ANOVA p-value is 4.67 × 10−12. Different letters indicate significant differences and similar letters indicate no difference according to Tukey’s single-step multiple comparison procedure. Each LCO concentration was analyzed in three independent wells. In the box plots (b, c), the bars represent the minimum value, the first quartile, the median, the third quartile, and the maximum value such that 25% of the data are in each section. Source data are provided as a Source Data file.

References

    1. Lerouge P, et al. Symbiotic host-specificity of Rhizobium meliloti is determined by a sulphated and acylated glucosamine oligosaccharide signal. Nature. 1990;344:781–784. - PubMed
    1. Dénarié J, Debellé F, Promé J-C. Rhizobium lipo-chitooligosaccharide nodulation factors: signaling molecules mediating recognition and morphogenesis. Annu. Rev. Biochem. 1996;65:503–535. - PubMed
    1. Sun J, et al. Activation of symbiosis signaling by arbuscular mycorrhizal fungi in legumes and rice. Plant Cell. 2015;27:823–838. - PMC - PubMed
    1. Maillet F, et al. Fungal lipochitooligosaccharide symbiotic signals in arbuscular mycorrhiza. Nature. 2011;469:58–63. - PubMed
    1. Venkateshwaran M, Volkening JD, Sussman MR, Ané J-M. Symbiosis and the social network of higher plants. Curr. Opin. Plant Biol. 2013;16:118–127. - PubMed

Publication types