Observational Study
. 2020 Aug 4;11(1):3883.
doi: 10.1038/s41467-020-17717-0.

MGMT genomic rearrangements contribute to chemotherapy resistance in gliomas

Affiliations
Observational Study

MGMT genomic rearrangements contribute to chemotherapy resistance in gliomas

Barbara Oldrini et al. Nat Commun. .

Abstract

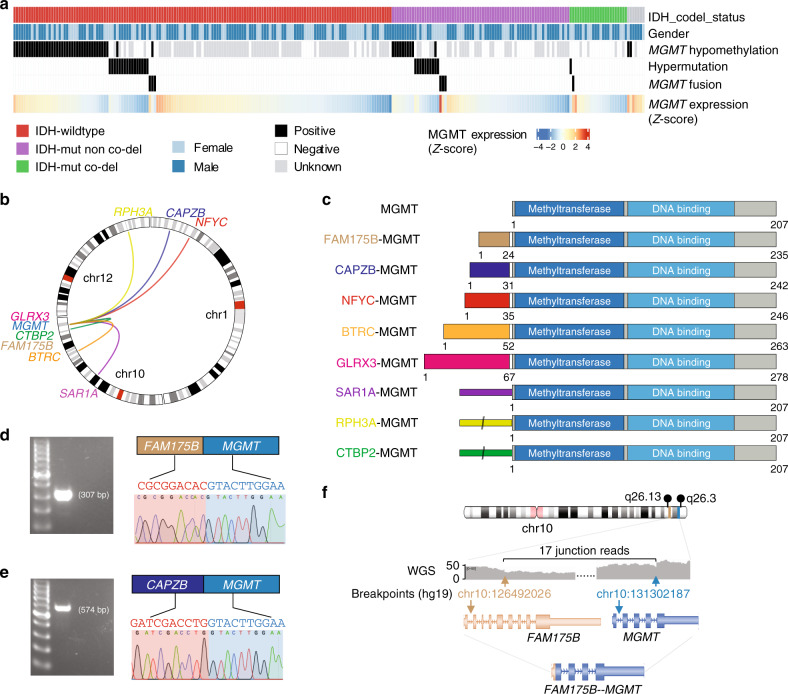
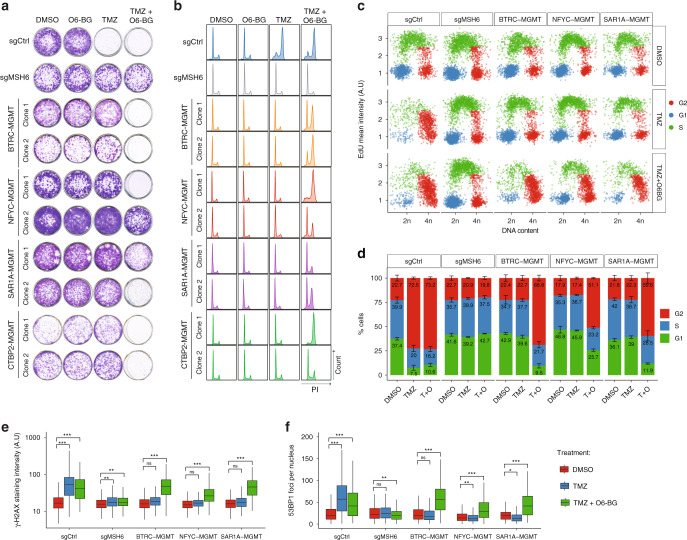
Temozolomide (TMZ) is an oral alkylating agent used for the treatment of glioblastoma and is now becoming a chemotherapeutic option in patients diagnosed with high-risk low-grade gliomas. The O-6-methylguanine-DNA methyltransferase (MGMT) is responsible for the direct repair of the main TMZ-induced toxic DNA adduct, the O6-Methylguanine lesion. MGMT promoter hypermethylation is currently the only known biomarker for TMZ response in glioblastoma patients. Here we show that a subset of recurrent gliomas carries MGMT genomic rearrangements that lead to MGMT overexpression, independently from changes in its promoter methylation. By leveraging the CRISPR/Cas9 technology we generated some of these MGMT rearrangements in glioma cells and demonstrated that the MGMT genomic rearrangements contribute to TMZ resistance both in vitro and in vivo. Lastly, we showed that such fusions can be detected in tumor-derived exosomes and could potentially represent an early detection marker of tumor recurrence in a subset of patients treated with TMZ.


Conflict of interest statement

The authors declare no competing interests.

Figures

Fig. 1
Fig. 1. Multiple MGMT fusions in TMZ-treated recurrent gliomas.
a Landscape of MGMT hypomethylation, MGMT fusions, DNA hypermutation. b Circos plot showing the identified MGMT fusions. c Structure of the MGMT fusion proteins. Each partner gene is indicated by color, and the narrow bars in SAR1A-MGMT, RPH3A-MGMT, and CTBP2-MGMT mean 5′UTR. d, e Validation of the MGMT fusion genes in positive samples by PCR and Sanger sequencing. The bands in the left panel were validated by Sanger sequencing in the right panel. Limited by specimen availability the validation was performed once. f The genomic rearrangement generating FAM175B-MGMT fusion. WGS whole-genome sequencing. Source data are provided as a Source Data file.
Fig. 2
Fig. 2. MGMT fusions cells show enhanced TMZ resistance via increased MGMT expression.
a Colony-forming assay performed on U251 and U87 cells expressing sgCtrl, BTRC-MGMT, NFYC-MGMT, SAR1A-MGMT, CTBP2-MGMT exposed for 12 days to TMZ (100 μM) or DMSO. b MGMT quantitative-PCRs performed on mRNA from U251 and U87 TMZ-resistant single-cell clones expressing the indicated MGMT fusions. Data are from a representative experiment of n = 3 biological replicate. Centre of the bars represent the mean (technical replicate n = 3) and the error bars are the standard deviations. c Analysis of MGMT promoter methylation, by methylation-specific PCR (MSP), in the TMZ-resistant cell clones expressing the indicated MGMT fusions from U251 (left panel) and U87 (right panel). M and U lanes indicate methylated and unmethylated status of the promoter, respectively. LN18 and U87 cells are shown as control for unmethylated and methylated, respectively. d Western blot analysis of MGMT protein levels in TMZ-resistant cell clones from U251 and U87 expressing the indicated MGMT fusions. Source data are provided as a Source Data file.
Fig. 3
Fig. 3. MGMT fusions protect from TMZ-induced damage.
a Clonogenic survival assay of U251 clones expressing MGMT fusions exposed to O6-BG (100 μM) or/and TMZ (100 μM) for 12 days. U251sgMSH6 cells are shown as control for TMZ resistance independently from MGMT. b Cell-cycle distribution of U251 MGMT fusion expressing cells in presence of O6-BG (100 μM) or/and TMZ (100 μM) for 72 h, measured by propidium iodide (PI) staining and FACS. U251 sgCtrl and sgMSH6 are shown as control. c High-throughput microscopy-mediated quantification of cell-cycle distribution at 48 h after treatment. See “Methods” for details. d Quantification of the percentage of cells in c. Data are from a representative experiment repeated in triplicate and presented as mean (technical replicate n = 3) and standard deviation. e, f High-throughput microscopy-mediated quantification of γH2AX intensity levels and 53BP1 foci in U251 cells expressing the MGMT fusions after 48 h of treatment with 100 μM of the indicated drugs. U251 sgCtrl and sgMSH6 were included as controls. The bottom and top of each box represents the first and third quartiles, and the line inside is the median. The whiskers correspond to 1.5 times the interquartile range. Data are representative of n = 3 biologically independent experiments. Two-sided Student’s t test with Bonferroni adjustment for multiple comparisons: ***P < 0.001, **P < 0.01, *P < 0.05, ns not significant, A.U. arbitrary unit. Source data are provided as a Source Data file.
Fig. 4
Fig. 4. MGMT fusions confer TMZ resistance in vivo and serve as biomarkers at recurrence.
a Top panel: scheme of the in vivo experimental design. Bottom panel: Kaplan–Meier survival curve of animals intracranially injected with U251 sgCtrl and U251 BTRC-MGMT clone 2 cells transduced with a luciferase construct, treated or not with TMZ (50 mg/Kg) for 5 days: sgCtrl Vehicle n = 4, sgCtrl TMZ n = 5, BTRC-MGMT vehicle n = 4, BTRC-MGMT TMZ n = 5. sgCtrl log-rank P-value = 0.0049, BTRC-MGMT log-rank P-value = 0.9273. b Representative luminescent images of the tumor bearing at the indicated time points. c Immunohistochemistry analysis against BrdU and γH2AX of tumors from mice injected with U251 sgCtrl and BTRC-MGMT clone 2 cells, treated or not with TMZ (50 mg/kg) for 3 days. Mice were sacrificed 2 h after BrdU injection. Scale bars: 100 μm. d Western blot analysis of the EXO markers Alix and TSG101 and of MGMT levels in samples pair of cells and cell-derived EXOs expressing sgCtrl and SAR1A-MGMT. e SAR1A-MGMT and MGMT mRNA expression by RT-PCR in RNA pair samples from cells and cell-derived EXOs expressing sgCtrl and SAR1A-MGMT. f Transcript levels of BTRC-MGMT by RT-PCR analysis in EXOs isolated from serum of BTRC-MGMT clone 2 tumor-bearing mice compared to sgCtrl mice. U251 sgCtrl and BTRC-MGMT clone 2 cells were included as controls. Source data are provided as a Source Data file.

References

    1. Kaina B, Christmann M, Naumann S, Roos WP. MGMT: key node in the battle against genotoxicity, carcinogenicity and apoptosis induced by alkylating agents. DNA Repair. 2007;6:1079–1099. doi: 10.1016/j.dnarep.2007.03.008. - DOI - PubMed
    1. Zhang J, Stevens MFG, Bradshaw TD. Temozolomide: mechanisms of action, repair and resistance. Curr. Mol. Pharmacol. 2012;5:102–114. doi: 10.2174/1874467211205010102. - DOI - PubMed
    1. Esteller M, et al. Inactivation of the DNA-repair gene MGMT and the clinical response of gliomas to alkylating agents. N. Engl. J. Med. 2000;343:1350–1354. doi: 10.1056/NEJM200011093431901. - DOI - PubMed
    1. Hegi ME, et al. MGMT gene silencing and benefit from temozolomide in glioblastoma. N. Engl. J. Med. 2005;352:997–1003. doi: 10.1056/NEJMoa043331. - DOI - PubMed
    1. Chen X, et al. A novel enhancer regulates MGMT expression and promotes temozolomide resistance in glioblastoma. Nat. Commun. 2018;9:2949. doi: 10.1038/s41467-018-05373-4. - DOI - PMC - PubMed

Publication types

MeSH terms