. 2020 Aug 4;10(1):13087.
doi: 10.1038/s41598-020-70002-4.

Sediment microbial fuel cells as a barrier to sulfide accumulation and their potential for sediment remediation beneath aquaculture pens

Affiliations

Sediment microbial fuel cells as a barrier to sulfide accumulation and their potential for sediment remediation beneath aquaculture pens

Christopher K Algar et al. Sci Rep. .

Abstract

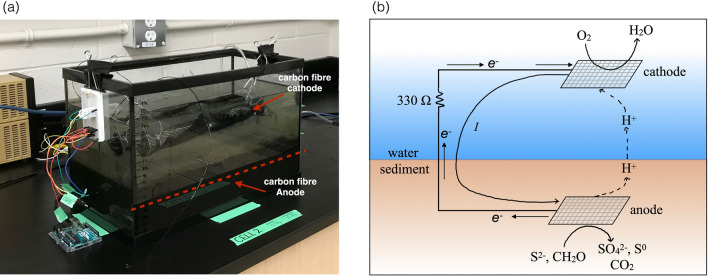
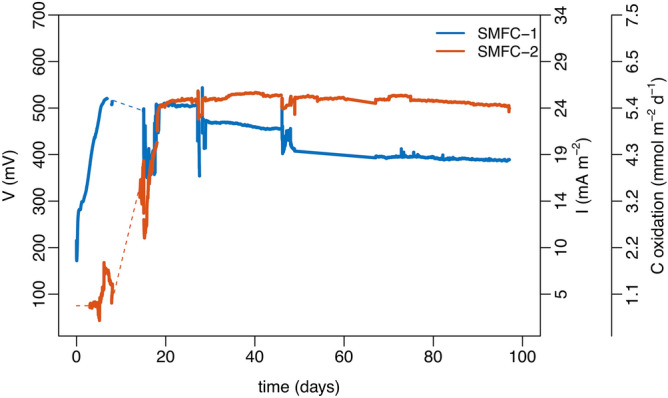
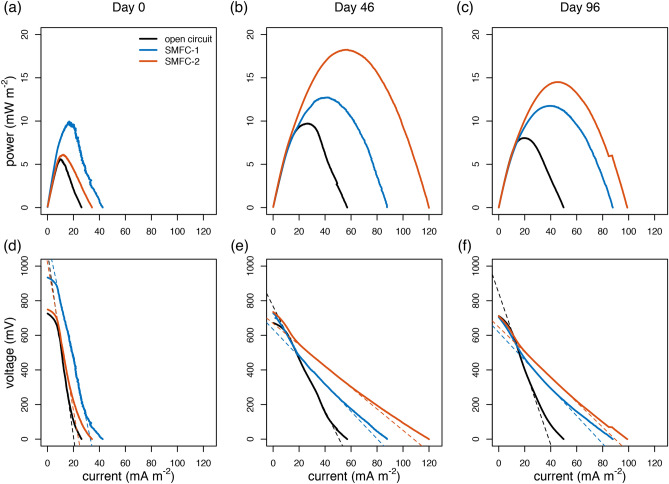
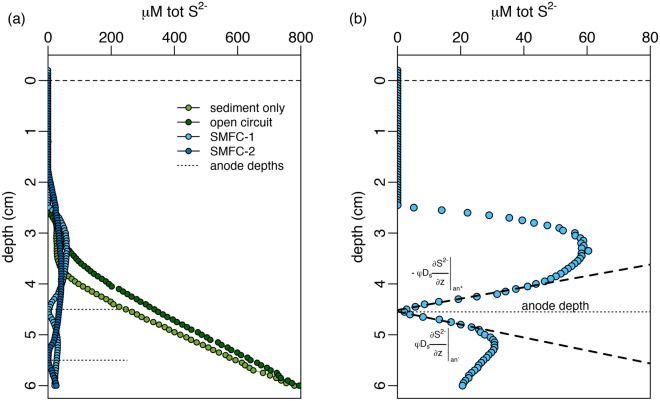
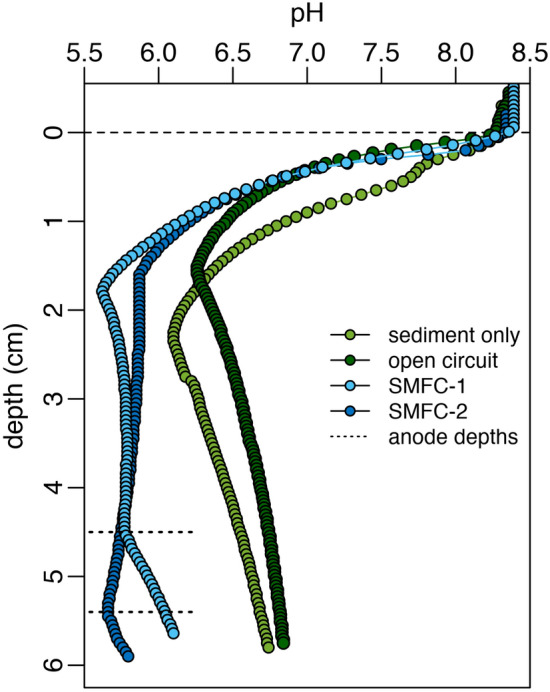
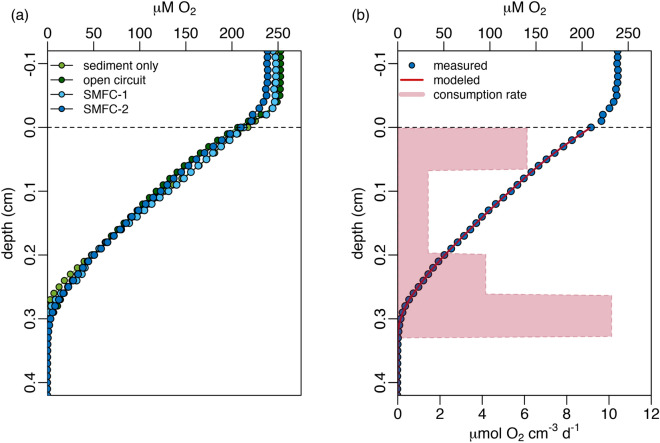
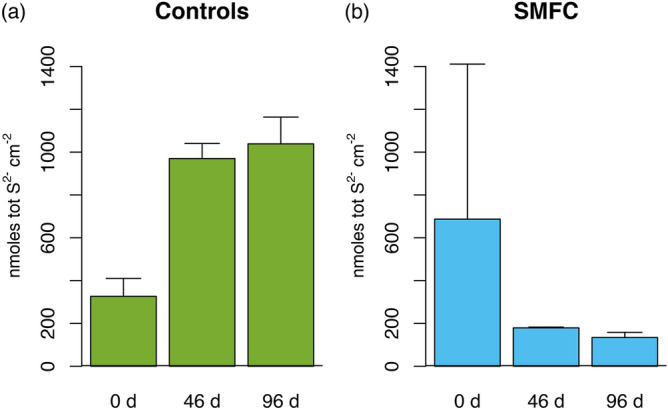
Sediment microbial fuel cells (SMFCs) generate electricity through the oxidation of reduced compounds, such as sulfide or organic carbon compounds, buried in anoxic sediments. The ability to remove sulfide suggests their use in the remediation of sediments impacted by point source organic matter loading, such as occurs beneath open pen aquaculture farms. However, for SMFCs to be a viable technology they must remove sulfide at a scale relevant to the environmental contamination and their impact on the sediment geochemistry as a whole must be evaluated. Here we address these issues through a laboratory microcosm experiment. Two SMFCs placed in high organic matter sediments were operated for 96 days and compared to open circuit and sediment only controls. The impact on sediment geochemistry was evaluated with microsensor profiling for oxygen, sulfide, and pH. The SMFCs had no discernable effect on oxygen profiles, however porewater sulfide was significantly lower in the sediment microcosms with functioning SMFCs than those without. Depth integrated sulfide inventories in the SMFCs were only 20% that of the controls. However, the SMFCs also lowered pH in the sediments and the consequences of this acidification on sediment geochemistry should be considered if developing SMFCs for remediation. The data presented here indicate that SMFCs have potential for the remediation of sulfidic sediments around aquaculture operations.


Conflict of interest statement

C. Algar and G. Wanger have filed a United States provisional patent (62/724861) related to this work. A. Howard and C. Ward declare no competing interests.

Figures

Figure 1
Figure 1
(a) One of the sediment microbial fuel cell microcosms used in the experiment (SMFC-2). The anode depth is indicated by the dashed red line. (b) Schematic diagram of the sediment microbial fuel cell showing directions of current, electron, and proton flow and possible oxidation and reduction reactions at the anode and cathode.
Figure 2
Figure 2
Voltage (V), and current density (I), recorded during the 96 day experiment for both SMFC-1 (blue line) and SMFC-2 (red line). Dashed lines show gaps in data. Current is expressed both as a current density normalized to the sediment footprint of the anode and as the equivalent rate of carbon oxidation assuming oxidation of 1 mol of carbon requires 4 mol of electrons.
Figure 3
Figure 3
Power density, and polarization curves during the experiment for the OC (black lines), SMFC-1 (blue lines) and SMFC-2 (red lines). Power and density are shown for day 0 (a), day 46 (b), and day 96 (c). Polarization curves are shown for day 0 (d), day 46 (e), and day 96 (f). The dashed lines in (df) are the linear portion of the polarization curves used to determine the internal resistance.
Figure 4
Figure 4
(a) Microsensor profiles of porewater sulfide (tot-S2− = H2S + HS + S2−) for all conditions; sediment only control (SO), open circuit control (OC), SMFC-1, and SMFC-2 on day 96. Anode depths for both SMFC-1 and 2 are indicated with dotted lines and the dashed line indicates the sediment–water interface. (b) Sulfide depth profile for SMFC-1 on day 96 showing the drawdown of sulfide to 0 μM at the anode depth (dotted line). The heavy dashed lines above and below the anode depth is the best fit line describing the linear decrease in sulfide as the anode is approached from either above or below.
Figure 5
Figure 5
pH profiles for controls (SO and OC), SMFC-1, and SMFC-2 on day 96. The dotted lines indicate the depth of the anodes in SMFC-1 and 2 and the dashed line the sediment–water interface.
Figure 6
Figure 6
(a) O2 profiles for controls (SO and OC), SMFC-1, and SMFC-2 on day 96. The dashed line represents the sediment–water interface. (b) A sample profile (SMFC-2 on day 96) comparing the measured profile (blue dots) and model fit from Eq. (4) (red line). The red shaded area shows the O2 consumption rate needed to fit the concentration profile.
Figure 7
Figure 7
Depth integrated sulfide inventories in the top 6 cm of sediment for (a) controls and (b) SMFC.

References

    1. El-Naggar MY, et al. Electrical transport along bacterial nanowires from Shewanella oneidensis MR-1. Proc. Natl. Acad. Sci. USA. 2010;107:18127–18131. - PMC - PubMed
    1. Du Toit A. Exporting electrons. Nat. Rev. Microbiol. 2018;16:657. - PubMed
    1. Lovley DR. Microbial fuel cells: novel microbial physiologies and engineering approaches. Curr. Opin. Biotechnol. 2006;17:327–332. - PubMed
    1. Myers JM, Myers CR. Role for outer membrane cytochromes OmcA and OmcB of Shewanella putrefaciens MR-1 in reduction of manganese dioxide. Appl. Environ. Microbiol. 2001;67:260–269. - PMC - PubMed
    1. Bond DR, Lovley DR. Electricity production by Geobacter sulfurreducens attached to electrodes. Appl. Environ. Microbiol. 2003;69:1548–1555. - PMC - PubMed

Publication types