. 2020 Aug 4;10(1):13094.
doi: 10.1038/s41598-020-69884-1.

Selective dysregulation of ROCK2 activity promotes aberrant transcriptional networks in ABC diffuse large B-cell lymphoma

Affiliations

Selective dysregulation of ROCK2 activity promotes aberrant transcriptional networks in ABC diffuse large B-cell lymphoma

Edd Ricker et al. Sci Rep. .

Abstract

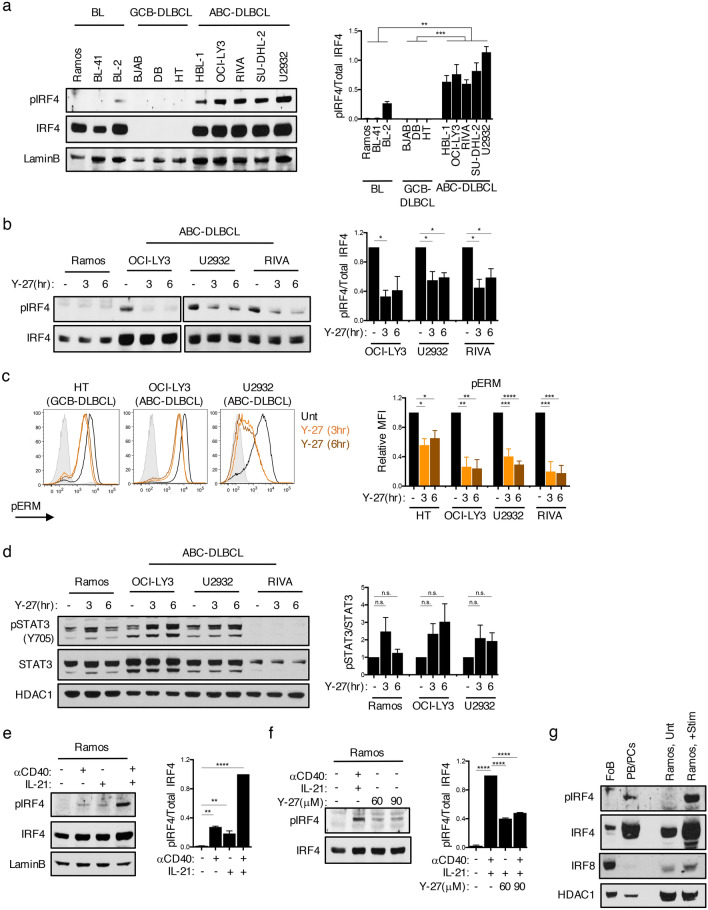
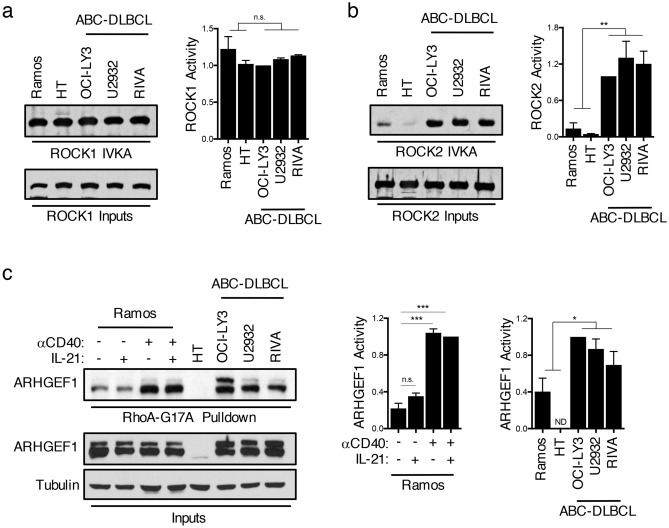
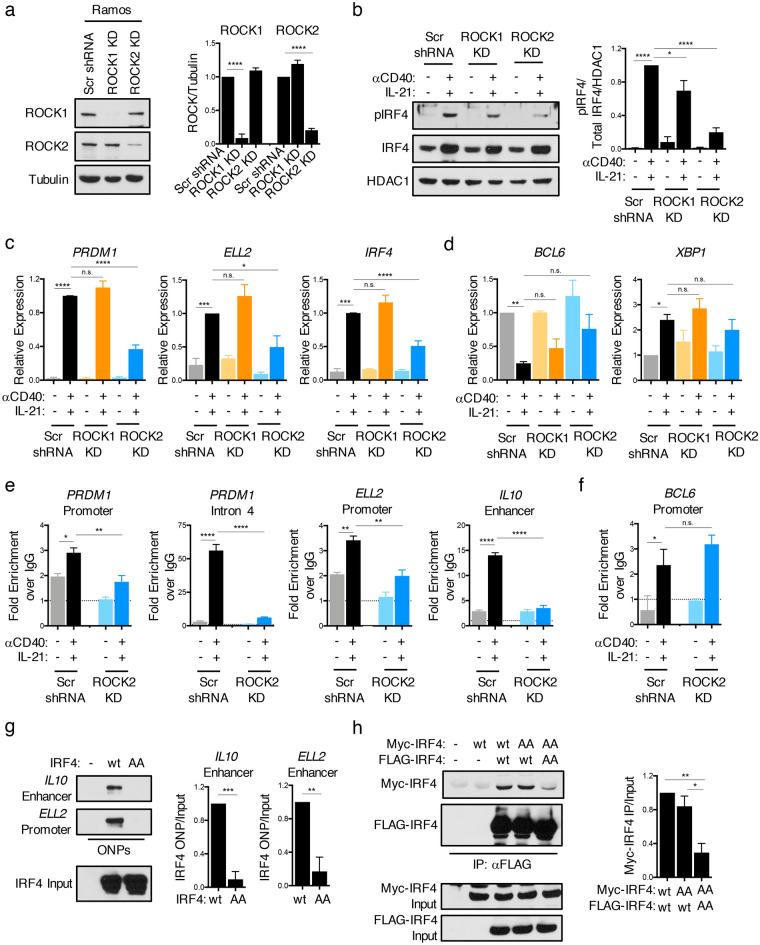
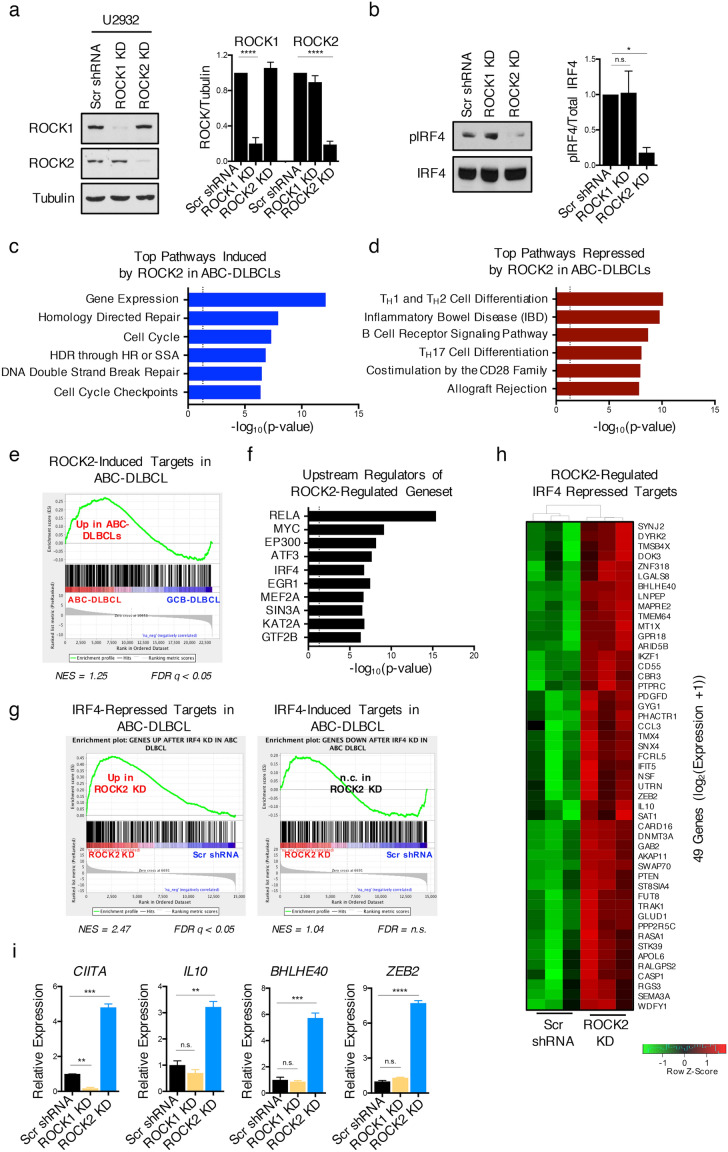
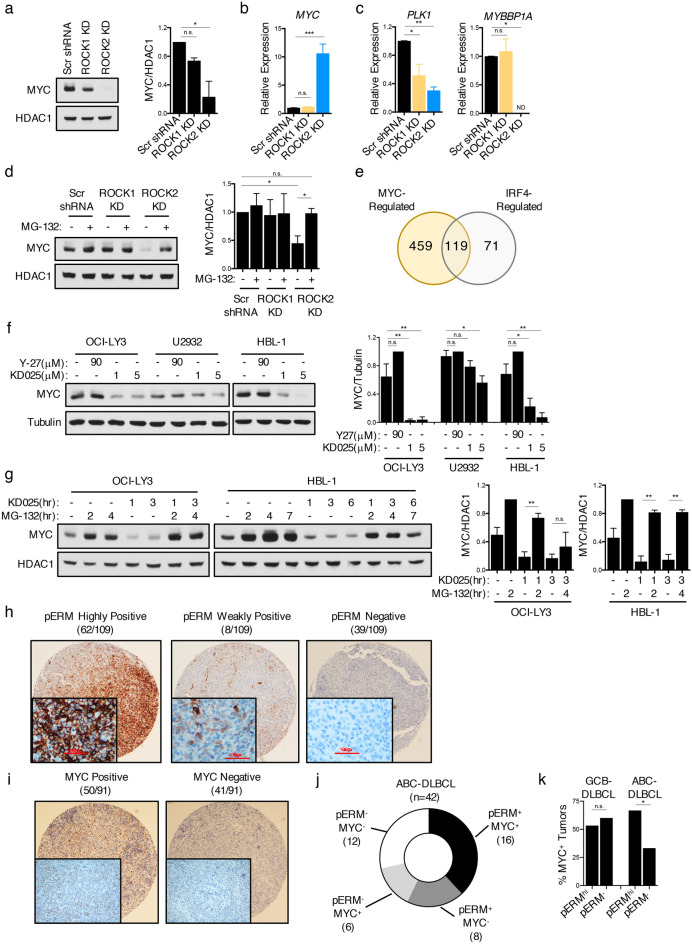
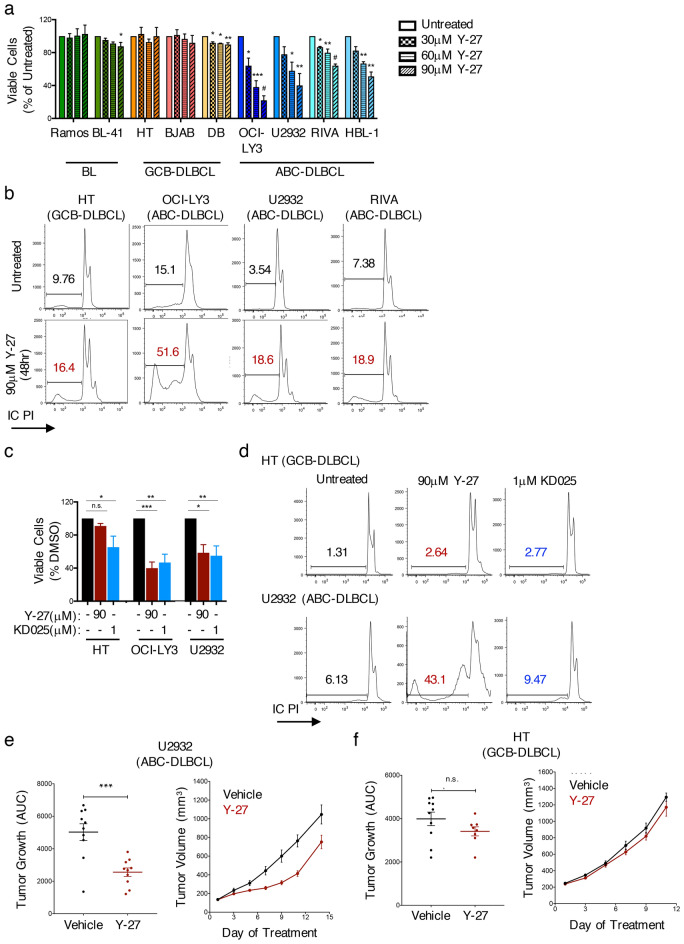
Activated B-cell-like diffuse large B-cell lymphoma (ABC-DLBCL) is an aggressive subtype of lymphoma usually associated with inferior outcomes. ABC-DLBCL exhibits plasmablastic features and is characterized by aberrancies in the molecular networks controlled by IRF4. The signaling pathways that are dysregulated in ABC-DLBCL are, however, not fully understood. ROCK2 is a serine-threonine kinase whose role in lymphomagenesis is unknown. Here we show that ROCK2 activity is constitutively dysregulated in ABC-DLBCL but not in GCB-DLBCL and BL. We furthermore show that ROCK2 phosphorylates IRF4 and that the ROCK2-mediated phosphorylation of IRF4 modulates its ability to regulate a subset of target genes. In addition to its effects on IRF4, ROCK2 also controls the expression of MYC in ABC-DLBCL by regulating MYC protein levels. ROCK inhibition furthermore selectively decreases the proliferation and survival of ABC-DLBCL in vitro and inhibits ABC-DLBCL growth in xenograft models. Thus, dysregulated ROCK2 activity contributes to the aberrant molecular program of ABC-DLBCL via its dual ability to modulate both IRF4- and MYC-controlled gene networks and ROCK inhibition could represent an attractive therapeutic target for the treatment of ABC-DLBCL.


Conflict of interest statement

ABP previously received an investigator-initiated research grant from Kadmon Corporation for studies of SLE T-cells. All other authors declare no competing interests.

Figures

Figure 1
Figure 1
IRF4 is constitutively phosphorylated in ABC-DLBCL. (a) Representative immunoblot and quantifications of phosphorylated IRF4 at S446/S447 (pIRF4), total IRF4, and LaminB from nuclear extracts of BL (Ramos, BL-41, BL-2), GCB-DLBCL (BJAB, DB, HT), and ABC-DLBCL (HBL-1, OCI-LY3, RIVA, SU-DHL-2, U2932) cells. Quantifications are calculated as the densitometry ratio between pIRF4 to total IRF4 (mean ± SEM; n =  > 3 per cell line; p value by 1-way ANOVA followed by Tukey’s multiple comparisons test). (b) Representative immunoblot and quantifications of indicated proteins from nuclear extracts of cells either left untreated or cultured in the presence of 90 μM Y-27632 (Y-27), a pan-ROCK inhibitor. Blot separation indicates different exposures of the same blot. Quantifications are calculated as in (a) (mean ± SEM; n =  > 2 per cell line; p value by 1-way ANOVA followed by Dunnett’s multiple comparisons test). (c) Representative histograms and quantifications of phosphorylated ERM (pERM) expression in DLBCL cells either left untreated or following treatment with 90 μM Y-27 (mean ± SEM; n =  > 3; p value by 1-way ANOVA followed by Dunnett’s multiple comparisons test). (d) Representative immunoblot and quantifications of phosphorylated STAT3 (pSTAT3; Y705), total STAT3, and HDAC1 from nuclear extracts of cell lines either left untreated or cultured with Y-27 as in (b). Quantifications are calculated as the densitometry ratio of pSTAT3 to total STAT3 (mean ± SEM; n = 2; p value by 1-way ANOVA followed by Dunnett’s multiple comparisons test). (e) Representative immunoblot and quantifications of indicated proteins from nuclear extracts of Ramos cells treated for 6 h with various combinations of αCD40 and IL-21. Quantification is calculated as in (a) (mean ± SEM; n = 2; p value by 1-way ANOVA followed by Dunnett’s multiple comparisons test). (f) Representative immunoblot and quantifications of indicated proteins from nuclear extracts of Ramos cells pre-treated for 2 h with Y-27 before stimulation as in (e). Quantification is calculated as in (e) (mean ± SEM; n = 2; p value by 1-way ANOVA followed by Tukey’s multiple comparisons test). (g) Representative immunoblot of indicated proteins from lysates of sorted follicular B-cells (FoBs; Blimp1-yfpCD138-B220+CD23+) or plasmablasts/plasma cells (PB/PCs; Blimp1-yfp+CD138+) from Blimp1-yfp reporter mice at d7 post-immunization with 100 μg NP-CGG. Ramos cells were used as a control. Data representative of 3 independent experiments. * p < 0.05, ** p < 0.01, *** p < 0.001, **** p < 0.0001.
Figure 2
Figure 2
Dysregulated activation of ROCK2 in ABC-DLBCLs. (a–b) ROCK1 and ROCK2 kinase activity was assayed by incubating immunoprecipitated ROCK1 (a) or ROCK2 (b) from nuclear extracts of BL, GCB-DLBCL, or ABC-DLBCL cell lines with purified recombinant MYPT1 as a substrate in the presence of ATP. Phosphorylated MYPT1 (pMYPT1) was detected using an antibody against pMYPT1. Total ROCK1 or ROCK2 input levels for each sample are shown in the lower panels. Quantifications are calculated as the densitometry ratio between pMYPT1 to total ROCK input protein (mean ± SEM; n = 2; p value by unpaired two-tailed t test). (c) RhoA-G17A-conjugated agarose beads were used to pull-down active ARHGEF1 from lysates of GCB-DLBCL, ABC-DLBCL, or Ramos cells following 6 h treatment with various combinations of αCD40 and IL-21. Quantifications are calculated as the densitometry ratio between ARHGEF1 from the RhoA-G17A pull-down to ARHGEF1 input levels [mean ± SEM; n =  > 2; p value by 1-way ANOVA followed by Dunnett’s multiple comparisons test (left) or by unpaired two-tailed t test (right)]. * p < 0.05, ** p < 0.01, *** p < 0.001, **** p < 0.0001.
Figure 3
Figure 3
ROCK2 regulates the expression of a subset of IRF4 target genes in stimulated B-cells. (a) Representative immunoblot and quantifications of ROCK1 and ROCK2 from lysates of Ramos cells after stable lentiviral infection with shRNA constructs targeting either ROCK1 (ROCK1 KD), ROCK2 (ROCK2 KD), or with a scrambled shRNA control (Scr shRNA). Quantifications are calculated as the densitometry ratio between each ROCK protein to β-Tubulin (mean ± SEM; n = 3; p value by 1-way ANOVA followed by Dunnett’s multiple comparisons test). (b–f) Stable Ramos ROCK1 KD (orange), ROCK2 KD (blue), and Scr (black) control cells were left untreated or stimulated for 6 h with αCD40 and IL-21. (b) Representative immunoblot and quantifications of pIRF4 and total IRF4 from nuclear extracts of stable Ramos ROCK KD cells. Quantifications are calculated as the densitometry ratio between pIRF4 to the ratio of total IRF4 to HDAC1 (mean ± SEM; n = 3; p value by 1-way ANOVA followed by Dunnett’s multiple comparisons test). (c–d) Pooled RT-qPCR analysis of indicated transcripts (mean ± SEM; n = 4; p value by 1-way ANOVA followed by Dunnett’s multiple comparisons test). (e–f) Representative ChIP-qPCR analysis of IRF4 binding to regulatory regions in the PRDM1, ELL2, IL10, and BCL6 loci (mean ± SD; n = 2; p value by 1-way ANOVA followed by Dunnett’s multiple comparisons test). (g) Oligonucleotide precipitation assays (ONPs) of extracts from 293 T cells transfected with wt or phosphomutant (AA) IRF4, assessed with biotinylated oligonucleotides from the IL10 enhancer or the ELL2 promoter region, followed by immunoblot of precipitated IRF4. Quantifications are calculated as the densitometry ratio between IRF4 precipitated during the ONP to input IRF4 levels (mean ± SEM; n = 3; p value by unpaired t test). (h) 293 T cells were co-transfected with MYC-tagged IRF4-wt or MYC-tagged IRF4-AA and either FLAG-tagged IRF4-wt or FLAG-tagged IRF4-AA as indicated. Immunoprecipitations were performed using an anti-FLAG antibody and analyzed by immunoblotting. Quantifications are calculated as the densitometry ratio between precipitated MYC-tagged IRF4 protein to input MYC-tagged IRF4 (mean ± SEM; n = 3; p value by 1-way ANOVA followed by Tukey’s multiple comparisons test). * p < 0.05, ** p < 0.01, *** p < 0.001, **** p < 0.0001.
Figure 4
Figure 4
ROCK2 regulates the expression of IRF4-repressed targets in ABC-DLBCL. (a) Representative immunoblot and quantifications of ROCK1 and ROCK2 from lysates of U2932 cells after stable lentiviral infection with shRNA expression constructs targeting either ROCK1 (ROCK1 KD), ROCK2 (ROCK2 KD) or with a scrambled shRNA control (Scr shRNA). Quantifications are calculated as the densitometry ratio between each ROCK protein to β-Tubulin (mean ± SEM; n = 4; p value by 1-way ANOVA followed by Dunnett’s multiple comparisons test). (b) Representative immunoblot and quantifications of phosphorylated IRF4 at S446/S447 (pIRF4) and total IRF4 from nuclear extracts of stable U2932 ROCK KD cells. Quantifications are calculated as the densitometry ratio between pIRF4 to total IRF4 (mean ± SEM; n = 5; p value by 1-way ANOVA followed by Dunnett’s multiple comparisons test). (c–g) RNA-seq analysis was performed on U2932 ROCK2 KD cells. (c–d) Plots showing the -log10 (p value) values for the top over-represented pathways from the genes induced (c) or repressed (d) by ROCK2 in U2932. Dotted lines indicate significance cutoffs at p = 0.05. (e) GSEA plot showing the significant enrichment of the ROCK2-induced geneset from U2932 (Table S1) in primary ABC-DLBCL cases. (f) Plot showing the top enriched upstream regulators of the ROCK2-regulated geneset in U2932 using EnrichR analysis. Dotted line indicates significance cutoff at p = 0.05. (g) GSEA plot showing the significant enrichment of previously defined IRF4-repressed and IRF4-induced genesets from ABC-DLBCLs in U2932 ROCK2 KD cells. (h) Heat map depiction of target genes identified in (f) that are contributing to the enrichment of the “IRF4-repressed targets in ABC-DLBCL” pathway and are differentially expressed in U2932 ROCK2 KD cells. (i) Representative RT-qPCR analysis of the indicated genes in U2932 ROCK1 KD (orange), ROCK2 KD (blue), or scrambled shRNA control cells (black). Data representative of 3 independent experiments (mean ± SD; p value by 1-way ANOVA followed by Dunnett’s multiple comparisons test). * p < 0.05, ** p < 0.01, *** p < 0.001, **** p < 0.0001.
Figure 5
Figure 5
ROCK2 regulates the levels of MYC Protein in ABC-DLBCL. (a–d) Stable ROCK knockdowns were generated in U2932 cells following lentiviral infection with shRNA constructs as in Fig. 4. (a) Representative immunoblot and quantifications of MYC expression. Quantifications are calculated as the densitometry ratio between MYC to HDAC1 (mean ± SEM; n = 2; p value by 1-way ANOVA followed by Dunnett’s multiple comparisons test). (b–c) Pooled RT-qPCR analysis of indicated genes from U2932 ROCK2 KD (blue), ROCK1 KD (orange) and scrambled shRNA control (black) cells (mean ± SEM; n = 3; p value by 1-way ANOVA followed by Dunnett’s multiple comparisons test). (d) Representative immunoblot and quantifications of MYC expression from nuclear extracts of U2932 ROCK KD cells left untreated or following treatment with 5 μM MG-132 for 2 h. Quantifications are calculated as the densitometry ratio between MYC to HDAC1 (mean ± SEM; n = 3; p value by unpaired two-tailed t tests). (e) Venn diagram showing the overlap of IRF4 and MYC targets from the EnrichR upstream regulator analysis on the U2932 ROCK2-regulated geneset in Fig. 4e. (f) Representative immunoblot and quantifications of MYC expression from extracts of DLBCL cells treated for 6 h with Y-27 or KD025 as indicated. Blot separation indicates experiments run on separate gels. Quantifications are calculated as the densitometry ratio between MYC to β-Tubulin (mean ± SEM; n = 3; p value by 1-way ANOVA followed by Dunnett’s multiple comparisons test). (g) Representative immunoblot and quantifications of MYC expression from nuclear extracts of DLBCL cells pre-treated with 5 μM MG-132 for 1 h prior to treatment with 5 μM KD025 for the indicated times. Blot separation indicates experiments run on separate gels. Quantifications are calculated as in (d) (mean ± SEM; n = 3; p value by unpaired two-tailed t tests). (h–i) Immunohistochemistry of pERM (h) and MYC (I) on primary DLBCL TMAs. (J) Plot showing the frequency of ABC-tumors expressing both pERM and MYC. (k) Plot showing the percentage of MYC-positive tumors among pERM+ and pERM- tissues in GCB-DLBCL and ABC-DLBCL cases. Statistics based on z-test to compare the total numbers of cases in each subgroup. * p < 0.05, ** p < 0.01, *** p < 0.001, **** p < 0.0001.
Figure 6
Figure 6
ROCK inhibition selectively decreases the survival of ABC-DLBCL. (a) Viability analysis of BL, GCB-DLBCL, and ABC-DLBCL cell lines following 4 days treatment with 0 μM, 30 μM, 60 μM, or 90 μM Y-27 as determined by MTS proliferation assay (mean ± SEM; n =  > 2 per cell line; p value by 1-way ANOVA followed by Dunnett’s multiple comparisons test). (b) Representative histograms of propidium iodide (PI) incorporation showing the sub-G0 cell populations in DLBCL cells either left untreated or following 48 h treatment with 90 μM Y-27. Data representative of 3 independent experiments per cell line. (c) MTS proliferation assay of DLBCL cells following 4 days treatment with 90 μM Y-27 or 1 μM KD025 (mean ± SEM; n =  > 4 per cell line; p value by 1-way ANOVA followed by Dunnett’s multiple comparisons test). (d) Representative histograms of PI incorporation in DLBCL cells treated for 48 h with 90 μM Y-27 or 1 μM KD025. Data representative of 3 independent experiments per cell line. (e–f) U2932 (e) and HT (f) cells were established as a subcutaneous tumor in immunodeficient NSG mice and treated daily for 10–15 days with PBS (vehicle) or 40 mg/kg Y-27 by intraperitoneal injection. Tumor progression was monitored as a function of tumor volume. Data pooled from 8–10 mice per treatment condition per cell line. * p < 0.05, ** p < 0.01, *** p < 0.001, # p < 0.0001.

References

    1. Basso K, Dalla-Favera R. Germinal centres and B-cell lymphomagenesis. Nat. Rev. Immunol. 2015;15:172–184. doi: 10.1038/nri3814. - DOI - PubMed
    1. Shaffer AL, 3rd, Young RM, Staudt LM. Pathogenesis of human B-cell lymphomas. Annu. Rev. Immunol. 2012;30:565–610. doi: 10.1146/annurev-immunol-020711-075027. - DOI - PMC - PubMed
    1. Victora GD, et al. Identification of human germinal center light and dark zone cells and their relationship to human B-cell lymphomas. Blood. 2012;120:2240–2248. doi: 10.1182/blood-2012-03-415380. - DOI - PMC - PubMed
    1. Victora GD, Nussenzweig MC. Germinal centers. Annu. Rev. Immunol. 2012;30:429–457. doi: 10.1146/annurev-immunol-020711-075032. - DOI - PubMed
    1. Alizadeh AA, et al. Distinct types of diffuse large B-cell lymphoma identified by gene expression profiling. Nature. 2000;403:503–511. doi: 10.1038/35000501. - DOI - PubMed

Publication types

MeSH terms

Substances